
Reports
Reports
With enterprises aiming for business expansion, the demand for efficient collaboration solutions is at all-time high. Mobile workforce and efficiency in enterprise mobility are the two major aspects required by organizations to achieve this. Considering the scenario, the global enterprise collaboration service market is forecast to report a CAGR of 10.3% between 2016 and 2024. Transparency Market Research (TMR) forecasts the market to reach US$56.51 bn by the end of 2024. In 2015, overall valuation of the global enterprise collaboration service market stood at US$23.38 bn.
In addition, the market is also expected to gain from the increasing demand for integrated and comprehensive enterprise collaboration services. Also the rising use of SIP trunking and the increasing uptake of WebRTC across KPOs and BPOs will widen the scope for the market’s expansion. As a result of the development of advanced collaboration solutions companies can now offer better connectivity among stakeholders. Driven by these factors, the global enterprise collaboration service market will exhibit strong growth over the course of the forecast period.
Regionally, North America emerged dominant in the global enterprise collaboration services market, holding a share of 41.8% in 2015. With multinational companies in the U.S. and Canada aiming from expanding their regional footprint, collaborations have become a common activity in this part of the world. Evidently, North America realizes some of the most lucrative opportunities for the overall market. Moreover, the region for years has remained at the fore of adopting well-designed collaboration tools such as application sharing tools, video and audio conferencing software, and web services. This has further helped the North America enterprise collaboration service market gain traction.
However, TMR projects the Asia Pacific market to report a higher CAGR compared to its counterpart in North America and elsewhere. Growth witnessed in the region is primarily driven by the increasing number of small and medium enterprises in countries such as India, Japan, and China. Moreover, the rapid expansion of the IT industry witnessed in Asia Pacific in the last few years, will fuel the demand for automation across industries thus bolstering opportunities for the enterprise collaboration service market.
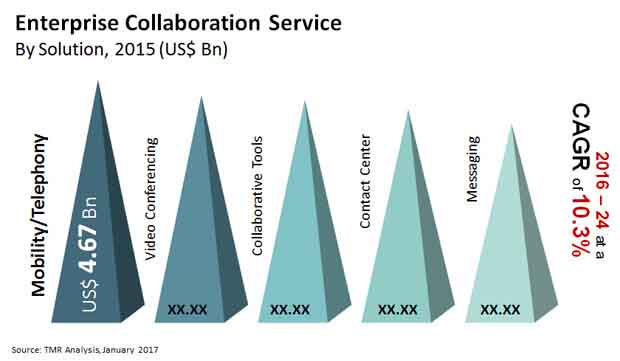
By solution, video-conferencing, messaging, contact center, collaboration tools, and mobility/telephony are the key market segments. Of these, video conferencing held the dominant share of 22.6% in the overall market in 2016. However, in the forecast period the segment is forecast to lose shares to mobility and telephony. Rise in demand for collaborative tools will also shift focus from video conferencing in the coming years. Moreover, the segment is projected to gain from recent developments in business intelligence as an interactive collaboration tool. Considering growth witnessed across its key segments, favorable opportunities are prophesized for the overall enterprise collaboration service market.
Based on type, hardware, software, and services constitute the key market segments. Among these, the demand for services is expected to rise at the highest pace during the forecast period. Growth witnessed in the segment is steered by the rising adoption of collaboration services especially among small and medium businesses. Deploying these services has helped organizations in delegating activities such as maintenance as well integration operations to third parties so that they can focus on their core competencies. Besides this, the software segment is expected to gain significant traction in the coming years.
Some of the key players operating in the market are Mitel Networks Corporation, Polycom, Inc., Fuze Inc., 8x8, Inc., ShoreTel Inc., Cafex Communications Inc., Tropo, Inc., Vonage networks LLC, Xura, Inc., Atlassian Corp PLC and GENBAND, Inc.
Enterprise collaboration service (ECS) is gaining traction among various companies operating in many industries owing to plethora of advantages it offers. ECS refers to a complete set of networking abilities and collaborative processes. Through this service, employees can collect, process, store, share, and jointly modify data and information with each another regardless of their geographic locations.
Owing to the recent COVID-19 pandemic, major companies from all across the globe have compelled their employees to work from home. As a result, there is remarkable growth in adoption of enterprise collaboration services for the smooth functioning of all activities across the organizations. This scenario has created promising sales avenues for vendors working in the global enterprise collaboration service market. Collaboration services include a wide range of technologies such as document sharing capabilities, video conferencing, and groupware. Enterprise communication services can also comprise email, phone, texting, video conference, and web chats.
Besides employees, any organization comprises many important stakeholders including vendors, customers, partners, and contractors. Thus, the companies engaged in the global enterprise collaboration service market are rolling out diverse hardware and software technologies. The main motive of these technologies is to achieve efficient teamwork with other stakeholders, and thereby assisting enterprises to gain their business targets. The global enterprise collaboration service market is predicted to gather promising sales avenues in the upcoming years. This growth is attributed to increased acceptance of SIP trunking and growing use of WebRTC across BPOs and KPOs.
Major companies working in the enterprise collaboration service market are growing focus toward improving the quality of services they offer. As a result, they are seen growing investments in research and development activities. Apart from this, several enterprises are engaging in mergers and acquisitions activities. These strategies are helping stakeholders to expand their regional presence as well as maintain their leading position in the global enterprise collaboration service market.
1.Preface
1.1.Market Definition and Scope
1.2.Market Segmentation
1.3.Key Research Objectives
1.4.Research Highlights
2.Assumptions and Research Methodology
3.Executive Summary : Enterprise Collaboration Services Market
4.Market Overview
4.1.Introduction
4.1.1. Product Definition
4.1.2.Evolution/Development
4.2.Global UCaaS Market Overview
4.3.Key Market Indicators
4.3.1.Impact Analytics: SIP Trunking on Business Process Outsourcing Market
4.3.2.Impact Analysis: WebRTC on Video Conferencing Market
4.4.Market Dynamics
4.4.1.Drivers
4.4.2.Restraints
4.4.3.Opportunities
4.5.Global Enterprise Collaboration Service Market Analysis and Forecasts, 2014 – 2024
4.5.1.Market Revenue Projection (US$ Bn)
4.6.Porter’s Five Force Analysis
4.7.Value Chain Analysis
4.7.1.List of Active Market Participants (Provider/Integrator/Aggregator/Supplier)
4.7.2.Forward – Backward Integration Scenario
4.8.Market Outlook
5.Global Enterprise Collaboration Service Market Analysis and Forecasts, By Solution
5.1.Introduction & Definitions
5.2.Key Findings/Developments
5.3.Key Trends
5.4.Market Size (US$ Bn) Forecast By Solution, 2014 - 2024
5.4.1.Messaging, 2014 – 2024 (US$ Bn)
5.4.2.Video Conferencing, 2014 – 2024 (US$ Bn)
5.4.3.Contact Center, 2014 – 2024 (US$ Bn)
5.4.4.Mobility/Telephony, 2014 – 2024 (US$ Bn)
5.4.5.Collaborative Tools, 2014 – 2024 (US$ Bn)
5.4.5.1.Email
5.4.5.2.Application Sharing
5.4.5.3.Web Services
5.4.5.4.Search Services
5.4.5.5.Office Suite
5.4.5.6.Resource Management
5.4.5.7.Process Management
5.4.5.8.Business Intelligence
5.5.Solution Comparison Matrix
5.6.Market Attractiveness By Solution
6.Global Enterprise Collaboration Service Market Analysis and Forecasts, By Deployment
6.1.Introduction & Definition
6.2.Key Findings/Developments
6.3.Key Trends
6.4.Market Size (US$ Bn) Forecast By Deployment, 2014 - 2020
6.4.1.On-Premise, 2014 – 2024 (US$ Bn)
6.4.2.Off-Premise, 2014 – 2024 (US$ Bn)
6.5.Deployment Comparison Matrix
6.6.Market Attractiveness By deployment
7.Global Enterprise Collaboration Service Market Analysis and Forecasts, By Type
7.1.Introduction & Definition
7.2.Key Findings/Developments
7.3.Key Trends
7.4.Market Size (US$ Bn) Forecast By Type, 2014 - 2020
7.4.1.Hardware, 2014 – 2024 (US$ Bn)
7.4.2.Software, 2014 – 2024 (US$ Bn)
7.4.3.Services, 2014 – 2024 (US$ Bn)
7.4.3.1.Consulting
7.4.3.2.Integration
7.4.3.3.Maintenance
7.5.Type Comparison Matrix
7.6.Market Attractiveness By Type
8.Global Enterprise Collaboration Service Market Analysis and Forecasts, By End-Use Application
8.1.Introduction & Definition
8.2.Key Findings/ Developments
8.3.Key Trends
8.4.Market Size (US$ Bn) Forecast By End-use Application, 2014 - 2024
8.4.1.BFSI, 2014 – 2024 (US$ Bn)
8.4.2.Retail, 2014 – 2024 (US$ Bn)
8.4.3.Healthcare, 2014 – 2024 (US$ Bn)
8.4.4.Government, 2014 – 2024 (US$ Bn)
8.4.5.Information Technology, 2014 – 2024 (US$ Bn)
8.4.6.Media and Entertainment, 2014 – 2024 (US$ Bn)
8.4.7.Education, 2014 – 2024 (US$ Bn)
8.4.8.Other (Transportation and Manufacturing), 2014 – 2024 (US$ Bn)
8.5.End-use Application Comparison Matrix
8.6.Market Attractiveness By End-use Application
9.Global Enterprise Collaboration Service Market Analysis and Forecasts, By Region
9.1.Key Findings
9.2.Market Size (US$ Bn) Forecast By Region, 2014 - 2020
9.2.1.North America, 2014 – 2024 (US$ Bn)
9.2.2.Europe, 2014 – 2024 (US$ Bn)
9.2.3.Asia-Pacific, 2014 – 2024 (US$ Bn)
9.2.4.Middle-East and Africa, 2014 – 2024 (US$ Bn)
9.2.5.South America, 2014 – 2020 (US$ Bn)
9.3.Market Attractiveness By Region
10.North America Enterprise Collaboration Services Market Analysis and Forecast
10.1.Key Findings
10.2.Key Trends
10.3.Market Size (US$ Bn) Forecast By Solution, 2014 - 2024
10.3.1.Messaging, 2014 – 2024 (US$ Bn)
10.3.2.Video Conferencing, 2014 – 2024 (US$ Bn)
10.3.3.Contact Center, 2014 – 2024 (US$ Bn)
10.3.4.Mobility/Telephony, 2014 – 2024 (US$ Bn)
10.3.5.Collaborative Tools, 2014 – 2024 (US$ Bn)
10.3.5.1.Email
10.3.5.2.Application Sharing
10.3.5.3.Web Services
10.3.5.4.Search Services
10.3.5.5.Office Suite
10.3.5.6.Resource Management
10.3.5.7.Process Management
10.3.5.8.Business Intelligence
10.4.Market Size (US$ Bn) Forecast By Deployment, 2014 - 2024
10.4.1.On-Premise, 2014 – 2024 (US$ Bn)
10.4.2.Off-Premise, 2014 – 2024 (US$ Bn)
10.5.Market Size (US$ Bn) Forecast By Type 2014 - 2024
10.5.1.Hardware, 2014 – 2024 (US$ Bn)
10.5.2.Software, 2014 – 2024 (US$ Bn)
10.5.3.Services, 2014 – 2024 (US$ Bn)
10.5.3.1.Consulting
10.5.3.2.Integration
10.5.3.3.Maintenance
10.6.Market Size (US$ Bn) Forecast By End-use Application, 2014 - 2024
10.6.1.BFSI, 2014 – 2024 (US$ Bn)
10.6.2.Retail, 2014 – 2024 (US$ Bn)
10.6.3.Healthcare, 2014 – 2024 (US$ Bn)
10.6.4.Government, 2014 – 2024 (US$ Bn)
10.6.5.Information Technology, 2014 – 2024 (US$ Bn)
10.6.6.Media and Entertainment, 2014 – 2024 (US$ Bn)
10.6.7.Education, 2014 – 202 (US$ Bn)
10.6.8.Other (Transportation and Manufacturing), 2014 – 2024 (US$ Bn)
10.7.Market Size (US$ Bn) Forecast By Country
10.7.1.The U.S., 2014 – 2024 (US$ Bn)
10.7.2.Canada, 2014 – 2024 (US$ Bn)
10.7.3.Res of North America, 2014 – 2024 (US$ Bn)
10.8.Market Attractiveness Analysis
10.8.1.By Country
10.8.2.By Solution
10.8.3.By Deployment
10.8.4.By Type
10.8.5.By End-use Application
11.Europe Enterprise Collaboration Services Market Analysis and Forecast
11.1.Key Findings
11.2.Key Trends
11.3.Market Size (US$ Bn) Forecast By Solution, 2014 - 2024
11.3.1.Messaging, 2014 – 2024 (US$ Bn)
11.3.2.Video Conferencing, 2014 – 2024 (US$ Bn)
11.3.3.Contact Center, 2014 – 2024 (US$ Bn)
11.3.4.Mobility/Telephony, 2014 – 2024 (US$ Bn)
11.3.5.Collaborative Tools, 2014 – 2024 (US$ Bn)
11.3.5.1.Email
11.3.5.2.Application Sharing
11.3.5.3.Web Services
11.3.5.4.Search Services
11.3.5.5.Office Suite
11.3.5.6.Resource Management
11.3.5.7.Process Management
11.3.5.8.Business Intelligence
11.4.Market Size (US$ Bn) Forecast By Deployment, 2014 - 2024
11.4.1.On-Premise, 2014 – 2024 (US$ Bn)
11.4.2.Off-Premise, 2014 – 2024 (US$ Bn)
11.5.Market Size (US$ Bn) Forecast By Type 2014 - 2024
11.5.1.Hardware, 2014 – 2024 (US$ Bn)
11.5.2.Software, 2014 – 2024 (US$ Bn)
11.5.3.Services, 2014 – 2024 (US$ Bn)
11.5.3.1.Consulting
11.5.3.2.Integration
11.5.3.3.Maintenance
11.6.Market Size (US$ Bn) Forecast By End-use Application, 2014 - 2024
11.6.1.BFSI, 2014 – 2024 (US$ Bn)
11.6.2.Retail, 2014 – 2024 (US$ Bn)
11.6.3.Healthcare, 2014 – 2024 (US$ Bn)
11.6.4.Government, 2014 – 2024 (US$ Bn)
11.6.5.Information Technology, 2014 – 2024 (US$ Bn)
11.6.6.Media and Entertainment, 2014 – 2024 (US$ Bn)
11.6.7.Education, 2014 – 202 (US$ Bn)
11.6.8.Other (Transportation and Manufacturing), 2014 – 2024 (US$ Bn)
11.7.Market Size (US$ Bn) Forecast By Country
11.7.1.The U.K., 2014 – 2024 (US$ Bn)
11.7.2.France, 2014 – 2024 (US$ Bn)
11.7.3.Italy, 2014 – 2024 (US$ Bn)
11.7.4.Res of Europe, 2014 – 2024 (US$ Bn)
11.8.Market Attractiveness Analysis
11.8.1.By Country
11.8.2.By Solution
11.8.3.By Deployment
11.8.4.By Type
11.8.5.By End-use Application
12.Asia-Pacific Enterprise Collaboration Services Market Analysis and Forecast
12.1.Key Findings
12.2.Key Trends
12.3.Market Size (US$ Bn) Forecast By Solution, 2014 - 2024
12.3.1.Messaging, 2014 – 2024 (US$ Bn)
12.3.2.Video Conferencing, 2014 – 2024 (US$ Bn)
12.3.3.Contact Center, 2014 – 2024 (US$ Bn)
12.3.4.Mobility/Telephony, 2014 – 2024 (US$ Bn)
12.3.5.Collaborative Tools, 2014 – 2024 (US$ Bn)
12.3.5.1.Email
12.3.5.2.Application Sharing
12.3.5.3.Web Services
12.3.5.4.Search Services
12.3.5.5.Office Suite
12.3.5.6.Resource Management
12.3.5.7.Process Management
12.3.5.8.Business Intelligence
12.4.Market Size (US$ Bn) Forecast By Deployment, 2014 - 2024
12.4.1.On-Premise, 2014 – 2024 (US$ Bn)
12.4.2.Off-Premise, 2014 – 2024 (US$ Bn)
12.5.Market Size (US$ Bn) Forecast By Type 2014 - 2024
12.5.1.Hardware, 2014 – 2024 (US$ Bn)
12.5.2.Software, 2014 – 2024 (US$ Bn)
12.5.3.Services, 2014 – 2024 (US$ Bn)
12.5.3.1.Consulting
12.5.3.2.Integration
12.5.3.3.Maintenance
12.6.Market Size (US$ Bn) Forecast By End-use Application, 2014 - 2024
12.6.1.BFSI, 2014 – 2024 (US$ Bn)
12.6.2.Retail, 2014 – 2024 (US$ Bn)
12.6.3.Healthcare, 2014 – 2024 (US$ Bn)
12.6.4.Government, 2014 – 2024 (US$ Bn)
12.6.5.Information Technology, 2014 – 2024 (US$ Bn)
12.6.6.Media and Entertainment, 2014 – 2024 (US$ Bn)
12.6.7.Education, 2014 – 202 (US$ Bn)
12.6.8.Other (Transportation and Manufacturing), 2014 – 2024 (US$ Bn)
12.7.Market Size (US$ Bn) Forecast By Country
12.7.1.China, 2014 – 2024 (US$ Bn)
12.7.2.Japan, 2014 – 2024 (US$ Bn)
12.7.3.India, 2014 – 2024 (US$ Bn)
12.7.4.Australasia, 2014 – 2024 (US$ Bn)
12.7.5.Res of Asia-Pacific, 2014 – 2024 (US$ Bn)
12.8.Market Attractiveness Analysis
12.8.1.By Country
12.8.2.By Solution
12.8.3.By Deployment
12.8.4.By Type
12.8.5.By End-use Application
13.Middle-East and Africa Enterprise Collaboration Services Market Analysis and Forecast
13.1.Key Findings
13.2.Key Trends
13.3.Market Size (US$ Bn) Forecast By Solution, 2014 - 2024
13.3.1.Messaging, 2014 – 2024 (US$ Bn)
13.3.2.Video Conferencing, 2014 – 2024 (US$ Bn)
13.3.3.Contact Center, 2014 – 2024 (US$ Bn)
13.3.4.Mobility/Telephony, 2014 – 2024 (US$ Bn)
13.3.5.Collaborative Tools, 2014 – 2024 (US$ Bn)
13.3.5.1.Email
13.3.5.2.Application Sharing
13.3.5.3.Web Services
13.3.5.4.Search Services
13.3.5.5.Office Suite
13.3.5.6.Resource Management
13.3.5.7.Process Management
13.3.5.8.Business Intelligence
13.4.Market Size (US$ Bn) Forecast By Deployment, 2014 - 2024
13.4.1.On-Premise, 2014 – 2024 (US$ Bn)
13.4.2.Off-Premise, 2014 – 2024 (US$ Bn)
13.5.Market Size (US$ Bn) Forecast By Type 2014 - 2024
13.5.1.Hardware, 2014 – 2024 (US$ Bn)
13.5.2.Software, 2014 – 2024 (US$ Bn)
13.5.3.Services, 2014 – 2024 (US$ Bn)
13.5.3.1.Consulting
13.5.3.2.Integration
13.5.3.3.Maintenance
13.6.Market Size (US$ Bn) Forecast By End-use Application, 2014 - 2024
13.6.1.BFSI, 2014 – 2024 (US$ Bn)
13.6.2.Retail, 2014 – 2024 (US$ Bn)
13.6.3.Healthcare, 2014 – 2024 (US$ Bn)
13.6.4.Government, 2014 – 2024 (US$ Bn)
13.6.5.Information Technology, 2014 – 2024 (US$ Bn)
13.6.6.Media and Entertainment, 2014 – 2024 (US$ Bn)
13.6.7.Education, 2014 – 202 (US$ Bn)
13.6.8.Other (Transportation and Manufacturing), 2014 – 2024 (US$ Bn)
13.7.Market Size (US$ Bn) Forecast By Country
13.7.1.GCC, 2014 – 2024 (US$ Bn)
13.7.2.South Africa, 2014 – 2024 (US$ Bn)
13.7.3.Res of MEA, 2014 – 2024 (US$ Bn)
13.8.Market Attractiveness Analysis
13.8.1.By Country
13.8.2.By Solution
13.8.3.By Deployment
13.8.4.By Type
13.8.5.By End-use Application
14.South America Enterprise Collaboration Services Market Analysis and Forecast
14.1.Key Findings
14.2.Key Trends
14.3.Market Size (US$ Bn) Forecast By Solution, 2014 - 2024
14.3.1.Messaging, 2014 – 2024 (US$ Bn)
14.3.2.Video Conferencing, 2014 – 2024 (US$ Bn)
14.3.3.Contact Center, 2014 – 2024 (US$ Bn)
14.3.4.Mobility/Telephony, 2014 – 2024 (US$ Bn)
14.3.5.Collaborative Tools, 2014 – 2024 (US$ Bn)
14.3.5.1.Email
14.3.5.2.Application Sharing
14.3.5.3.Web Services
14.3.5.4.Search Services
14.3.5.5.Office Suite
14.3.5.6.Resource Management
14.3.5.7.Process Management
14.3.5.8.Business Intelligence
14.4.Market Size (US$ Bn) Forecast By Deployment, 2014 - 2024
14.4.1.On-Premise, 2014 – 2024 (US$ Bn)
14.4.2.Off-Premise, 2014 – 2024 (US$ Bn)
14.5.Market Size (US$ Bn) Forecast By Type 2014 - 2024
14.5.1.Hardware, 2014 – 2024 (US$ Bn)
14.5.2.Software, 2014 – 2024 (US$ Bn)
14.5.3.Services, 2014 – 2024 (US$ Bn)
14.5.3.1.Consulting
14.5.3.2.Integration
14.5.3.3.Maintenance
14.6.Market Size (US$ Bn) Forecast By End-use Application, 2014 - 2024
14.6.1.BFSI, 2014 – 2024 (US$ Bn)
14.6.2.Retail, 2014 – 2024 (US$ Bn)
14.6.3.Healthcare, 2014 – 2024 (US$ Bn)
14.6.4.Government, 2014 – 2024 (US$ Bn)
14.6.5.Information Technology, 2014 – 2024 (US$ Bn)
14.6.6.Media and Entertainment, 2014 – 2024 (US$ Bn)
14.6.7.Education, 2014 – 202 (US$ Bn)
14.6.8.Other (Transportation and Manufacturing), 2014 – 2024 (US$ Bn)
14.7.Market Size (US$ Bn) Forecast By Country
14.7.1.Brazil, 2014 – 2024 (US$ Bn)
14.7.2.Argentina, 2014 – 2024 (US$ Bn)
14.7.3.Res of South America, 2014 – 2024 (US$ Bn)
14.8.Market Attractiveness Analysis
14.8.1.By Country
14.8.2.By Solution
14.8.3.By Deployment
14.8.4.By Type
15.Competition Landscape
15.1.Market Player – Competition Matrix
15.2.Market Share Analysis By Company (2015)
15.3.Company Profiles (Details – Overview, Financials, SWOT Analysis, Strategy)
15.3.1.Cisco Systems, Inc.
15.3.1.1.Company Details (HQ, Foundation Year, Revenue, Employee Strength)
15.3.1.2.Company Description
15.3.1.3.SWOT Analysis
15.3.1.4.Strategic Overview
15.3.2.IBM Corporation
15.3.2.1.Company Details (HQ, Foundation Year, Revenue, Employee Strength)
15.3.2.2.Company Description
15.3.2.3.SWOT Analysis
15.3.2.4.Strategic Overview
15.3.3.Microsoft Corporation
15.3.3.1.Company Details (HQ, Foundation Year, Revenue, Employee Strength)
15.3.3.2.Company Description
15.3.3.3.SWOT Analysis
15.3.3.4.Strategic Overview
15.3.4.Alcatel-Lucent SA (Nokia Networks)
15.3.4.1.Company Details (HQ, Foundation Year, Revenue, Employee Strength)
15.3.4.2.Company Description
15.3.4.3.SWOT Analysis
15.3.4.4.Strategic Overview
15.3.5.Unify, Inc. (Atos SE)
15.3.5.1.Company Details (HQ, Foundation Year, Revenue, Employee Strength)
15.3.5.2.Company Description
15.3.5.3.SWOT Analysis
15.3.5.4.Strategic Overview
15.3.6.Hewlett-Packard Development Company, L.P.
15.3.6.1.Company Details (HQ, Foundation Year, Revenue, Employee Strength)
15.3.6.2.Company Description
15.3.6.3.SWOT Analysis
15.3.6.4.Strategic Overview
15.3.7.Mitel Networks Corporation
15.3.7.1.Company Details (HQ, Foundation Year, Revenue, Employee Strength)
15.3.7.2.Company Description
15.3.7.3.SWOT Analysis
15.3.7.4.Strategic Overview
15.3.8.Polycom, Inc.
15.3.8.1.Company Details (HQ, Foundation Year, Revenue, Employee Strength)
15.3.8.2.Company Description
15.3.8.3.SWOT Analysis
15.3.8.4.Strategic Overview
15.3.9.Fuze Inc.
15.3.9.1.Company Details (HQ, Foundation Year, Revenue, Employee Strength)
15.3.9.2.Company Description
15.3.9.3.SWOT Analysis
15.3.9.4.Strategic Overview
15.3.10.8x8, Inc.
15.3.10.1.Company Details (HQ, Foundation Year, Revenue, Employee Strength)
15.3.10.2.Company Description
15.3.10.3.SWOT Analysis
15.3.10.4.Strategic Overview
15.3.11.ShoreTel Inc.
15.3.11.1.Company Details (HQ, Foundation Year, Revenue, Employee Strength)
15.3.11.2.Company Description
15.3.11.3.SWOT Analysis
15.3.11.4.Strategic Overview
15.3.12.Cafex Communications Inc.
15.3.12.1.Company Details (HQ, Foundation Year, Revenue, Employee Strength)
15.3.12.2.Company Description
15.3.12.3.SWOT Analysis
15.3.12.4.Strategic Overview
15.3.13.Tropo, Inc.
15.3.13.1.Company Details (HQ, Foundation Year, Revenue, Employee Strength)
15.3.13.2.Company Description
15.3.13.3.SWOT Analysis
15.3.13.4.Strategic Overview
15.3.14.Vonage networks LLC
15.3.14.1.Company Details (HQ, Foundation Year, Revenue, Employee Strength)
15.3.14.2.Company Description
15.3.14.3.SWOT Analysis
15.3.14.4.Strategic Overview
15.3.15.Xura, Inc.
15.3.15.1.Company Details (HQ, Foundation Year, Revenue, Employee Strength)
15.3.15.2.Company Description
15.3.15.3.SWOT Analysis
15.3.15.4.Strategic Overview
15.3.16.Atlassian Corp PLC
15.3.16.1.Company Details (HQ, Foundation Year, Revenue, Employee Strength)
15.3.16.2.Company Description
15.3.16.3.SWOT Analysis
15.3.16.4.Strategic Overview
15.3.17.GENBAND, Inc.
15.3.17.1.Company Details (HQ, Foundation Year, Revenue, Employee Strength)
15.3.17.2.Company Description
15.3.17.3.SWOT Analysis
15.3.17.4.Strategic Overview
16.Key Takeaways
List of Tables
Table 1: Global Enterprise Collaboration Service Market Size (US$ Bn) Forecast, By Solution, 2014 – 2024
Table 2: Global Enterprise Collaboration Service Market Size (US$ Bn) Forecast, By Collaborative Tool, 2014 – 2024
Table 3: Global Enterprise Collaboration Service Market Size (US$ Bn) Forecast, By Deployment, 2014 – 2024
Table 4 Global Enterprise Collaboration Service Market Size (US$ Bn) Forecast, By Type, 2014 – 2024
Table 5: Global Enterprise Collaboration Service Market Size (US$ Bn) Forecast, By Service, 2014 – 2024
Table 6: Global Enterprise Collaboration Service Market Size (US$ Bn) Forecast, By End-Use Application, 2014 – 2024
Table 7: Global Enterprise Collaboration Service Market Size (US$ Bn) Forecast, By Region, 2014 – 2024
Table 8: North American Enterprise Collaboration Service Market Size (US$ Bn) Forecast, By Solution, 2014 – 2024
Table 9: North America Collaboration Service Market Size (US$ Bn) Forecast, By Collaborative Tool, 2014 – 2024
Table 10: North America Enterprise Collaboration Service Market Size (US$ Bn) Forecast, By Deployment, 2014 – 2024
Table 11: North America Enterprise Collaboration Service Market Size (US$ Bn) Forecast, By Type, 2014 – 2024
Table 12: North America Enterprise Collaboration Service Market Size (US$ Bn) Forecast, By Service, 2014 – 2024
Table 13: North America Enterprise Collaboration Service Market Size (US$ Bn) Forecast, By End-Use Application, 2014 – 2024
Table 14: North America Enterprise Collaboration Service Market Size (US$ Bn) Forecast, By Country, 2014 – 2024
Table 15: Europe Enterprise Collaboration Service Market Size (US$ Bn) Forecast, By Solution, 2014 – 2024
Table 16: Europe Collaboration Service Market Size (US$ Bn) Forecast, By Collaborative Tool, 2014 – 2024
Table 17: Europe Enterprise Collaboration Service Market Size (US$ Bn) Forecast, By Deployment, 2014 – 2024
Table 18: Europe Enterprise Collaboration Service Market Size (US$ Bn) Forecast, By Type, 2014 – 2024
Table 19: Europe Enterprise Collaboration Service Market Size (US$ Bn) Forecast, By Service, 2014 – 2024
Table 20: Europe Enterprise Collaboration Service Market Size (US$ Bn) Forecast, By End-Use Application, 2014 – 2024
Table 21: Europe Enterprise Collaboration Service Market Size (US$ Bn) Forecast, By Country, 2014 – 2024
Table 22: Asia Pacific Enterprise Collaboration Service Market Size (US$ Bn) Forecast, By Solution, 2014 – 2024
Table 23: Asia Pacific Collaboration Service Market Size (US$ Bn) Forecast, By Collaborative Tool, 2014 – 2024
Table 24: Asia Pacific Enterprise Collaboration Service Market Size (US$ Bn) Forecast, By Deployment, 2014 – 2024
Table 25: Asia Pacific Enterprise Collaboration Service Market Size (US$ Bn) Forecast, By Type, 2014 – 2024
Table 26: Asia Pacific Enterprise Collaboration Service Market Size (US$ Bn) Forecast, By Service, 2014 – 2024
Table 27: Asia Pacific Enterprise Collaboration Service Market Size (US$ Bn) Forecast, By End-Use Application, 2014 – 2024
Table 28: Asia Pacific Enterprise Collaboration Service Market Size (US$ Bn) Forecast, By Country, 2014 – 2024
Table 29: MEA Enterprise Collaboration Service Market Size (US$ Bn) Forecast, By Solution, 2014 – 2024
Table 30: MEA Collaboration Service Market Size (US$ Bn) Forecast, By Collaborative Tool, 2014 – 2024
Table 31: MEA Enterprise Collaboration Service Market Size (US$ Bn) Forecast, By Deployment, 2014 – 2024
Table 32: MEA Enterprise Collaboration Service Market Size (US$ Bn) Forecast, By Type, 2014 – 2024
Table 33: MEA Enterprise Collaboration Service Market Size (US$ Bn) Forecast, By Service, 2014 – 2024
Table 34: MEA Enterprise Collaboration Service Market Size (US$ Bn) Forecast, By End-Use Application, 2014 – 2024
Table 35: MEA Enterprise Collaboration Service Market Size (US$ Bn) Forecast, By Country, 2014 – 2024
Table 36: South America Enterprise Collaboration Service Market Size (US$ Bn) Forecast, By Solution, 2014 – 2024
Table 37: South America Collaboration Service Market Size (US$ Bn) Forecast, By Collaborative Tool, 2014 – 2024
Table 38: South America Enterprise Collaboration Service Market Size (US$ Bn) Forecast, By Deployment, 2014 – 2024
Table 39: South America Enterprise Collaboration Service Market Size (US$ Bn) Forecast, By Type, 2014 – 2024
Table 40: South America Enterprise Collaboration Service Market Size (US$ Bn) Forecast, By Service, 2014 – 2024
Table 41: South America Enterprise Collaboration Service Market Size (US$ Bn) Forecast, By End-Use Application, 2014 – 2024
Table 42: South America Enterprise Collaboration Service Market Size (US$ Bn) Forecast, By Country, 2014 – 2024
List of Figures
Figure 1: Global Enterprise Collaboration Service Market Value Share Analysis, by Solution, 2016 and 2024
Figure 2: Global Enterprise Collaboration Service Market Graph for Messaging Solution
Figure 3: Global Enterprise Collaboration Service Market Graph for Video Conferencing Solution
Figure 4: Global Enterprise Collaboration Service Market Graph for Contact Center Solution
Figure 5: Global Enterprise Collaboration Service Market Graph for Mobility/Telephony Solution
Figure 6: Global Enterprise Collaboration Service Market Graph for Collaborative Tools
Figure 7: Solution Comparison Matrix
Figure 8: Enterprise Collaboration Service Market Attractiveness Analysis, By Solution
Figure 9: Global Enterprise Collaboration Service Market Value Share Analysis, By Deployment, 2016 and 2024
Figure 10: Global Enterprise Collaboration Service Market Graph for On Premise Deployment
Figure 11: Global Enterprise Collaboration Service Market Graph for Off Premise Deployment
Figure 12: Global Enterprise Collaboration Service Market Graph for Hybrid Deployment
Figure 13: Deployment Comparison Matrix
Figure 14: Enterprise Collaboration Service Market Attractiveness Analysis, By Deployment
Figure 15: Global Enterprise Collaboration Service Market Value Share Analysis, By Type, 2016 and 2024
Figure 16: Global Enterprise Collaboration Service Market Graph for Hardware
Figure 17: Global Enterprise Collaboration Service Market Graph for Software
Figure 18: Global Enterprise Collaboration Service Market Graph for Service
Figure 19: Type Comparison Matrix
Figure 20: Global Enterprise Collaboration Service Market Attractiveness Analysis, By Type
Figure 21: Global Enterprise Collaboration Service Market Value Share Analysis, By End-Use Application, 2016 and 2024
Figure 22: Global Enterprise Collaboration Service Market Graph for BFSI
Figure 23: Global Enterprise Collaboration Service Market Graph for Retail
Figure 24: Global Enterprise Collaboration Service Market Graph for IT
Figure 25: Global Enterprise Collaboration Service Market Graph for M & E
Figure 26: Global Enterprise Collaboration Service Market Graph for Government
Figure 27: Global Enterprise Collaboration Service Market Graph for Healthcare
Figure 28: Global Enterprise Collaboration Service Market Graph for Education
Figure 29: Global Enterprise Collaboration Service Market Graph for Others
Figure 30: End-use Application Comparison Matrix
Figure 31: Enterprise Collaboration Service Market Attractiveness Analysis, By End-Use Application
Figure 33: Enterprise Collaboration Service Market Attractiveness Analysis, By Region
Figure 34: North America Enterprise Collaboration Service Market Size (US$ Bn) Forecast, 2014 – 2024
Figure 35: North America Enterprise Collaboration Service Market Size Y-o-Y Growth Projection, 2014 – 2024
Figure 36: North America Enterprise Collaboration Service Market Value Share Analysis, By Solution, 2016 and 2024
Figure 37: North America Enterprise Collaboration Service Market Value Share Analysis, By Deployment, 2016 and 2024
Figure 38: North American Enterprise Collaboration Service Market Value Share Analysis, By Type, 2016 and 2024
Figure 39: North America Enterprise Collaboration Service Market Value Share Analysis, By End-Use Application, 2016 and 2024
Figure 40: North America Enterprise Collaboration Service Market Value Share Analysis, By Country, 2016 And 2024
Figure 41: North America Enterprise Collaboration Service Market Attractiveness Analysis, By Country
Figure 42: North America Enterprise Collaboration Service Market Attractiveness Analysis, By Solution
Figure 43: North America Enterprise Collaboration Service Market Attractiveness Analysis, By Deployment
Figure 44: North America Enterprise Collaboration Service Market Attractiveness Analysis, By Type
Figure 45: North America Enterprise Collaboration Service Market Attractiveness Analysis, By End-Use Application
Figure 46: Europe Enterprise Collaboration Service Market Size (US$ Bn) Forecast, 2014 – 2024
Figure 47: Europe Enterprise Collaboration Service Market Size Y-o-Y Growth Projection, 2014 – 2024
Figure 48: Europe Enterprise Collaboration Service Market Value Share Analysis, By Solution, 2016 and 2024
Figure 49: Europe Enterprise Collaboration Service Market Value Share Analysis, By Deployment, 2016 and 2024
Figure 50: Europe Enterprise Collaboration Service Market Value Share Analysis, By Type, 2016 and 2024
Figure 51: Europe Enterprise Collaboration Service Market Value Share Analysis, By End-Use Application, 2016 and 2024
Figure 52: Europe Enterprise Collaboration Service Market Value Share Analysis, By Country, 2016 And 2024
Figure 53: Europe Enterprise Collaboration Service Market Attractiveness Analysis, By Country
Figure 54: Europe Enterprise Collaboration Service Market Attractiveness Analysis, By Solution
Figure 55: Europe Enterprise Collaboration Service Market Attractiveness Analysis, By Deployment
Figure 56: Europe Enterprise Collaboration Service Market Attractiveness Analysis, By Type
Figure 57: Europe Enterprise Collaboration Service Market Attractiveness Analysis, By End-Use Application
Figure 58: Asia Pacific Enterprise Collaboration Service Market Size (US$ Bn) Forecast, 2014 – 2024
Figure 59: Asia Pacific Enterprise Collaboration Service Market Size Y-o-Y Growth Projection, 2014 – 2024
Figure 60: Asia Pacific Enterprise Collaboration Service Market Value Share Analysis, By Solution, 2016 and 2024
Figure 61: Asia Pacific Enterprise Collaboration Service Market Value Share Analysis, By Deployment, 2016 and 2024
Figure 62: Asia Pacific Enterprise Collaboration Service Market Value Share Analysis, By Type, 2016 and 2024
Figure 63: Asia Pacific Enterprise Collaboration Service Market Value Share Analysis, By End-Use Application, 2016 and 2024
Figure 64: Asia Pacific Enterprise Collaboration Service Market Value Share Analysis, By Country, 2016 And 2024
Figure 65: Asia Pacific Enterprise Collaboration Service Market Attractiveness Analysis, By Country
Figure 66: Asia Pacific Enterprise Collaboration Service Market Attractiveness Analysis, By Solution
Figure 67: Asia Pacific Enterprise Collaboration Service Market Attractiveness Analysis, By Deployment
Figure 68: Asia Pacific Enterprise Collaboration Service Market Attractiveness Analysis, By Type
Figure 69: Asia Pacific Enterprise Collaboration Service Market Attractiveness Analysis, By End-Use Application
Figure 70: MEA Enterprise Collaboration Service Market Size (US$ Bn) Forecast, 2014 – 2024
Figure 71: MEA Enterprise Collaboration Service Market Size Y-o-Y Growth Projection, 2014 – 2024
Figure 72: MEA Enterprise Collaboration Service Market Value Share Analysis, By Solution, 2016 and 2024
Figure 73: MEA Enterprise Collaboration Service Market Value Share Analysis, By Deployment, 2016 and 2024
Figure 74: MEA Enterprise Collaboration Service Market Value Share Analysis, By Type, 2016 and 2024
Figure 75: MEA Enterprise Collaboration Service Market Value Share Analysis, By End-Use Application, 2016 and 2024
Figure 76: MEA Enterprise Collaboration Service Market Value Share Analysis, By Country, 2016 And 2024
Figure 77: MEA Enterprise Collaboration Service Market Attractiveness Analysis, By Country
Figure 78: MEA Enterprise Collaboration Service Market Attractiveness Analysis, By Solution
Figure 79: MEA Enterprise Collaboration Service Market Attractiveness Analysis, By Deployment
Figure 80: MEA Enterprise Collaboration Service Market Attractiveness Analysis, By Type
Figure 81: MEA Enterprise Collaboration Service Market Attractiveness Analysis, By End-Use Application
Figure 82: South America Enterprise Collaboration Service Market Size (US$ Bn) Forecast, 2014 – 2024
Figure 83: South America Enterprise Collaboration Service Market Size Y-o-Y Growth Projection, 2014 – 2024
Figure 84: South America Enterprise Collaboration Service Market Value Share Analysis, By Solution, 2016 and 2024
Figure 85: South America Enterprise Collaboration Service Market Value Share Analysis, By Deployment, 2016 and 2024
Figure 86: South America Enterprise Collaboration Service Market Value Share Analysis, By Type, 2016 and 2024
Figure 87: South America Enterprise Collaboration Service Market Value Share Analysis, By End-Use Application, 2016 and 2024
Figure 88: South America Enterprise Collaboration Service Market Value Share Analysis, By Country, 2016 And 2024
Figure 89: South America Enterprise Collaboration Service Market Attractiveness Analysis, By Country
Figure 90: South America Enterprise Collaboration Service Market Attractiveness Analysis, By Solution
Figure 91: South America Enterprise Collaboration Service Market Attractiveness Analysis, By Deployment
Figure 92: South America Enterprise Collaboration Service Market Attractiveness Analysis, By Type
Figure 93: South America Enterprise Collaboration Service Market Attractiveness Analysis, By End-Use Application
Figure 94: Global Enterprise Collaboration Services Market Share Analysis (2015)
Copyright © Transparency Market Research, Inc. All Rights reserved
Trust Online

Enterprise Collaboration Service Market