
Computer peripherals cover all the computer input, output, and storage devices. They are most often used for personal and office work. Computer peripheral input devices include keyboards, mice, presenters’ pens, image scanners, and webcams, among others. Computer peripheral output devices primarily include printers, loudspeakers, and headphones. Further, computer peripheral storage devices comprise hard drives (HDD), sold state drives (SSD), compact discs, digital video discs (DVD), and USB flash drives. These are some of the major computer peripherals considered for the global computer peripheral market analysis.
Computer peripheral devices are evolving expeditiously. To meet changing consumer requirements and preferences, companies are investing in developing technologically advanced and ergonomic computer peripheral devices. Increase in disposable income, decrease in prices of consumer peripheral devices, rise in demand for external storage devices, and introduction of technologically advanced devices are primary factors driving the computer peripheral market globally. The market is anticipated to expand at a rapid pace during the forecast period. The storage computer peripherals segment is estimated to contribute significantly to revenue in the next few years. Technological advancement and efficiency benefits of SSD are anticipated to fuel the computer peripheral market growth globally. However, there are some factors that are hindering market growth. Rise in preference for mobile devices such as smartphones and tablets over desktop and laptops is expected to slow down the computer peripheral market in the near future.
The global computer peripheral market has been classified based on product, connectivity, and end-use, and region. In terms of product, the market has been segmented into input, output, and storage devices. The input devices segment has been further divided into keyboards, image scanners, webcams, and pointing devices. The output devices segment has been further categorized into printers, loudspeakers, and headphones. The storage devices segment has been further divided into HDD, SDD, CD/DVD, and USB flash drives. Based on connectivity, the global computer peripheral market has been classified into wired and wireless computer peripherals. In terms of end-use, the market has been categorised into residential and commercial. In terms of region, the market has been divided into North America, Europe, Asia Pacific, Middle East and Africa, and South America.
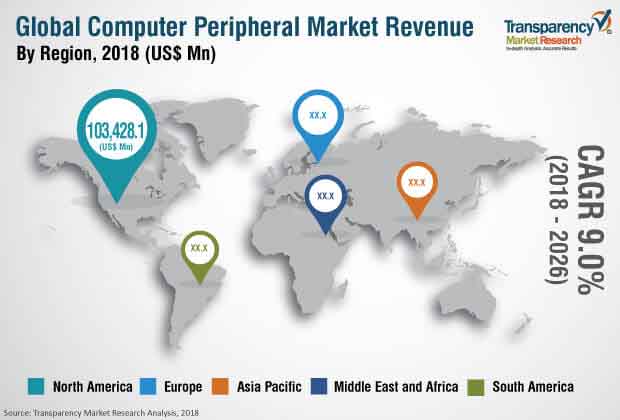
In 2017, demand for computer peripherals across commercial applications contributed significantly to revenue generation. The residential segment is likely to offer attractive market opportunities between 2018 and 2026 for players operating in the global market. Moreover, in 2017, North America was a prominent region of the computer peripherals market in terms of revenue and peripherals installed base. The adoption of computer peripherals across various industries in the region has been significant. Continuous demand for peripherals across countries such as Canada and the U.S. is projected to boost the market in the region.
The computer peripheral market is highly competitive, with major players witnessing strong competition across most of the segments covered under the scope of the market. In order to sustain in the competitive environment, market players offer low-cost computer peripheral products in price sensitive regions such as Asia Pacific and Middle East & Africa. (MEA). Increase in sales of companies such as Logitech International S.A, and Seiko Epson Corporation explains the winning strategy adopted by them in emerging regions. The market in Europe is expected to expand at a steady pace from 2018 to 2026.
Major players in the computer peripheral market include Apple, Inc., Canon Inc., Dell, Inc., Seiko Epson Corporation, Hewlett-Packard Enterprise, Hitachi, Ltd., IBM Corporation, Intel Corporation, Logitech International S.A., Microsoft Corporation, NEC Corporation, Ricoh Company, Samsung Electronics Co., Ltd., and Toshiba Corporation. Strategies adopted by leading, emerging, and prominent players in the market are uninterrupted focus on research and development, innovative and ergonomic product development, short product upgrade cycles, focus on developing and emerging economies, strategic mergers and acquisitions, multichannel retailing, horizontal integration, and innovations.
Computer peripherals cover all the computer storage, input, and output devices. They are regularly utilized for individual and office work. Computer peripheral info devices incorporate consoles, mouse, moderators' pens, picture scanners, and webcams, among others. Computer peripheral storage devices fundamentally incorporate printers, loudspeakers, and headphones. Further, computer peripheral stockpiling devices involve hard drives (HDD), sold state drives (SSD), conservative circles, computerized video plates (DVD), and USB streak drives. These are a portion of the significant computer peripherals considered for the worldwide computer peripheral market investigation.
Computer peripheral devices are developing quickly. To meet changing buyer necessities and preferences, organizations are putting resources into growing technologically progressed and ergonomic computer peripheral devices. Expansion in discretionary cash flow, decline in costs of purchaser peripheral devices, ascend popular for outer capacity devices, and presentation of technologically progressed devices are essential elements driving the computer peripheral market worldwide. The market is foreseen to grow at a fast movement during the conjecture time frame. The capacity computer peripherals fragment is assessed to contribute fundamentally to income in the following not many years. Mechanical headway and productivity advantages of SSD are foreseen to fuel the computer peripheral market development all around the world. In any case, there are a few factors that are frustrating market development. Ascend in inclination for mobile devices, for example, smartphones and tablets over work area and workstations is relied upon to hinder the computer peripheral market sooner rather than later.
There are five key regions of the global computer peripherals market. These regions are North America, Latin America, Europe, Asia Pacific, and the Middle East and Africa. Of these, the global market is expected to be dominated by the regional segment of North America. This growth of the regional market can be attributed to the presence of highly matured electronics and tech sector along with increasing presence tech companies in the region.
The market has been segmented as follows:
|
Connectivity |
|
|
Product |
|
|
End-use |
|
|
Geography |
|
1. Preface
1.1. Market Scope
1.2. Market Segmentation
1.3. Key Research Objectives
2. Assumptions and Research Methodology
2.1. Market Taxonomy - Segment Definitions
2.2. Research Methodology
2.2.1. List of Primary and Secondary Sources
2.3. Key Assumptions for Data Modelling
3. Executive Summary : Global Computer Peripheral Market
4. Market Overview
4.1. Introduction
4.2. Global Market – Macro Economic Factors Overview
4.2.1. World GDP Indicator
4.2.2. Global ICT Spending (US$ Mn & Million Units), 2012, 2018, 2026
4.2.3. Key Regional Socio-political-technological Developments and their Impact Considerations
4.3. Connectivity/Product Roadmap
4.4. Market Factor Analysis
4.4.1. Porter’s Five Forces Analysis
4.4.2. PESTEL Analysis
4.4.3. Value Chain Analysis
4.4.3.1. OEMs and After Market Suppliers
4.4.3.2. Major End-users
4.4.3.3. Market Channel Development
4.5. Market Dynamics (Growth Influencers)
4.5.1. Drivers
4.5.2. Restraints
4.5.3. Opportunities
4.5.4. Impact Analysis of Drivers & Restraints
4.6. Adoption Analysis of Fingerprint Recognition in Computer Peripherals Market
4.6.1. Mouse
4.6.2. Scanner (Fingerprint)
4.6.3. Keyboard
4.7. Adoption Analysis of Computer Peripheral Connectivity, by Solutions Type
4.7.1. NFC
4.7.2. Infrared
4.7.3. Bluetooth
4.7.4. Wi-Fi
4.8. Pricing Model Analysis
4.9. Competitive Scenario and Trends
4.9.1. Key Participants Market Presence (Intensity Map)
4.9.2. Competitor Market Footprint Matrix
4.9.3. Mergers & Acquisitions, Expansions
4.10. Global Computer Peripheral Market Analysis and Forecast
4.10.1. Market Revenue Analysis (Y-o-Y and CAGR analysis) (US$ Mn & Million Units)
4.10.1.1. Historic Growth Trends, 2012-2017
4.10.1.2. Forecast Trends, 2018-2026
4.11. Computer Peripheral Shipments (Million Units), 2016, 2018, 2020 and 2026
4.12. Market Opportunity Assessment – By Region (North America, Europe, Asia Pacific, Middle East & Africa, South America)
4.12.1. By Connectivity
4.12.2. By Product
4.12.3. By End-use
4.12.4. By Region/Country
4.13. Market Outlook
5. Global Computer Peripheral Market Analysis and Forecast, by Connectivity
5.1. Overview and Definitions
5.2. Key Segment Analysis
5.3. Computer Peripheral Market Size (US$ Mn & Million Units) Forecast, by Connectivity, 2016 - 2026
5.3.1. Wired
5.3.2. Wireless
6. Global Computer Peripheral Market Analysis, by Product
6.1. Overview and Definitions
6.2. Key Segment Analysis
6.3. Computer Peripheral Market Size (US$ Mn & Million Units) Forecast, by Product, 2016 - 2026
6.3.1. Input Devices
6.3.1.1. Keyboard
6.3.1.2. Image Scanner
6.3.1.3. Pointing Devices
6.3.1.3.1. Mouse
6.3.1.3.2. Pen
6.3.1.4. Webcam
6.3.2. Output Devices
6.3.2.1. Printer
6.3.2.2. Loudspeaker
6.3.2.3. Headphone
6.3.3. Storage Devices
6.3.3.1. Hard Drive/SSD
6.3.3.2. CD/DVD
6.3.3.3. USB Flash Drives
7. Global Computer Peripheral Market Analysis and Forecast, by End-use
7.1. Overview and Definitions
7.2. Key Segment Analysis
7.3. Computer Peripheral Market Size (US$ Mn & Million Units) Forecast, by End-use, 2016 - 2026
7.3.1. Residential
7.3.2. Commercial
8. Global Computer Peripheral Market Analysis and Forecast, by Region
8.1. Overview
8.2. Key Segment Analysis
8.3. Computer Peripheral Market Size (US$ Mn & Million Units) Forecast, by Region, 2016 - 2026
8.3.1. North America
8.3.2. Europe
8.3.3. Asia Pacific
8.3.4. Middle East & Africa (MEA)
8.3.5. South America
9. North America Computer Peripheral Market Analysis and Forecast
9.1. Key Findings
9.2. Market Dynamics Impact Analysis
9.3. Computer Peripheral Market Size (US$ Mn & Million Units) Forecast, by Connectivity, 2016 - 2026
9.3.1. Wired
9.3.2. Wireless
9.4. Computer Peripheral Market Size (US$ Mn & Million Units) Forecast, by Product, 2016 - 2026
9.4.1. Input Devices
9.4.1.1. Keyboard
9.4.1.2. Image Scanner
9.4.1.3. Pointing Devices
9.4.1.3.1. Mouse
9.4.1.3.2. Pen
9.4.1.4. Webcam
9.4.2. Output Devices
9.4.2.1. Printer
9.4.2.2. Loudspeaker
9.4.2.3. Headphone
9.4.3. Storage Devices
9.4.3.1. Hard Drive / SSD
9.4.3.2. CD/ DVD
9.4.3.3. USB Flash Drives
9.5. Computer Peripheral Market Size (US$ Mn & Million Units) Forecast, by End-use, 2016 - 2026
9.5.1. Residential
9.5.2. Commercial
9.6. Computer Peripheral Market Size (US$ Mn & Million Units) Forecast, by Country, 2016 - 2026
9.6.1. The U.S.
9.6.2. Canada
9.6.3. Rest of North America
10. Europe Computer Peripheral Market Analysis and Forecast
10.1. Key Findings
10.2. Market Dynamics Impact Analysis
10.3. Computer Peripheral Market Size (US$ Mn & Million Units) Forecast, by Connectivity, 2016 - 2026
10.3.1. Wired
10.3.2. Wireless
10.4. Computer Peripheral Market Size (US$ Mn & Million Units) Forecast, by Product, 2016 - 2026
10.4.1. Input Devices
10.4.1.1. Keyboard
10.4.1.2. Image Scanner
10.4.1.3. Pointing Devices
10.4.1.3.1. Mouse
10.4.1.3.2. Pen
10.4.1.4. Webcam
10.4.2. Output Devices
10.4.2.1. Printer
10.4.2.2. Loudspeaker
10.4.2.3. Headphone
10.4.3. Storage Devices
10.4.3.1. Hard Drive/SSD
10.4.3.2. CD/DVD
10.4.3.3. USB Flash Drives
10.5. Computer Peripheral Market Size (US$ Mn & Million Units) Forecast, by End-use, 2016 - 2026
10.5.1. Residential
10.5.2. Commercial
10.6. Computer Peripheral Market Size (US$ Mn & Million Units) Forecast, by Country, 2016 - 2026
10.6.1. Germany
10.6.2. U.K.
10.6.3. France
10.6.4. Rest of Europe
11. Asia Pacific Computer Peripheral Market Analysis and Forecast
11.1. Key Findings
11.2. Market Dynamics Impact Analysis
11.3. Computer Peripheral Market Size (US$ Mn & Million Units) Forecast, by Connectivity, 2016 - 2026
11.3.1. Wired
11.3.2. Wireless
11.4. Computer Peripheral Market Size (US$ Mn & Million Units) Forecast, by Product, 2016 - 2026
11.4.1. Input Devices
11.4.1.1. Keyboard
11.4.1.2. Image Scanner
11.4.1.3. Pointing Devices
11.4.1.3.1. Mouse
11.4.1.3.2. Pen
11.4.1.4. Webcam
11.4.2. Output Devices
11.4.2.1. Printer
11.4.2.2. Loudspeaker
11.4.2.3. Headphone
11.4.3. Storage Devices
11.4.3.1. Hard Drive / SSD
11.4.3.2. CD/ DVD
11.4.3.3. USB Flash Drives
11.5. Computer Peripheral Market Size (US$ Mn & Million Units) Forecast, by End-use, 2016 - 2026
11.5.1. Residential
11.5.2. Commercial
11.6. Computer Peripheral Market Size (US$ Mn & Million Units) Forecast, by Country, 2016 - 2026
11.6.1. China
11.6.2. India
11.6.3. Japan
11.6.4. Rest of Asia Pacific
12. Middle East & Africa (MEA) Computer Peripheral Market Analysis and Forecast
12.1. Key Findings
12.2. Market Dynamics Impact Analysis
12.3. Computer Peripheral Market Size (US$ Mn & Million Units) Forecast, by Connectivity, 2016 - 2026
12.3.1. Wired
12.3.2. Wireless
12.4. Computer Peripheral Market Size (US$ Mn & Million Units) Forecast, by Product, 2016 - 2026
12.4.1. Input Devices
12.4.1.1. Keyboard
12.4.1.2. Image Scanner
12.4.1.3. Pointing Devices
12.4.1.3.1. Mouse
12.4.1.3.2. Pen
12.4.1.4. Webcam
12.4.2. Output Devices
12.4.2.1. Printer
12.4.2.2. Loudspeaker
12.4.2.3. Headphone
12.4.3. Storage Devices
12.4.3.1. Hard Drive/SSD
12.4.3.2. CD/DVD
12.4.3.3. USB Flash Drives
12.5. Computer Peripheral Market Size (US$ Mn & Million Units) Forecast, by End-use, 2016 - 2026
12.5.1. Residential
12.5.2. Commercial
12.6. Computer Peripheral Market Size (US$ Mn & Million Units) Forecast, by Country, 2016 - 2026
12.6.1. GCC Countries
12.6.2. South Africa
12.6.3. Rest of Middle East & Africa
13. South America Computer Peripheral Market Analysis and Forecast
13.1. Key Findings
13.2. Market Dynamics Impact Analysis
13.3. Computer Peripheral Market Size (US$ Mn & Million Units) Forecast, by Connectivity, 2016 - 2026
13.3.1. Wired
13.3.2. Wireless
13.4. Computer Peripheral Market Size (US$ Mn & Million Units) Forecast, by Product, 2016 - 2026
13.4.1. Input Devices
13.4.1.1. Keyboard
13.4.1.2. Image Scanner
13.4.1.3. Pointing Devices
13.4.1.3.1. Mouse
13.4.1.3.2. Pen
13.4.1.4. Webcam
13.4.2. Output Devices
13.4.2.1. Printer
13.4.2.2. Loudspeaker
13.4.2.3. Headphone
13.4.3. Storage Devices
13.4.3.1. Hard Drive / SSD
13.4.3.2. CD/ DVD
13.4.3.3. USB Flash Drives
13.5. Computer Peripheral Market Size (US$ Mn & Million Units) Forecast, by End-use, 2016 - 2026
13.5.1. Residential
13.5.2. Commercial
13.6. Computer Peripheral Market Size (US$ Mn & Million Units) Forecast, by Country, 2016 - 2026
13.6.1. Brazil
13.6.2. Rest of South America
14. Competition Landscape
14.1. Market Player – Competition Matrix
14.2. Market Revenue Share Assessment (%), by Company (2017)
14.3. Regional Presence (Intensity Map)
15. Company Profiles (Details – Business Overview, Sales Area/Geographical Presence, Revenue and Strategy)
15.1. Apple, Inc.
15.2. Canon Inc.
15.3. Dell, Inc.
15.4. Seiko Epson Corporation
15.5. Hewlett-Packard Enterprise
15.6. Hitachi, Ltd.
15.7. IBM Corporation
15.8. Intel Corporation
15.9. Logitech International S.A.
15.10. Microsoft Corporation
15.11. NEC Corporation
15.12. Ricoh Company
15.13. Samsung Electronics Co., Ltd.
15.14. Toshiba Corporation
16. Key Takeaways
List of Tables
Table 1: Competitor Market Footprint Matrix
Table 2: Overview of Acquisitions and Merger Transactions
Table 3: Computer Peripheral Installed Base (Million Units), 2016, 2018, 2020 and 2026
Table 4: Global Computer Peripheral Market Value (US$ Mn) Forecast, by Connectivity, 2016-2026
Table 5: Global Computer Peripheral Market Volume (Million Units) Forecast, by Connectivity, 2016-2026
Table 6: Global Computer Peripheral Market Value (US$ Mn) Forecast, by Product (Input Devices), 2016-2026
Table 7: Global Computer Peripheral Market Volume (Million Units) Forecast, by Product (Input Devices), 2016-2
Table 8: Global Computer Peripheral Market Value (US$ Mn) Forecast, by Product (Output Devices), 2016-2026
Table 9: Global Computer Peripheral Market Volume (Million Units) Forecast, by Product, 2016-2026
Table 10: Global Computer Peripheral Market Value (US$ Mn) Forecast, by End-Use, 2016-2026
Table 11: Global Computer Peripheral Market Volume (Million Units) Forecast, by End-Use, 2016-2026
Table 12: Global Computer Peripheral Market Value (US$ Mn) Forecast, by Region, 2016-2026
Table 13: Global Computer Peripheral Market Volume (Million Units) Forecast, by Region, 2016-2026
Table 14: North America Computer Peripheral Market Value (US$ Mn) Forecast, by Connectivity, 2016-2026
Table 15: North America Computer Peripheral Market Volume (Million Units) Forecast, by Connectivity, 2016-2026
Table 16: North America Computer Peripheral Market Value (US$ Mn) Forecast, by Product (Input Devices), 2016-20
Table 17: North America Computer Peripheral Market Volume (Million Units) Forecast, by Product (Input Devices)
List of Figures
Figure 1: Research Methodology Approach 1
Figure 2: Research Methodology Step 1
Figure 3: Research Methodology Step 2
Figure 4: Research Methodology Step 3
Figure 5: Research Methodology Step 4
Figure 6: Research Methodology Approach 2
Figure 7: Global Computer Peripheral Market Value (US$ Mn) and Fastest Growing Region, CAGR (%)
Figure 8: Global Computer Peripheral Market Value (US$ Mn) Forecast, 2016–2026
Figure 9: Global Computer Peripheral Market Dynamics
Figure 10: Global Computer Peripheral Market Value (Million Units) Forecast, 2016–2026
Figure 11: Global Revenue CAGR Breakdown
Figure 12: Global Revenue CAGR Breakdown
Figure 13: World GDP Indicator, 2017
Figure 14: Gross Domestic Product (GDP) per Capita; Analysis (US$ Tn), by Major Countries, 2011-2016
Figure 15: Gross Domestic Product (GDP) Analysis (US$ Tn), by Major Countries, 2011-2016
Figure 16: By End-use Vertical
Figure 17: By Biometric Technology
Figure 18: Adoption Analysis of Advanced Recognition Technology Enabled- Computer Peripherals, 2016, 2018, 2020 and 2026.
Figure 19: Connectivity Solution Adoption Analysis, 2016
Figure 20: Connectivity Solution Adoption Analysis, 2026
Figure 21: Price Trend Analysis (Average Price) : Product Type (US$), 2016, 2018 and 2026
Figure 22: Price Trend of Product Type, 2016 - 2026
Figure 23: Historic & Actual, Computer Peripheral Market, Revenue Y-O-Y (%) 2012 - 2017
Figure 24: Forecast, Computer Peripheral Market Revenue Y-O-Y (%) 2018 - 2026
Figure 25: Historic & Actual, Computer Peripheral Market Value (US$ Mn) Forecast, 2012–2017
Figure 26: Forecast, Computer Peripheral Market Value (US$ Mn) Forecast, 2018–2026
Figure 27: Historic & Actual, Computer Peripheral Market, Volume Y-O-Y (%) 2012 - 2017
Figure 28: Forecast, Computer Peripheral Market Volume Y-O-Y (%) 2018 - 2026
Figure 29: Historic & Actual, Computer Peripheral Market Size (Million Units), 2012–2017
Figure 30: Forecast, Computer Peripheral Market Size (Million Units) Forecast, 2018–2026
Figure 31: North America Computer Peripheral Market Attractiveness Analysis, by Connectivity, (2018)
Figure 32: North America Computer Peripheral Market Attractiveness Analysis, by End-use, (2018)
Figure 33: North America Computer Peripheral Market Attractiveness Analysis, by Country, (2018)
Figure 34: rth America Computer Peripheral Market Attractiveness Analysis, by Product, (2018)
Figure 35: Europe Computer Peripheral Market Attractiveness Analysis, by Connectivity, (2018)
Figure 36: Europe Computer Peripheral Market Attractiveness Analysis, by End-use, (2018)
Figure 37: Europe Computer Peripheral Market Attractiveness Analysis, by Country, (2018)
Figure 38: Europe Computer Peripheral Market Attractiveness Analysis, by Product, (2018)
Figure 39: Asia Pacific Computer Peripheral Market Attractiveness Analysis, by Connectivity, (2018)
Figure 40: Asia Pacific Computer Peripheral Market Attractiveness Analysis, by End-use, (2018)
Figure 41: Asia Pacific Computer Peripheral Market Attractiveness Analysis, by Country, (2018)
Figure 42: Asia Pacific Computer Peripheral Market Attractiveness Analysis, by Product, (2018)
Figure 43: MEA Computer Peripheral Market Attractiveness Analysis, by Connectivity, (2018)
Figure 44: MEA Computer Peripheral Market Attractiveness Analysis, by End-use, (2018)
Figure 45: MEA Computer Peripheral Market Attractiveness Analysis, by Country, (2018)
Figure 46: MEA Computer Peripheral Market Attractiveness Analysis, by Product, (2018)
Figure 47: South America Computer Peripheral Market Attractiveness Analysis, by Connectivity, (2018)
Figure 48: South America Computer Peripheral Market Attractiveness Analysis, by End-use, (2018)
Figure 49: uth America Computer Peripheral Market Attractiveness Analysis, by Country, (2018)
Figure 50: South America Computer Peripheral Market Attractiveness Analysis, by Product, (2018)
Figure 51: Global Computer Peripheral Market Value Share (Value %) by Connectivity, 2016
Figure 52: Global Computer Peripheral Market Value Share (Value %), by Product, 2016
Figure 53: Global Computer Peripheral Market Value Share (Value %), by Region, 2016
Figure 54: Global Computer Peripheral Market Volume Share (Value %), by Connectivity, 2016
Figure 55: Global Computer Peripheral Market Volume Share (Value %), by Product, 2016
Figure 56: Global Computer Peripheral Market Volume Share (Value %) , by Region, 2016
Figure 57: mputer Peripheral Market Dynamics Impact Analysis
Figure 58: Computer Peripheral Market Dynamics Impact Analysis
Figure 59: Computer Peripheral Market Dynamics Impact Analysis
Figure 60: Computer Peripheral Market Dynamics Impact Analysis
Figure 61: Computer Peripheral Market Dynamics Impact Analysis
Figure 62: Competition Matrix, Computer Peripheral Market - 2017
Figure 63: Apple, Inc. Revenue (US$ Bn) & Y-o-Y Growth (%), 2015–2017
Figure 64: Apple, Inc. Breakdown of Net Sales, by Geography, 2017
Figure 65: Canon Inc. Revenue (US$ Bn) & Y-o-Y Growth (%), 2015–2017
Figure 66: Canon Inc. Breakdown of Net Sales, by Geography, 2017
Figure 67: Dell, Inc. Revenue (US$ Bn) & Y-o-Y Growth (%), 2015–2017
Figure 68: Dell, Inc. Breakdown of Net Sales, by Geography, 2017
Figure 69: Seiko Epson Corporation Revenue (US$ Bn) & Y-o-Y Growth (%), 2015–2017
Figure 70: Seiko Epson Corporation Breakdown of Net Sales, by Geography, 2017
Figure 71: Hewlett-Packard Enterprise Revenue (US$ Bn) & Y-o-Y Growth (%), 2015–2017
Figure 72: Hewlett-Packard Enterprise Breakdown of Net Sales, by Geography, 2017
Figure 73: Hitachi, Ltd. Revenue (US$ Bn) & Y-o-Y Growth (%), 2015–2017
Figure 74: Hitachi, Ltd. Breakdown of Net Sales, by Geography, 2017
Figure 75: IBM Corporation Revenue (US$ Bn) & Y-o-Y Growth (%), 2015–2017
Figure 76: IBM Corporation Breakdown of Net Sales, by Geography, 2017
Figure 77: Intel Corporation Revenue (US$ Bn) & Y-o-Y Growth (%), 2015–2017
Figure 78: Intel Corporation Breakdown of Net Sales, by Geography, 2017
Figure 79: Logitech International S.A. Revenue (US$ Bn) & Y-o-Y Growth (%), 2015–2017
Figure 80: Logitech International S.A. Breakdown of Net Sales, by Geography, 2017
Figure 81: Microsoft Corporation Revenue (US$ Bn) & Y-o-Y Growth (%), 2015–2017
Figure 82: Microsoft Corporation Breakdown of Net Sales, by Geography, 2017
Figure 83: NEC Corporation Revenue (US$ Bn) & Y-o-Y Growth (%), 2015–2017
Figure 84: NEC Corporation Breakdown of Net Sales, by Geography, 2017
Figure 85: Ricoh Company Revenue (US$ Bn) & Y-o-Y Growth (%), 2015–2017
Figure 86: Ricoh Company Breakdown of Net Sales, by Geography, 2017
Figure 87: Samsung Electronics Co., Ltd. Revenue (US$ Bn) & Y-o-Y Growth (%), 2015–2017
Figure 88: Samsung Electronics Co., Ltd. Breakdown of Net Sales, by Geography, 2017
Figure 89: Toshiba Corporation Revenue (US$ Bn) & Y-o-Y Growth (%), 2015–2017
Figure 90: Toshiba Corporation Breakdown of Net Sales, by Geography, 2017
Copyright © Transparency Market Research, Inc. All Rights reserved
Trust Online


Computer Peripherals Market