
Reports
Reports
Analysts’ Viewpoint on Commercial Seaweed Market Scenario
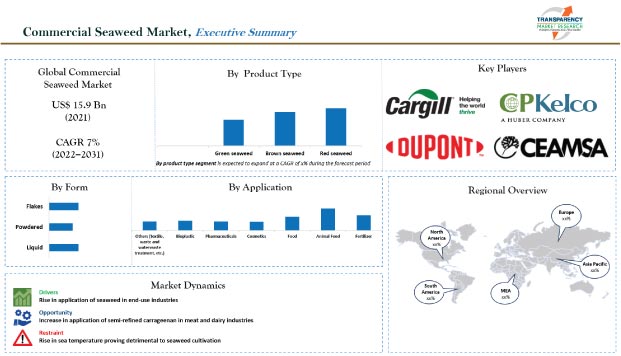
Commercial seaweed is a rich source of vitamins and minerals that can be found in various foods, cosmetics, and healthcare products. Rise in demand for seaweed-based culinary items and growing popularity of seaweed extracts, such as carrageenan and agar, are driving the global commercial seaweed market. Increase in application of commercial seaweed in various end-use industries, such as pharmaceuticals, food & beverage, and cosmetics, is also estimated to propel the market. Asia Pacific is likely to be a rapidly growing market for commercial seaweed in the near future. China, South Korea, Japan, and Indonesia are among the leading growers of seaweed across the globe.
Commercial seaweed is a form of microalgae, which is either taken directly or used as a hydrocolloid in food. This seaweed is also used in fertilizers, pharmaceuticals, cosmetics, and personal care items, as it is a rich source of minerals and vitamins. Commercial seaweed offers numerous health benefits. It is used significantly in pharmaceutical and personal care industries due to the high mineral and folic acid content. Players in the commercial seaweed market are increasingly cultivating sustainable seaweeds to meet the rising demand across the globe.
Increase in demand for seaweed in the pharmaceutical industry can be ascribed to its higher nutrient content and relatively low calories. Farmed seaweeds are available in a variety of colors and shapes. High concentration of vitamins and minerals, such as folic acid and vitamin K, provides numerous health benefits such as improved cardiovascular and immune system performance. This is driving the demand for red and black seaweed across the globe. Alginate, carrageenan, and agar are the three major seaweed derivatives. These seaweeds are derived from hydrocolloids and have strong biochemical properties, which make them useful in the pharmaceutical industry. These hydrocolloids are commonly used as excipients in pill form. Increasing usage of alginate seaweed in the pharmaceutical industry – it is used as dressing for wounds and a way to encapsulate cells and medicine – is further driving the demand for commercial seaweeds across the globe.
Commercial seaweed is extensively used in the cosmetic industry to make essential oils, creams, face masks, shampoos, bath salts, and other skin care products due to the high concentration of bioactive components. Anti-oxidant properties of commercial seaweeds provide anti-inflammatory and anti-aging effects, making them more useful in skin care, skin treatment, and hair care products. Applications of seaweed in the food & beverage industry are rising, specifically for particle suspension, emulsification, protein stabilization, thickening, and stabilization, in various processed foods such as dairy products, chocolate milk, sour cream, ice cream, and salad dressings. This is driving the demand for commercial seaweed in the food & beverage industry. Seaweed food and seaweed drinks are also popular among health-conscious consumers. The usage of commercial seaweeds in vegan/vegetarian gelatin-based food and beverage products, particularly among vegans because of its rich content in vitamins, minerals, and antioxidants, is further propelling the global demand for commercial seaweed.
Based on product type, the global commercial seaweed market has been classified into red seaweed, brown seaweed, and green seaweed. The red seaweed segment is estimated to dominate the commercial seaweed market, as red seaweeds are a good source of hydrocolloids, agar, and kappa carrageenan, which are often used in food preparations. Apart from the food industry, red seaweeds are also used in various skincare and personal care products. Growth of the commercial seaweed market can be ascribed to the rising application of red seaweed in various end-use industries.
The powdered form of commercial seaweed is expected to dominate the market during the forecast period, as it is easy to use and can be stored for a longer time. The powered form is also widely used in the food industry. However, demand for liquid and flake forms of seaweed is expected to rise significantly during the forecasted period.
The commercial seaweed market in Asia Pacific is estimated to grow at a notable pace during the forecast period. This can be ascribed to the increase in demand for and plentiful seaweed production in countries such as China, South Korea, Japan, and Indonesia. Furthermore, rise in usage of commercial seaweeds, particularly in food, pharmaceuticals, personal care products, gels, and adhesives, is fueling the market in the region. Key players in Asia Pacific are focusing on efficient commercial seaweed farming methods to create growth opportunities.
The market in North America and Europe is also likely to grow considerably during the forecast period, due to the rise in demand for plant-based and vegan products in these regions. The commercial seaweed market in Middle East & Africa is in the nascent phase. It is likely to grow at a rapid pace during the forecast period.
Key companies operating in the global commercial seaweed market are focusing on increasing their production capacities to meet the rising demand across the globe. Expansion of product portfolios and mergers and acquisitions are the prominent strategies adopted by key players. Cargill Corporation, E.I. Du Pont de Nemours and Company, CP Kelco, CEAMSA, Acadian Seaplants Ltd, Gelymar SA, Seasol International Pvt. Ltd, Brandt Agricultural Products Ltd, The Cornish Seaweed Company, and Leili Group are the prominent entities operating in the market.
Each of these players has been profiled in the commercial seaweed market report based on parameters such as company overview, financial overview, business strategies, product portfolio, business segments, and recent developments.
|
Attribute |
Detail |
|
Market Size Value in 2021 |
US$ 15.9 Bn |
|
Market Forecast Value in 2031 |
US$ 31.1 Bn |
|
Growth Rate (CAGR) |
7.0% |
|
Forecast Period |
2022–2031 |
|
Historical Data Available for |
2017–2020 |
|
Quantitative Units |
US$ Bn for Value & Tons for Volume |
|
Market Analysis |
It includes cross-segment analysis at the global as well as regional level. Furthermore, the qualitative analysis includes drivers, restraints, opportunities, key trends, Porter’s Five Forces analysis, value chain analysis, and key trend analysis. |
|
Competition Landscape |
Market share analysis by the company (2021) Company profiles section includes an overview, product portfolio, sales footprint, key subsidiaries or distributors, strategy & recent developments, and key financials |
|
Format |
Electronic (PDF) + Excel |
|
Market Segmentation |
|
|
Regions Covered |
|
|
Countries Covered |
|
|
Companies Profiled |
|
|
Customization Scope |
Available upon request |
|
Pricing |
Available upon request |
The commercial seaweed market stood at US$ 15.9 Bn in 2021.
The market is estimated to grow at a CAGR of 7.0% during 2022-2031.
The market is likely to reach US$ 31.1 Bn by 2031.
High demand for commercial seaweed in food, cosmetic, and pharmaceutical industries.
The food segment accounted for the largest share of the commercial seaweed market in 2021.
Asia Pacific is likely to be a highly lucrative market in the next few years.
Key players in the commercial seaweed market include Cargill Corporation, E.I. Du Pont de Nemours and Company, CP Kelco, CEAMSA, Acadian Seaplants Ltd, Gelymar SA, Seasol International Pvt. Ltd, Brandt Agricultural Products Ltd, The Cornish Seaweed Company, and Leili Group.
1. Preface
1.1. Market Definition and Scope
1.2. Market Segmentation
1.3. Key Research Objectives
1.4. Research Highlights
2. Assumptions
3. Research Methodology
4. Executive Summary
5. Market Overview
5.1. Introduction
5.2. Market Dynamics
5.2.1. Drivers
5.2.2. Restraints
5.2.3. Opportunities
5.3. Key Trends Analysis
5.3.1. Demand Side Analysis
5.3.2. Supply Side Analysis
5.4. Regulations & Guidelines
5.5. Key Market Indicators
5.5.1. Overall Commercial Seaweed Market Overview
5.6. Raw Material Analysis
5.7. Porter’s Five Forces Analysis
5.8. Industry SWOT Analysis
5.9. Value Chain Analysis
5.10. Regulatory Framework
5.11. Covid-19 Impact Analysis
5.12. Global Commercial Seaweed Market Analysis and Forecast, 2017–2031
5.12.1. Market Value Projections (US$ Bn)
5.12.2. Market Volume Projections (Tons)
6. Global Commercial Seaweed Market Analysis and Forecast, by Product Type
6.1. Commercial Seaweed Market Size (US$ Bn and Tons) By Product Type, 2017–2031
6.1.1. Red seaweed
6.1.2. Brown seaweed
6.1.3. Green seaweed
6.2. Incremental Opportunity, by Product Type
7. Global Commercial Seaweed Market Analysis and Forecast, by Form
7.1. Commercial Seaweed Market Size (US$ Bn and Tons), by Form, 2017–2031
7.1.1. Liquid
7.1.2. Powdered
7.1.3. Flakes
7.2. Incremental Opportunity, by Form
8. Global Commercial Seaweed Market Analysis and Forecast, by Application
8.1. Commercial Seaweed Market Size (US$ Bn and Tons), by Application, 2017–2031
8.1.1. Fertilizer
8.1.2. Animal Feed
8.1.3. Food
8.1.4. Cosmetics
8.1.5. Pharmaceuticals
8.1.6. Bioplastic
8.1.7. Others (Textile, Waterwaste treatment, etc.)
8.2. Incremental Opportunity, by Region
9. Global Commercial Seaweed Market Analysis and Forecast, by Region
9.1. Commercial Seaweed Market Size (US$ Bn and Tons), by Region, 2017–2031
9.1.1. North America
9.1.2. Europe
9.1.3. Asia Pacific
9.1.4. Middle East & Africa
9.1.5. Latin America
9.2. Incremental Opportunity, by Region
10. North America Commercial Seaweed Market Analysis and Forecast
10.1. Regional Snapshot
10.2. Key supplier analysis
10.3. Covid-19 Impact Analysis
10.4. Price Trend Analysis
10.4.1. Weighted Average Price
10.5. Key Trends Analysis
10.5.1. Demand Side
10.5.2. Supplier Side
10.6. Commercial Seaweed Market Size (US$ Bn and Tons), by Product Type, 2017–2031
10.6.1. Red seaweed
10.6.2. Brown seaweed
10.6.3. Green seaweed
10.7. Commercial Seaweed Market Size (US$ Bn and Tons), by Form, 2017–2031
10.7.1. Liquid
10.7.2. Powdered
10.7.3. Flakes
10.8. Commercial Seaweed Market Size (US$ Bn and Tons), by Application, 2017–2031
10.8.1. Fertilizer
10.8.2. Animal Feed
10.8.3. Food
10.8.4. Cosmetics
10.8.5. Pharmaceuticals
10.8.6. Bioplastic
10.8.7. Others (Textile, Waterwaste treatment, etc.)
10.9. Commercial Seaweed Market Size (US$ Bn and Tons), by Country, 2017–2031
10.9.1. U.S
10.9.2. Rest of North America
10.10. Incremental Opportunity Analysis
11. Europe Commercial Seaweed Market Analysis and Forecast
11.1. Regional Snapshot
11.2. Key supplier analysis
11.3. Price Trend Analysis
11.3.1. Weighted Average Price
11.4. Key Trends Analysis
11.4.1. Demand Side
11.4.2. Supplier Side
11.5. Commercial Seaweed Market Size (US$ Bn and Tons), by Product Type, 2017–2031
11.5.1. Red seaweed
11.5.2. Brown seaweed
11.5.3. Green seaweed
11.6. Commercial Seaweed Market Size (US$ Bn and Tons), by Form, 2017–2031
11.6.1. Liquid
11.6.2. Powdered
11.6.3. Flakes
11.7. Commercial Seaweed Market Size (US$ Bn and Tons), by Application, 2017–2031
11.7.1. Fertilizer
11.7.2. Animal Feed
11.7.3. Food
11.7.4. Cosmetics
11.7.5. Pharmaceuticals
11.7.6. Bioplastic
11.7.7. Others (Textile, Waterwaste treatment, etc.)
11.8. Commercial Seaweed Market Size (US$ Bn and Tons), by Country, 2017–2031
11.8.1. U.K
11.8.2. Germany
11.8.3. Spain
11.8.4. France
11.8.5. Rest of Europe
11.9. Incremental Opportunity Analysis
12. Asia Pacific Commercial Seaweed Market Analysis and Forecast
12.1. Regional Snapshot
12.2. Key supplier analysis
12.3. Price Trend Analysis
12.3.1. Weighted Average Price
12.4. Key Trends Analysis
12.4.1. Demand Side
12.4.2. Supplier Side
12.5. Commercial Seaweed Market Size (US$ Bn and Tons), by Product Type, 2017–2031
12.5.1. Red seaweed
12.5.2. Brown seaweed
12.5.3. Green seaweed
12.6. Commercial Seaweed Market Size (US$ Bn and Tons), by Form, 2017–2031
12.6.1. Liquid
12.6.2. Powdered
12.6.3. Flakes
12.7. Commercial Seaweed Market Size (US$ Bn and Tons), by Application, 2017–2031
12.7.1. Fertilizer
12.7.2. Animal Feed
12.7.3. Food
12.7.4. Cosmetics
12.7.5. Pharmaceuticals
12.7.6. Bioplastic
12.7.7. Others (Textile, Waterwaste treatment, etc.)
12.8. Commercial Seaweed Market Size (US$ Bn and Tons), by Country, 2017–2031
12.8.1. Japan
12.8.2. China
12.8.3. India
12.8.4. Rest of Asia Pacific
12.9. Incremental Opportunity Analysis
13. Middle East and Africa Commercial Seaweed Market Analysis and Forecast
13.1. Regional Snapshot
13.2. Key supplier analysis
13.3. Price Trend Analysis
13.3.1. Weighted Average Price
13.4. Key Trends Analysis
13.4.1. Demand Side
13.4.2. Supplier Side
13.5. Commercial Seaweed Market Size (US$ Bn and Tons), by Product Type, 2017–2031
13.5.1. Red seaweed
13.5.2. Brown seaweed
13.5.3. Green seaweed
13.6. Commercial Seaweed Market Size (US$ Bn and Tons), by Form, 2017–2031
13.6.1. Liquid
13.6.2. Powdered
13.6.3. Flakes
13.7. Commercial Seaweed Market Size (US$ Bn and Tons), by Application, 2017–2031
13.7.1. Fertilizer
13.7.2. Animal Feed
13.7.3. Food
13.7.4. Cosmetics
13.7.5. Pharmaceuticals
13.7.6. Bioplastic
13.7.7. Others (Textile, Waterwaste treatment, etc.)
13.8. Commercial Seaweed Market Size (US$ Bn and Tons), by Country, 2017–2031
13.8.1. UAE
13.8.2. South Africa
13.8.3. Rest of MEA
13.9. Incremental Opportunity Analysis
14. Latin America Commercial Seaweed Market Analysis and Forecast
14.1. Regional Snapshot
14.2. Key supplier analysis
14.3. Price Trend Analysis
14.3.1. Weighted Average Price
14.4. Key Trends Analysis
14.4.1. Demand Side
14.4.2. Supplier Side
14.5. Commercial Seaweed Market Size (US$ Bn and Tons), by Product Type, 2017–2031
14.5.1. Red seaweed
14.5.2. Brown seaweed
14.5.3. Green seaweed
14.6. Commercial Seaweed Market Size (US$ Bn and Tons), by Form, 2017–2031
14.6.1. Liquid
14.6.2. Powdered
14.6.3. Flakes
14.7. Commercial Seaweed Market Size (US$ Bn and Tons), by Application, 2017–2031
14.7.1. Fertilizer
14.7.2. Animal Feed
14.7.3. Food
14.7.4. Cosmetics
14.7.5. Pharmaceuticals
14.7.6. Bioplastic
14.7.7. Others (Textile, Waste and Waterwaste treatment, etc.)
14.8. Commercial Seaweed Market Size (US$ Bn and Tons), by Country, 2017–2031
14.8.1. Chile
14.8.2. Brazil
14.8.3. Rest of Latin America
14.9. Incremental Opportunity Analysis
15. Competition Landscape
15.1. Market Player – Competition Dashboard
15.2. Market Share Analysis (%), by Company, (2021)
15.3. Company Profiles (Details – Company Overview, Sales Area/Geographical Presence, Revenue, Strategy & Business Overview
15.3.1. Cargill Corporation
15.3.1.1. Company Overview
15.3.1.2. Sales Area/Geographical Presence
15.3.1.3. Revenue
15.3.1.4. Strategy & Business Overview
15.3.2. E.I. Du Pont de Nemours and Company
15.3.2.1. Company Overview
15.3.2.2. Sales Area/Geographical Presence
15.3.2.3. Revenue
15.3.2.4. Strategy & Business Overview
15.3.3. CP Kelco
15.3.3.1. Company Overview
15.3.3.2. Sales Area/Geographical Presence
15.3.3.3. Revenue
15.3.3.4. Strategy & Business Overview
15.3.4. CEAMSA
15.3.4.1. Company Overview
15.3.4.2. Sales Area/Geographical Presence
15.3.4.3. Revenue
15.3.4.4. Strategy & Business Overview
15.3.5. Acadian Seaplants Ltd.
15.3.5.1. Company Overview
15.3.5.2. Sales Area/Geographical Presence
15.3.5.3. Revenue
15.3.5.4. Strategy & Business Overview
15.3.6. Gelymar SA
15.3.6.1. Company Overview
15.3.6.2. Sales Area/Geographical Presence
15.3.6.3. Revenue
15.3.6.4. Strategy & Business Overview
15.3.7. Seasol International Pvt. Ltd
15.3.7.1. Company Overview
15.3.7.2. Sales Area/Geographical Presence
15.3.7.3. Revenue
15.3.7.4. Strategy & Business Overview
15.3.8. Brandt Agricultural Products Ltd
15.3.8.1. Company Overview
15.3.8.2. Sales Area/Geographical Presence
15.3.8.3. Revenue
15.3.8.4. Strategy & Business Overview
15.3.9. The Cornish Seaweed Company
15.3.9.1. Company Overview
15.3.9.2. Sales Area/Geographical Presence
15.3.9.3. Revenue
15.3.9.4. Strategy & Business Overview
15.3.10. Leili Group
15.3.10.1. Company Overview
15.3.10.2. Sales Area/Geographical Presence
15.3.10.3. Revenue
15.3.10.4. Strategy & Business Overview
16. Key Takeaways
16.1. Identification of Potential Market Spaces
16.1.1. By Product Type
16.1.2. By Form
16.1.3. By region
16.2. Understanding the Buying Process of the Customers
16.3. Prevailing Market Risks
16.4. Preferred Sales & Marketing Strategy
List of Tables
Table 1: Global Commercial Seaweed Market, by Product Type, US$ Bn, 2017–2031
Table 2: Global Commercial Seaweed Market, by Product Type, Tons 2017–2031
Table 3: Global Commercial Seaweed Market, by Form, US$ Bn, 2017–2031
Table 4: Global Commercial Seaweed Market, by Form, Tons 2017–2031
Table 5: Global Commercial Seaweed Market, by Application, US$ Bn, 2017–2031
Table 6: Global Commercial Seaweed Market, by Application, Tons 2017–2031
Table 7: Global Commercial Seaweed Market, by Region, US$ Bn, 2017–2031
Table 8: Global Commercial Seaweed Market, by Region, Tons 2017–2031
Table 9: North America Commercial Seaweed Market, by Product Type, US$ Bn, 2017–2031
Table 10: North America Commercial Seaweed Market, by Product Type, Tons 2017–2031
Table 11: North America Commercial Seaweed Market, by Form, US$ Bn, 2017–2031
Table 12: North America Commercial Seaweed Market, by Form, Tons 2017–2031
Table 13: North America Commercial Seaweed Market, by Application, US$ Bn, 2017–2031
Table 14: North America Commercial Seaweed Market, by Application, Tons 2017–2031
Table 15: North America Commercial Seaweed Market, by Country, US$ Bn, 2017–2031
Table 16: North America Commercial Seaweed Market, by Country, Tons 2017–2031
Table 17: Europe Commercial Seaweed Market, by Product Type, US$ Bn, 2017–2031
Table 18: Europe Commercial Seaweed Market, by Product Type, Tons 2017–2031
Table 19: Europe Commercial Seaweed Market, by Form, US$ Bn, 2017–2031
Table 20: Europe Commercial Seaweed Market, by Form, Tons 2017–2031
Table 21: Europe Commercial Seaweed Market, by Application, US$ Bn, 2017–2031
Table 22: Europe Commercial Seaweed Market, by Application, Tons 2017–2031
Table 23: Europe Commercial Seaweed Market, by Country and Sub-region, US$ Bn, 2017–2031
Table 24: Europe Commercial Seaweed Market, by Country and Sub-region, Tons 2017–2031
Table 25: Asia Pacific Commercial Seaweed Market, by Product Type, US$ Bn, 2017–2031
Table 26: Asia Pacific Commercial Seaweed Market, by Product Type, Tons 2017–2031
Table 27: Asia Pacific Commercial Seaweed Market, by Form, US$ Bn, 2017–2031
Table 28: Asia Pacific Commercial Seaweed Market, by Form, Tons 2017–2031
Table 29: Asia Pacific Commercial Seaweed Market, by Application, US$ Bn, 2017–2031
Table 30: Asia Pacific Commercial Seaweed Market, by Application, Tons 2017–2031
Table 31: Asia Pacific Commercial Seaweed Market, by Country and Sub-region, US$ Bn, 2017–2031
Table 32: Asia Pacific Commercial Seaweed Market, by Country and Sub-region, Tons 2017–2031
Table 33: Middle East & Africa Commercial Seaweed Market, by Product Type, US$ Bn, 2017–2031
Table 34: Middle East & Africa Commercial Seaweed Market, by Product Type, Tons 2017–2031
Table 35: Middle East & Africa Commercial Seaweed Market, by Form, US$ Bn, 2017–2031
Table 36: Middle East & Africa Commercial Seaweed Market, by Form, Tons 2017–2031
Table 37: Middle East & Africa Commercial Seaweed Market, by Application, US$ Bn, 2017–2031
Table 38: Middle East & Africa Commercial Seaweed Market, by Application, Tons 2017–2031
Table 39: Middle East & Africa Commercial Seaweed Market, by Country and Sub-region, US$ Bn, 2017–2031
Table 40: Middle East & Africa Commercial Seaweed Market, by Country and Sub-region, Tons 2017–2031
Table 41: Latin America Commercial Seaweed Market, by Product Type, US$ Bn, 2017–2031
Table 42: Latin America Commercial Seaweed Market, by Product Type, Tons 2017–2031
Table 43: Latin America Commercial Seaweed Market, by Form, US$ Bn, 2017–2031
Table 44: Latin America Commercial Seaweed Market, by Form, Tons 2017–2031
Table 45: Latin America Commercial Seaweed Market, by Application, US$ Bn, 2017–2031
Table 46: Latin America Commercial Seaweed Market, by Application, Tons 2017–2031
Table 47: Latin America Commercial Seaweed Market, by Country and Sub-region, US$ Bn, 2017–2031
Table 48: Latin America Commercial Seaweed Market, by Country and Sub-region, Tons 2017–2031
List Of Figures
Figure 1: Global Commercial Seaweed Market, by Product Type, US$ Bn, 2017–2031
Figure 2: Global Commercial Seaweed Market, by Product Type, Tons 2017–2031
Figure 3: Global Commercial Seaweed Market by Product Type, Incremental Opportunity, 2022–2031
Figure 4: Global Commercial Seaweed Market, by Form, US$ Bn, 2017–2031
Figure 5: Global Commercial Seaweed Market, by Form, Tons 2017–2031
Figure 6: Global Commercial Seaweed Market by Form, Incremental Opportunity, 2022–2031
Figure 7: Global Commercial Seaweed Market, by Application, US$ Bn, 2017–2031
Figure 8: Global Commercial Seaweed Market, by Application, Tons 2017–2031
Figure 9: Global Commercial Seaweed Market by Application, Incremental Opportunity, 2022–2031
Figure 10: Global Commercial Seaweed Market, by Region, US$ Bn, 2017–2031
Figure 11: Global Commercial Seaweed Market, by Region, Tons 2017–2031
Figure 12: Global Commercial Seaweed Market by Region, Incremental Opportunity, 2022–2031
Figure 13: North America Commercial Seaweed Market, by Product Type, US$ Bn, 2017–2031
Figure 14: North America Commercial Seaweed Market, by Product Type, Tons 2017–2031
Figure 15: North America Commercial Seaweed Market by Product Type, Incremental Opportunity, 2022–2031
Figure 16: North America Commercial Seaweed Market, by Form, US$ Bn, 2017–2031
Figure 17: North America Commercial Seaweed Market, by Form, Tons 2017–2031
Figure 18: North America Commercial Seaweed Market by Form, Incremental Opportunity, 2022–2031
Figure 19: North America Commercial Seaweed Market, by Application, US$ Bn, 2017–2031
Figure 20: North America Commercial Seaweed Market, by Application, Tons 2017–2031
Figure 21: North America Commercial Seaweed Market by Application, Incremental Opportunity, 2022–2031
Figure 22: North America Commercial Seaweed Market, by Country, US$ Bn, 2017–2031
Figure 23: North America Commercial Seaweed Market, by Country, Tons 2017–2031
Figure 24: North America Commercial Seaweed Market by Country, Incremental Opportunity, 2022–2031
Figure 25: Europe Commercial Seaweed Market, by Product Type, US$ Bn, 2017–2031
Figure 26: Europe Commercial Seaweed Market, by Product Type, Tons 2017–2031
Figure 27: Europe Commercial Seaweed Market, by Product Type, Incremental Opportunity, 2022–2031
Figure 28: Europe Commercial Seaweed Market, by Form, US$ Bn, 2017–2031
Figure 29: Europe Commercial Seaweed Market, by Form, Tons 2017–2031
Figure 30: Europe Commercial Seaweed Market, by Form, Incremental Opportunity, 2022–2031
Figure 31: Europe Commercial Seaweed Market, by Application, US$ Bn, 2017–2031
Figure 32: Europe Commercial Seaweed Market, by Application, Tons 2017–2031
Figure 33: Europe Commercial Seaweed Market, by Application, Incremental Opportunity, 2022–2031
Figure 34: Europe Commercial Seaweed Market, by Country and Sub-region, US$ Bn, 2017–2031
Figure 35: Europe Commercial Seaweed Market, by Country and Sub-region, Tons 2017–2031
Figure 36: Europe Commercial Seaweed Market, by Country and Sub-region, Incremental Opportunity, 2022–2031
Figure 37: Asia Pacific Commercial Seaweed Market, by Product Type, US$ Bn, 2017–2031
Figure 38: Asia Pacific Commercial Seaweed Market, by Product Type, Tons 2017–2031
Figure 39: Asia Pacific Commercial Seaweed Market, by Product Type, Incremental Opportunity, 2022–2031
Figure 40: Asia Pacific Commercial Seaweed Market, by Form, US$ Bn, 2017–2031
Figure 41: Asia Pacific Commercial Seaweed Market, by Form, Tons 2017–2031
Figure 42: Asia Pacific Commercial Seaweed Market, by Form, Incremental Opportunity, 2022–2031
Figure 43: Asia Pacific Commercial Seaweed Market, by Application, US$ Bn, 2017–2031
Figure 44: Asia Pacific Commercial Seaweed Market, by Application, Tons 2017–2031
Figure 45: Asia Pacific Commercial Seaweed Market, by Application, Incremental Opportunity, 2022–2031
Figure 46: Asia Pacific Commercial Seaweed Market, by Country and Sub-region, US$ Bn, 2017–2031
Figure 47: Asia Pacific Commercial Seaweed Market, by Country and Sub-region, Tons 2017–2031
Figure 48: Asia Pacific Commercial Seaweed Market, by Country and Sub-region, Incremental Opportunity, 2022–2031
Figure 49: Middle East & Africa Commercial Seaweed Market, by Product Type, US$ Bn, 2017–2031
Figure 50: Middle East & Africa Commercial Seaweed Market, by Product Type, Tons 2017–2031
Figure 51: Middle East & Africa Commercial Seaweed Market by Product Type, Incremental Opportunity, 2022–2031
Figure 52: Middle East & Africa Commercial Seaweed Market, by Form, US$ Bn, 2017–2031
Figure 53: Middle East & Africa Commercial Seaweed Market, by Form, Tons 2017–2031
Figure 54: Middle East & Africa Commercial Seaweed Market by Form, Incremental Opportunity, 2022–2031
Figure 55: Middle East & Africa Commercial Seaweed Market, by Application, US$ Bn, 2017–2031
Figure 56: Middle East & Africa Commercial Seaweed Market, by Application, Tons 2017–2031
Figure 57: Middle East & Africa Commercial Seaweed Market by Application, Incremental Opportunity, 2022–2031
Figure 58: Middle East & Africa Commercial Seaweed Market, by Country and Sub-region, US$ Bn, 2017–2031
Figure 59: Middle East & Africa Commercial Seaweed Market, by Country and Sub-region, Tons 2017–2031
Figure 60: Middle East & Africa Commercial Seaweed Market by Country and Sub-region, Incremental Opportunity, 2022–2031
Figure 61: Latin America Commercial Seaweed Market, by Product Type, US$ Bn, 2017–2031
Figure 62: Latin America Commercial Seaweed Market, by Product Type, Tons 2017–2031
Figure 63: Latin America Commercial Seaweed Market by Product Type, Incremental Opportunity, 2022–2031
Figure 64: Latin America Commercial Seaweed Market, by Form, US$ Bn, 2017–2031
Figure 65: Latin America Commercial Seaweed Market, by Form, Tons 2017–2031
Figure 66: Latin America Commercial Seaweed Market by Form, Incremental Opportunity, 2022–2031
Figure 67: Latin America Commercial Seaweed Market, by Application, US$ Bn, 2017–2031
Figure 68: Latin America Commercial Seaweed Market, by Application, Tons 2017–2031
Figure 69: Latin America Commercial Seaweed Market by Application, Incremental Opportunity, 2022–2031
Figure 70: Latin America Commercial Seaweed Market, by Country and Sub-region, US$ Bn, 2017–2031
Figure 71: Latin America Commercial Seaweed Market, by Country and Sub-region, Tons 2017–2031
Figure 72: Latin America Commercial Seaweed Market by Country and Sub-region, Incremental Opportunity, 2022–2031
Copyright © Transparency Market Research, Inc. All Rights reserved
Trust Online

Commercial Seaweed Market