
Reports
Reports
Chemical Vapor Deposition Market: Snapshot
Chemical vapor deposition (CVD) is a widely used material processing technology. It is a process employed to produce high-performance and high-purity solid materials. The technique is appropriate for the manufacture of powders, coatings, monolithic components, and fibers. This technique is often utilized in thin film applications. CVD is used to obtain wear-resistant coatings, corrosion-resistant coatings, and heat-resistant coatings. It is also used for the production of high-purity powder and fabricating ceramic and metal matrix composite materials.
Rising demand for microelectronics and semiconductor devices has driven the CVD market and the market is expected to grow in near future. As, the microelectronics industry segment is anticipated to emerge as a prominent and rapidly expanding industry segment of the global CVD equipment market. In the microelectronics industry, CVD equipment are used for wafer processing in the semiconductor industry, and for coating applications in the LED (light emitting diodes) manufacturing process.
CVD Equipment Rising in Commercial Prominence due to Increasing Market Players
The chemical vapor deposition market has been segmented on the basis of category, application, and technology. Based on category, the market has been segmented into CVD equipment, CVD materials, and CVD services. CVD equipment accounted for a major segment of the CVD industry followed by CVD services, CVD materials. A number of CVD equipment manufacturers and distributors operate globally. Growth in end-use industries such as microelectronics and solar applications and coatings is estimated to drive the global market for CVD equipment.
Based on application, the market has been segmented into coatings, electronics, catalysis, and others. The coating segment is further split into optical coatings, protective coatings, and decorative coatings. Coating segment holds a major market share and is expected to expand in near future. Electronics application is split into microelectronics and optoelectronics. Based on technology, the market has been split into atomic layer CVD, laser induced CVD, organometallic CVD, plasma enhanced CVD, plasma assisted CVD, low pressure CVD, and others. The low-pressure CVD segment accounted for more than 25% of the global CVD market in 2016. Its share is estimated to increase by the end of the forecast period. Low pressure (LP) is used to decrease any unwanted gas phase reactions, and also increase the uniformity across the substrate.
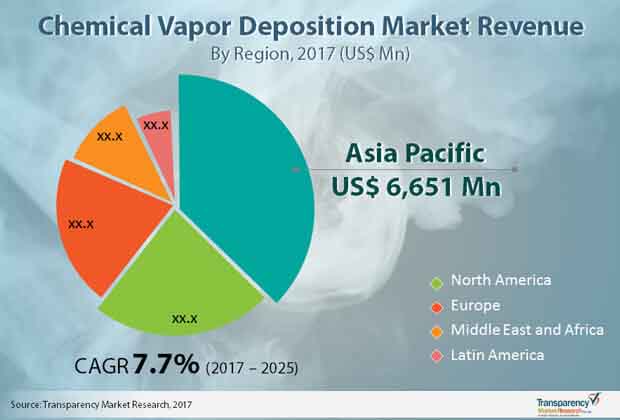
Rising Industrialization in India and China Drives Demand in Asia Pacific
Asia Pacific held the largest share of the global chemical vapor deposition market in 2016 and is likely to rise to a valuation of more than US$12 bn by 2025, exhibiting a steady 8.10% CAGR through the 2017-2025 forecast period. Growth of the CVD market in the region is primarily ascribed to the development of electronics and semiconductor industries, especially in China. Rising industrialization and increasing number of end-use industry players in emerging economies such as India and China offers several untapped opportunities. Asia Pacific accounted for more than 35% of the global chemical vapor deposition market in 2016. It is also projected to be the fastest growing market during the forecast period due to the presence of developing economies and expansion in electronics industries. Evolving countries in Asia Pacific are the key consumers and producers of chemical vapor deposition.
The market share of North America and Europe in the global chemical vapor deposition market is also estimated to increase during the forecast period. The chemical vapor deposition market is still developing in Latin America, the Middle East, and Africa. The manufacturing, pharmaceuticals, and renewable energy industries in developing economies in the Middle East and Africa have been expanding. The region is gradually shifting from an oil-based economy toward infrastructure, tourism, and renewable energy sectors, leading to rising demand from the chemical vapor deposition market.
Key players in the Chemical Vapor Deposition market include ULVAC Inc., IHI Corporation, Singulus Technologies AG, Veeco Instruments Inc., Tokyo Electron Limited, Mustang Vacuum Systems, Dynavac, and Oxford Instruments.
Technological Advancements in Equipment and Techniques Boost Chemical Vapor Deposition Market
Chemical vapor deposition (CVD) synthesis and techniques have made some remarkable advances. It evolution as a material processing technology for range of substrates offers several advantages over physical vapour deposition methods, hence the rapidly growing uptake. For one, the deposition rates can be tuned and CVD boasts of a splendid conformality, paving way to manufacturing of high-end materials for the electronics and semiconductor industries. The adoption of carbon nanotubes and graphene for next-gen electronics has expanded the canvas for players in the CVD market. A case in point is the use of CVD synthesis for high-performance flexible transparent electrodes. Emerging techniques of substrate pretreatment and advances made in post-growth processes have added vigor to the revenue generation in the market. The demand also benefits massively from the favorable regulations pertaining to the use of low-dimensional materials for electronics manufacturing. Advancements made in CVD instrumentation have also boosted the market prospects of CVD. Concomitant advances made in the chemistry of new materials have opened up the market to new areas of revenue streams. The adoption of better gas delivery system has tellingly benefitted and improved CVD synthesis. Advancements made in thermal CVD process have also boosted the demand in key application areas.
The Covid-19 pandemic since it hit the world in 2019 has metamorphosed into a full-blown global crisis, triggering worldwide responses to combat the fallouts. The humanitarian crisis affected the economies on multiple levels, including reshaping financial flow, firm productions, industry growth dynamics, and many more. Many businesses from across all industries were forced to integrate new operating and strategic business models to maintain their bottom line. The pandemic and its emerging waves have not only changed the operating models of various manufacturing industries, including chemical vapour production application areas, but also realigned the course of product development in some sectors. This paved way to new ICT and automation technologies that act as drivers for unlocking new consumer propositions in these end-use industries.
1. Preface
1.1. Report Scope and Market Segmentation
1.2. Research Highlights
2. Assumptions and Research Methodology
2.1. Assumptions and Acronyms Used
2.2. Research Methodology
3. Executive Summary
3.1. Market Size, Global Chemical Vapor Deposition Market (US$ Mn)
3.2. Key Trends
4. Market Overview
4.1. Product Overview
4.2. Key Market Developments
4.3. Market Indicators
4.4. Market Dynamics
4.4.1. Drivers
4.4.2. Restraints
4.4.3. Key Opportunities
4.5. Porter’s Analysis
4.5.1. Threat of Substitutes
4.5.2. Bargaining Power of Buyers
4.5.3. Bargaining Power of Suppliers
4.5.4. Threat of New Entrants
4.5.5. Degree of Competition
4.6. Value Chain Analysis
4.7. Regulatory Scenario
4.8. SWOT Analysis
5. Global Chemical Vapor Deposition Market– Supply Demand Scenario
6. Global Chemical Vapor Deposition Market Analysis, by Category
6.1. Introduction
6.2. Key Findings
6.3. Chemical Vapor Deposition Market Analysis, by Category
6.4. Chemical Vapor Deposition Market Attractiveness Analysis, by Category
6.5. Comparison Matrix by Category
7. Global Chemical Vapor Deposition Market Analysis by Technology
7.1. Introduction
7.2. Key Findings
7.3. Chemical Vapor Deposition Market Analysis, by Technology
7.4. Chemical Vapor Deposition Market Attractiveness Analysis, by Technology
7.5. Comparison Matrix by Technology
8. Global Chemical Vapor Deposition Market Analysis by Application
8.1. Introduction
8.2. Key Findings
8.3. Chemical Vapor Deposition Market Analysis, by Application
8.4. Chemical Vapor Deposition Market Attractiveness Analysis, by Application
8.5. Comparison Matrix by Application
9. Global Chemical Vapor Deposition Market Analysis and Forecasts, by Region
9.1. Global Chemical Vapor Deposition Market Scenario, by Region, 2016
9.2. Key Findings
9.3. Chemical Vapor Deposition Market Analysis, by Region
9.4. Chemical Vapor Deposition Market Attractiveness Analysis, by Region
10. North America Chemical Vapor Deposition Market Analysis
10.1. Key Findings
10.2. Chemical Vapor Deposition Market Value Share Analysis, by Category
10.3. Chemical Vapor Deposition Market Value Share Analysis, by Technology
10.4. Chemical Vapor Deposition Market Value Share Analysis, by Application
10.5. Chemical Vapor Deposition Market Value Share Analysis, by Country
10.6. North America Market Forecast, by Country, 2016- 2025
10.6.1. U.S.
10.6.2. Canada
10.7. Chemical Vapor Deposition Market, Comparison Matrix by Category
10.8. Chemical Vapor Deposition Market, Comparison Matrix by Technology
10.9. Chemical Vapor Deposition Market, Comparison Matrix by Application
10.10. PEST Analysis
11. Europe Chemical Vapor Deposition Market Analysis
11.1. Key Findings
11.2. Chemical Vapor Deposition Market Value Share Analysis, by Category
11.3. Chemical Vapor Deposition Market Value Share Analysis, by Technology
11.4. Chemical Vapor Deposition Market Value Share Analysis, by Application
11.5. Chemical Vapor Deposition Market Value Share Analysis, by Country
11.6. Europe Market Forecast, by Country, 2016- 2025
11.6.1. Germany
11.6.2. France
11.6.3. U.K.
11.6.4. Italy
11.6.5. Spain
11.6.6. Rest of Europe
11.7. Chemical Vapor Deposition Market, Comparison Matrix by Category
11.8. Chemical Vapor Deposition Market, Comparison Matrix by Technology
11.9. Chemical Vapor Deposition Market, Comparison Matrix by Application
11.10. PEST Analysis
12. Asia-Pacific Chemical Vapor Deposition Market Analysis
12.1. Key Findings
12.2. Chemical Vapor Deposition Market Value Share Analysis, by Category
12.3. Chemical Vapor Deposition Market Value Share Analysis, by Technology
12.4. Chemical Vapor Deposition Market Value Share Analysis, by Application
12.5. Chemical Vapor Deposition Market Value Share Analysis, by Country
12.6. Asia-Pacific Market Forecast, by Country, 2016- 2025
12.6.1. China
12.6.2. India
12.6.3. Japan
12.6.4. ASEAN
12.6.5. Rest of Asia Pacific
12.7. Chemical Vapor Deposition Market, Comparison Matrix by Category
12.8. Chemical Vapor Deposition Market, Comparison Matrix by Technology
12.9. Chemical Vapor Deposition Market, Comparison Matrix by Application
12.10. PEST Analysis
13. Latin America Chemical Vapor Deposition Market Analysis
13.1. Key Findings
13.2. Chemical Vapor Deposition Market Value Share Analysis, by Category
13.3. Chemical Vapor Deposition Market Value Share Analysis, by Technology
13.4. Chemical Vapor Deposition Market Value Share Analysis, by Application
13.5. Chemical Vapor Deposition Market Value Share Analysis, by Country
13.6. Latin America Market Forecast, by Country, 2016- 2025
13.6.1. Brazil
13.6.2. Mexico
13.6.3. Rest of Latin America
13.7. Chemical Vapor Deposition Market, Comparison Matrix by Category
13.8. Chemical Vapor Deposition Market, Comparison Matrix by Technology
13.9. Chemical Vapor Deposition Market, Comparison Matrix by Application
13.10. PEST Analysis
14. Middle East & Africa Chemical Vapor Deposition Market Analysis
14.1. Key Findings
14.2. Chemical Vapor Deposition Market Value Share Analysis, by Category
14.3. Chemical Vapor Deposition Market Value Share Analysis, by Technology
14.4. Chemical Vapor Deposition Market Value Share Analysis, by Application
14.5. Chemical Vapor Deposition Market Value Share Analysis, by Country
14.6. Middle East & Africa Market Forecast, by Country, 2016- 2025
14.6.1. GCC
14.6.2. Egypt
14.6.3. South Africa
14.6.4. Rest of Middle East & Africa
14.7. Chemical Vapor Deposition Market, Comparison Matrix by Category
14.8. Chemical Vapor Deposition Market, Comparison Matrix by Technology
14.9. Chemical Vapor Deposition Market, Comparison Matrix by Application
14.10. PEST Analysis
15. Competition Landscape
15.1. Competition Matrix
15.2. Chemical Vapor Deposition Market Share Analysis, by Company (2016)
15.3. Product Mapping
15.4. Company Profiles
15.4.1. ULVAC Inc.
15.4.1.1. Company Description
15.4.1.2. Business Overview
15.4.1.3. Overall Revenue
15.4.1.4. Strategic Overview
15.4.2. IHI Ionbond AG
15.4.2.1. Company Description
15.4.2.2. Business Overview
15.4.3. Mustang Vacuum Systems
15.4.3.1. Company Description
15.4.3.2. Business Overview
15.4.4. Plasma Therm
15.4.4.1. Company Description
15.4.4.2. Business Overview
15.4.5. Veeco Instruments Inc.
15.4.5.1. Company Description
15.4.5.2. Business Overview
15.4.5.3. Overall Revenue
15.4.5.4. Strategic Overview
15.4.6. Buhler AG
15.4.6.1. Company Description
15.4.6.2. Business Overview
15.4.6.3. Overall Revenue
15.4.6.4. Strategic Overview
15.4.7. SINGULUS TECHNOLOGIES
15.4.7.1. Company Description
15.4.7.2. Business Overview
15.4.7.3. Overall Revenue
15.4.7.4. Strategic Overview
15.4.8. Oxford Instruments
15.4.8.1. Company Description
15.4.8.2. Business Overview
15.4.8.3. Overall Revenue
15.4.8.4. Strategic Overview
15.4.9. Tokyo Electron Limited
15.4.9.1. Company Description
15.4.9.2. Business Overview
15.4.9.3. Overall Revenue
15.4.9.4. Strategic Overview
15.4.10. Oerlikon Balzers
15.4.10.1. Company Description
15.4.10.2. Business Overview
15.4.11. Praxair Surface Technologies
15.4.11.1. Company Description
15.4.11.2. Business Overview
15.4.12. Praxair Surface Technologies
15.4.12.1. Company Description
15.4.12.2. Business Overview
16. Primary Research
List of Tables
Table 01: Global Chemical Vapor Deposition Market Size (US$ Mn) Forecast, by Category, 2016–2025
Table 02: Global Chemical Vapor Deposition Market, Category Comparison Matrix
Table 03: Global Chemical Vapor Deposition Market Size (US$ Mn) Forecast, by Technology, 2016–2025
Table 04: Global Chemical Vapor Deposition Market, Technology Comparison Matrix
Table 05: Global Chemical Vapor Deposition Market Size (US$ Mn) Forecast, by Application , 2016–2025
Table 06: Global Chemical Vapor Deposition Market, Application Comparison Matrix
Table 07: Global Chemical Vapor Deposition Market Size (US$ Mn) and Forecast, by Region, 2016–2025
Table 08: North America Chemical Vapor Deposition Market Size (US$ Mn) Forecast, by Category, 2016–2025
Table 09: North America Chemical Vapor Deposition Value (US$ Mn) Forecast, by Technology, 2016–2025
Table 10: North America Chemical Vapor Deposition Value (US$ Mn) Forecast, by Application, 2016–2025
Table 11: North America Chemical Vapor Deposition Market Size (US$ Mn) and Forecast, by Country, 2016–2025
Table 12: U.S. Chemical Vapor Deposition Market Size (US$ Mn) Forecast, by Category, 2016–2025
Table 13: U.S. Chemical Vapor Deposition Value (US$ Mn) Forecast, by Technology, 2016–2025
Table 14: U.S. Chemical Vapor Deposition Value (US$ Mn) Forecast, by Application, 2016–2025
Table 15: Canada Chemical Vapor Deposition Market Size (US$ Mn) Forecast, by Category, 2016–2025
Table 16: Canada Chemical Vapor Deposition Value (US$ Mn) Forecast, by Technology, 2016–2025
Table 17: Canada Chemical Vapor Deposition Value (US$ Mn) Forecast, by Application, 2016–2025
Table 18: North America Chemical Vapor Deposition Market, Comparison Matrix, by Category
Table 19: North America Chemical Vapor Deposition Market, Comparison Matrix, by Technology
Table 20: North America Chemical Vapor Deposition Market, Comparison Matrix, by Application
Table 21: Europe Chemical Vapor Deposition Market Size (US$ Mn) Forecast, by Category, 2016–2025
Table 22: Europe Chemical Vapor Deposition Value (US$ Mn) Forecast, by Technology , 2016–2025
Table 23: Europe Chemical Vapor Deposition Value (US$ Mn) Forecast, by Application, 2016–2025
Table 24: Europe Chemical Vapor Deposition Market Size (US$ Mn) and Forecast, by Country & Sub-region, 2016–2025
Table 25: U.K. Chemical Vapor Deposition Market Size (US$ Mn) Forecast, by Category, 2016–2025
Table 26: U.K. Chemical Vapor Deposition Value (US$ Mn) Forecast, by Technology, 2016–2025
Table 27: U.K. Chemical Vapor Deposition Value (US$ Mn) Forecast, by Application, 2016–2025
Table 28: Germany Chemical Vapor Deposition Market Size (US$ Mn) Forecast, by Category, 2016–2025
Table 29:Germany Chemical Vapor Deposition Value (US$ Mn) Forecast, by Technology, 2016–2025
Table 30: Germany Chemical Vapor Deposition Value (US$ Mn) Forecast, by Application, 2016–2025
Table 31: France Chemical Vapor Deposition Market Size (US$ Mn) Forecast, by Category, 2016–2025
Table 32: France Chemical Vapor Deposition Value (US$ Mn) Forecast, by Technology, 2016–2025
Table 33: France Chemical Vapor Deposition Value (US$ Mn) Forecast, by Application, 2016–2025
Table 34: Italy Chemical Vapor Deposition Market Size (US$ Mn) Forecast, by Category, 2016–2025
Table 35: Italy Chemical Vapor Deposition Value (US$ Mn) Forecast, by Technology, 2016–2025
Table 36: Italy Chemical Vapor Deposition Value (US$ Mn) Forecast, by Application, 2016–2025
Table 37: Spain Chemical Vapor Deposition Market Size (US$ Mn) Forecast, by Category, 2016–2025
Table 38: Spain Chemical Vapor Deposition Value (US$ Mn) Forecast, by Technology, 2016–2025
Table 39: Spain Chemical Vapor Deposition Value (US$ Mn) Forecast, by Application, 2016–2025
Table 40: Rest of Europe Chemical Vapor Deposition Market Size (US$ Mn) Forecast, by Category, 2016–2025
Table 41: Rest of Europe Chemical Vapor Deposition Value (US$ Mn) Forecast, by Technology, 2016–2025
Table 42: Rest of Europe Chemical Vapor Deposition Value (US$ Mn) Forecast, by Application, 2016–2025
Table 43: Europe Chemical Vapor Deposition Market, Comparison Matrix by Category
Table 44: Europe Chemical Vapor Deposition Market, Comparison Matrix by Technology
Table 45: Europe Chemical Vapor Deposition Market, Comparison Matrix by Application
Table 46: Asia Pacific Chemical Vapor Deposition Market Size (US$ Mn) Forecast, by Category, 2016–2025
Table 47: Asia Pacific Chemical Vapor Deposition Value (US$ Mn) Forecast, by Technology, 2016–2025
Table 48: Asia Pacific Chemical Vapor Deposition Value (US$ Mn) Forecast, by Application, 2016–2025
Table 49: Asia Pacific Chemical Vapor Deposition Market Size (US$ Mn) and Forecast, by Country , 2016–2025
Table 50: China Chemical Vapor Deposition Market Size (US$ Mn) Forecast, by Category, 2016–2025
Table 51: China Chemical Vapor Deposition Value (US$ Mn) Forecast, by Technology, 2016–2025
Table 52: China Chemical Vapor Deposition Value (US$ Mn) Forecast, by Application, 2016–2025
Table 53: India Chemical Vapor Deposition Market Size (US$ Mn) Forecast, by Category, 2016–2025
Table 54: India Chemical Vapor Deposition Value (US$ Mn) Forecast, by Technology, 2016–2025
Table 55: India Chemical Vapor Deposition Value (US$ Mn) Forecast, by Application, 2016–2025
Table 56: Japan Chemical Vapor Deposition Market Size (US$ Mn) Forecast, by Category, 2016–2025
Table 57: Japan Chemical Vapor Deposition Value (US$ Mn) Forecast, by Technology, 2016–2025
Table 58: Japan Chemical Vapor Deposition Value (US$ Mn) Forecast, by Application, 2016–2025
Table 59: ASEAN Chemical Vapor Deposition Market Size (US$ Mn) Forecast, by Category, 2016–2025
Table 60: ASEAN Chemical Vapor Deposition Value (US$ Mn) Forecast, by Technology, 2016–2025
Table 61: ASEAN Chemical Vapor Deposition Value (US$ Mn) Forecast, by Application, 2016–2025
Table 62: Rest of Asia Pacific Chemical Vapor Deposition Market Size (US$ Mn) Forecast, by Category, 2016–2025
Table 63: Rest of Asia Pacific Chemical Vapor Deposition Value (US$ Mn) Forecast, by Technology, 2016–2025
Table 64: Rest of Asia Pacific Chemical Vapor Deposition Value (US$ Mn) Forecast, by Application, 2016–2025
Table 65: Asia Pacific Chemical Vapor Deposition Market, Comparison Matrix, by Category
Table 66: Asia Pacific Chemical Vapor Deposition Market, Comparison Matrix, by Technology
Table 66: Asia Pacific Chemical Vapor Deposition Market, Comparison Matrix, by Application
Table 67: Middle East & Africa Chemical Vapor Deposition Market Size (US$ Mn) Forecast, by Category, 2016–2025
Table 68: Middle East & Africa Chemical Vapor Deposition Value (US$ Mn) Forecast, by Technology, 2016–2025
Table 69: Middle East & Africa Chemical Vapor Deposition Value (US$ Mn) Forecast, by Application, 2016–2025
Table 70: Middle East & Africa Chemical Vapor Deposition Market Size (US$ Mn) and Forecast, by Country, 2016–2025
Table 71: GCC Chemical Vapor Deposition Market Size (US$ Mn) Forecast, by Category, 2016–2025
Table 72: GCC Chemical Vapor Deposition Value (US$ Mn) Forecast, by Technology, 2016–2025
Table 73: GCC Chemical Vapor Deposition Value (US$ Mn) Forecast, by Application, 2016–2025
Table 74: South Africa Chemical Vapor Deposition Market Size (US$ Mn) Forecast, by Category, 2016–2025
Table 75: South Africa Chemical Vapor Deposition Value (US$ Mn) Forecast, by Technology, 2016–2025
Table 76: South Africa Chemical Vapor Deposition Value (US$ Mn) Forecast, by Application, 2016–2025
Table 77: Rest of Middle East & Africa Chemical Vapor Deposition Market Size (US$ Mn) Forecast, by Category, 2016–2025
Table 78: Rest of Middle East & Africa Chemical Vapor Deposition Value (US$ Mn) Forecast, by Technology, 2016–2025
Table 79: Rest of Middle East & Africa Chemical Vapor Deposition Value (US$ Mn) Forecast, by Application, 2016–2025
Table 80: Middle East & Africa Chemical Vapor Deposition Market, Comparison Matrix, by Category
Table 81: Middle East & Africa Chemical Vapor Deposition Market, Comparison Matrix, by Technology
Table 82: Middle East & Africa Chemical Vapor Deposition Market, Comparison Matrix, by Application
Table 83: Latin America Chemical Vapor Deposition Market Size (US$ Mn) Forecast, by Category, 2016–2025
Table 84: Latin America Chemical Vapor Deposition Value (US$ Mn) Forecast, by Technology, 2016–2025
Table 85: Latin America Chemical Vapor Deposition Value (US$ Mn) Forecast, by Application, 2016–2025
Table 86: Latin America Chemical Vapor Deposition Market Size (US$ Mn) and Forecast, by Country, 2016–2025
Table 87: Brazil Chemical Vapor Deposition Market Size (US$ Mn) Forecast, by Category, 2016–2025
Table 88: Brazil Chemical Vapor Deposition Value (US$ Mn) Forecast, by Technology, 2016–2025
Table 89: Brazil Chemical Vapor Deposition Value (US$ Mn) Forecast, by Application, 2016–2025
Table 90: Mexico Chemical Vapor Deposition Market Size (US$ Mn) Forecast, by Category, 2016–2025
Table 91: Mexico Chemical Vapor Deposition Value (US$ Mn) Forecast, by Technology, 2016–2025
Table 92: Mexico Chemical Vapor Deposition Value (US$ Mn) Forecast, by Application, 2016–2025
Table 93: Rest of Latin America Chemical Vapor Deposition Market Size (US$ Mn) Forecast, by Category, 2016–2025
Table 94: Rest of Latin America Chemical Vapor Deposition Value (US$ Mn) Forecast, by Technology, 2016–2025
Table 95: Rest of Latin America Chemical Vapor Deposition Value (US$ Mn) Forecast, by Application, 2016–2025
Table 96: Latin America Chemical Vapor Deposition Market, Comparison Matrix, by Category
Table 97: Latin America Chemical Vapor Deposition Market, Comparison Matrix, by Technology
Table 98: Latin America Chemical Vapor Deposition Market, Comparison Matrix, by Application
Table 99: North America Chemical Vapor Deposition Equipment Value (US$ Mn) Forecast, by Application, 2016–2025
Table 100: Europe Chemical Vapor Deposition Equipment Value (US$ Mn) Forecast, by Application, 2016–2025
Table 101: Asia-Pacific Chemical Vapor Chemical Vapor Deposition Equipment Value (US$ Mn) Forecast, by Application, 2016–2025
Table 102: Latin America Chemical Vapor Deposition Equipment Value (US$ Mn) Forecast, by Application, 2016–2025
Table 103: Middle East & Africa Chemical Vapor Deposition Equipment Value (US$ Mn) Forecast, by Application, 2016–2025
List of Figures
Figure 01: Chemical Vapor Deposition Market Size, by Market Value (US$ Mn) Share and by Region, 2016
Figure 02: Regional Overview, 2016
Figure 03: Share Held by Top Two Categories of CVD, 2016–2025
Figure 04: Global Chemical Vapor Deposition Market Value Share Analysis, by Category, 2016 and 2025
Figure 05: Global Chemical Vapor Deposition Market Revenue (US$ Mn) Analysis, by CVD Equipment, 2016–2025
Figure 06: Global Chemical Vapor Deposition Market Revenue (US$ Mn) Analysis, by CVD Services, 2016–2025
Figure 07: Global Chemical Vapor Deposition Market Revenue (US$ Mn) Analysis, by CVD Materials, 2016–2025
Figure 08: Global Chemical Vapor Deposition Market Attractiveness Analysis, by Category
Figure 09: Global Chemical Vapor Deposition Market Value Share Analysis, by Technology, 2016 and 2025
Figure 10: Global Chemical Vapor Deposition Market Revenue (US$ Mn) Analysis, by Atomic Layer CVD, 2016–2025
Figure 11: Global Chemical Vapor Deposition Market Revenue (US$ Mn) Analysis, by Laser-induced CVD, 2016–2025
Figure 12: Global Chemical Vapor Deposition Market Revenue (US$ Mn) Analysis, by Organometallic CVD, 2016–2025
Figure 13: Global Chemical Vapor Deposition Market Revenue (US$ Mn) Analysis, by Plasma Enhanced CVD, 2016–2025
Figure 14: Global Chemical Vapor Deposition Market Revenue (US$ Mn) Analysis, by Plasma Assisted CVD, 2016–2025
Figure 15: Global Chemical Vapor Deposition Market Revenue (US$ Mn) Analysis, by Low Pressure CVD, 2016–2025
Figure 16: Global Chemical Vapor Deposition Market Revenue (US$ Mn) Analysis, by Others, 2016–2025
Figure 17: Global Chemical Vapor Deposition Market Attractiveness Analysis, by Technology
Figure 18: Global Chemical Vapor Deposition Market Value Share Analysis, by Application, 2016 and 2025
Figure 19: Global Chemical Vapor Deposition Market Revenue (US$ Mn) Analysis, by Coatings, 2016–2025
Figure 20: Global Chemical Vapor Deposition Market Revenue (US$ Mn) Analysis, by Electronics, 2016–2025
Figure 21: Global Chemical Vapor Deposition Market Revenue (US$ Mn) Analysis, by Catalysis, 2016–2025
Figure 22: Global Chemical Vapor Deposition Market Revenue (US$ Mn) Analysis, by Others, 2016–2025
Figure 23: Global Chemical Vapor Deposition Market Attractiveness Analysis, by Application
Figure 24: Global Chemical Vapor Deposition Market Value Share Analysis, by Region, 2016 and 2025
Figure 25: Global Chemical Vapor Deposition Market Attractiveness Analysis, by Region 2016–2025
Figure 26: North America Chemical Vapor Deposition Market Value Share Analysis, by Category, 2016 and 2025
Figure 27: North America Chemical Vapor Deposition Market Value Share Analysis, by Technology, 2016 and 2025
Figure 28: North America Chemical Vapor Deposition Market Value Share Analysis, by Application, 2016 and 2025
Figure 29: North America Chemical Vapor Deposition Market Value Share Analysis, by Country, 2016 and 2025
Figure 30: Europe Chemical Vapor Deposition Market Value Share Analysis, by Category, 2016 and 2025
Figure 31: Europe Chemical Vapor Deposition Market Value Share Analysis, by Technology, 2016 & 2025
Figure 32: Europe Chemical Vapor Deposition Market Value Share Analysis, by Application, 2016 and 2025
Figure 33: Europe Chemical Vapor Deposition Market Value Share Analysis, by Country & Sub-region, 2016 and 2025
Figure 34: Asia Pacific Chemical Vapor Deposition Market Value Share Analysis, by Category, 2016 and 2025
Figure 35: Asia Pacific Chemical Vapor Deposition Market Value Share Analysis, by Technology, 2016 and 2025
Figure 36: Asia Pacific Chemical Vapor Deposition Market Value Share Analysis, by Application, 2016 and 2025
Figure 37 : Asia Pacific Chemical Vapor Deposition Market Value Share Analysis, by Country, 2016 and 2025
Figure 38: Middle East & Africa Chemical Vapor Deposition Market Value Share Analysis, by Category, 2016 and 2025
Figure 39: Middle East & Africa Chemical Vapor Deposition Market Value Share Analysis, by Technology, 2016 and 2025
Figure 40: Middle East & Africa Chemical Vapor Deposition Market Value Share Analysis, by Application, 2016 and 2025
Figure 41: Middle East & Africa Chemical Vapor Deposition Market Value Share Analysis, by Country, 2016 and 2025
Figure 42: Latin America Chemical Vapor Deposition Market Value Share Analysis, by Category, 2016 and 2025
Figure 43: Latin America Chemical Vapor Deposition Market Value Share Analysis, by Technology, 2016 and 2025
Figure 44: Latin America Chemical Vapor Deposition Market Value Share Analysis, by Application, 2016 and 2025
Figure 45: Latin America Chemical Vapor Deposition Market Value Share Analysis, by Country, 2016 and 2025
Figure 46: Global Chemical Vapor Deposition Market Share Analysis, by Company (2016)
Copyright © Transparency Market Research, Inc. All Rights reserved
Trust Online

Chemical Vapor Deposition Market