
Reports
Reports
Analysts’ Viewpoint on Activated Alumina Market Scenario
Companies operating in the activated alumina market are focusing on key industries such as oil & gas and water treatment. Properties of activated alumina, such as absorbance, make it a valuable component for a wide range of end-users. Activated alumina is widely used in desiccation, fluoride adsorption, catalysis, vacuum systems, food preservatives, removing trace metals and acidic impurities from de-fluoridation of drinking water. Excellent adsorption capabilities of activated alumina make it a popular industrial desiccant. Mergers, acquisitions, joint ventures, and partnerships are some of the important strategies preferred by key players to expand their regional presence. Furthermore, these strategies help established players reduce competition. Apart from capacity expansions, activated alumina manufacturers are investing in R&D to develop new formulations.
Activated alumina is a highly porous and granular form of aluminum oxide. It is widely used as a desiccant, catalyst, and adsorbent. Activated alumina is manufactured by the dehydration of aluminum oxide at high temperature. It exhibits high porosity, resulting in excellent adsorption properties. Activated alumina is also resistant to abrasion and thermal shock. It does not swell, shrink, or disintegrate upon contact with water. Activated alumina can be employed as a base or acid due to its amphoteric properties. It also provides high stability over a wide pH range and has strong affinity toward halides. Activated alumina can be regenerated through heated compressed air and can be used for other applications such as pharmaceutical and pneumatic operations.
Activated alumina is prominently utilized as a desiccant in the oil & gas industry. It can adsorb large amount of liquids and gases without any chemical or physical transformation. It is used for dehydration of organic liquids such as aromatic solvents, liquid petroleum gas, gasoline, and steam cracked liquids. Activated alumina helps remove traces of moisture in gases such as synthesis gas, methyl chloride, and natural gas for gas dehydration. It is employed in the treatment and purification of water in the water treatment industry. Activated alumina absorbs impurities and heavy metals due to its high porosity and surface area.
Activated alumina desiccant is counted in the list of effective adsorbents and desiccants, which are used in numerous applications to remove moisture and purifying products. Activated alumina balls produce very dry air for industrial process and instrumentation purposes. Alumina adsorbent effectively removes arsenic. Activated alumina adsorbent is renowned for its use in water filtration applications, where it serves as a cost-effective adsorbent to remove fluoride from water
The global activated alumina market is estimated to grow at a decent pace during the forecast period, owing to the favorable properties of activated alumina, specifically for various industries such as oil & gas that include gas dehydration and liquid dehydration.
Consumption of gas (CNG, LNG, etc.) as a fuel has increased by 1.5 times in the last decade. These gases need to be free of contaminants and moisture in order to avoid corrosion and chocking of pipelines due to condensation of water.
The gases mentioned above are passed through activated alumina to remove moisture and impurities such as hydrogen sulfide and carbon dioxide. Activated alumina effectively removes these impurities and withstands shocks and heat without breakdown.
Natural gas is regarded as the fastest-growing source for the production of domestic energy. Thus increasing consumption of CNG and LNG as alternative fuel is anticipated to increase the demand for activated alumina.
Water scarcity is one of the major issues the world is facing. Demand for water is increasing at a substantial pace due to the increase in population across the globe. According to a report published by the United Nations, 1.8 billion people are expected to be living in geographies with absolute water scarcity by 2050. This estimate supports the fact published by The International Food Policy Research Institute, which estimates a 40% gap between the demand and supply of water across the globe over the next 15 years.
Governments in different countries are investing in water treatment infrastructure and technologies to counter these issues. For instance, the Government of China allocates around US$ 110 Bn per year for environment protection and pollution control, which includes wastewater treatment.
Activated alumina is preferred as a point-of-use or point-of-entry water treatment device. Arsenic, lead, and sodium fluoride are some major contaminants present in water streams. Activated alumina helps remove these contaminants effectively. Activated alumina uses also include treatment of source water, which often has high levels of sulfate concentration.
The effectiveness and level of adsorption depend on numerous factors, including water quality, particular contaminants, and the physiognomies of alumina itself. Thus, increase in investments in wastewater treatment and water recycling are anticipated to drive the demand for activated alumina during the forecast period.
In terms of form, the global activated alumina market has been classified into powder and beads. The beads segment dominated the global activated alumina market and held more than 55% share in 2021. Activated alumina beads offer high surface area to mass ratio and are highly pours, which makes them a highly efficient absorbent in various applications.
These beads are extensively used in the water treatment applications to remove impurities such as fluoride. They are utilized in oil & gas applications to dehydrate compressed air and gases such as liquid petroleum gas (LPG) and compressed natural gas (CNG). The segment is estimated to expand at a notable CAGR of 5.5% during the forecast period.
In terms of volume, Asia Pacific leads the global activated alumina market, owing to rise in investment in the water treatment infrastructure, which can be attributed to an increase in industrialization and urbanization in major economies such as China, India, and Japan. Increase in government investment in water treatment infrastructure and technologies and a rise in the demand for gases, such as LPG and CNG, have augmented the demand for activated alumina in the region. Asia Pacific accounted for more than 32% share of the global activated alumina market in 2021.
In terms of volume, North America and Europe are also major markets for activated alumina. These regions accounted for 23.8% and 33.3% value share, respectively, of the global market in 2021.
Latin America is a larger market for activated alumina than Middle East & Africa; however, the market in Middle East & Africa is likely to expand at a higher growth rate during the forecast period.
The global activated alumina market is highly consolidated, with a small number of large-scale vendors controlling a majority of the share. Most companies are investing considerably in comprehensive research and development activities, primarily to create environment-friendly products. Expansion of product portfolios and mergers and acquisitions are key strategies adopted by prominent players. BASF SE, J.M. Huber Corporation, Honeywell International Inc., Sumitomo Chemical Co., Ltd., Axens, Porocel, Dynamic Adsorbents, Inc., KIN Filter Engineering Co., Limited, and Sorbead India are the key entities operating in the market.
In August 2020, Axens announced that it had acquired the activated alumina business of Canada-based manufacturer Rio Tinto Alcan.
In April 2019, Evonik Industries AG, a leader in chemical catalysts, announced that it had expanded production of its activated metal catalysts in India. The company announced that it is expected to establish a new plant for production of metal catalyst at Dombivili, India.
Each of these players have been profiled in the global activated alumina market report based on parameters such as company overview, financial overview, business strategies, product portfolio, business segments, and recent developments
|
Attribute |
Detail |
|
Market Size Value in 2021 |
US$ 1.0 Bn |
|
Market Forecast Value in 2031 |
US$ 1.7 Bn |
|
Growth Rate (CAGR) |
5.2% |
|
Forecast Period |
2022–2031 |
|
Historical Data Available for |
2020 |
|
Quantitative Units |
US$ Bn for Value and Tons for Volume |
|
Market Analysis |
It includes cross-segment analysis at the global as well as regional level. Furthermore, the qualitative analysis includes drivers, restraints, opportunities, key trends, Porter’s Five Forces analysis, value chain analysis, and key trend analysis. |
|
Competition Landscape |
|
|
Format |
Electronic (PDF) + Excel |
|
Market Segmentation |
|
|
Regions Covered |
|
|
Countries Covered |
|
|
Companies Profiled |
|
|
Customization Scope |
Available upon request |
|
Pricing |
Available upon request |
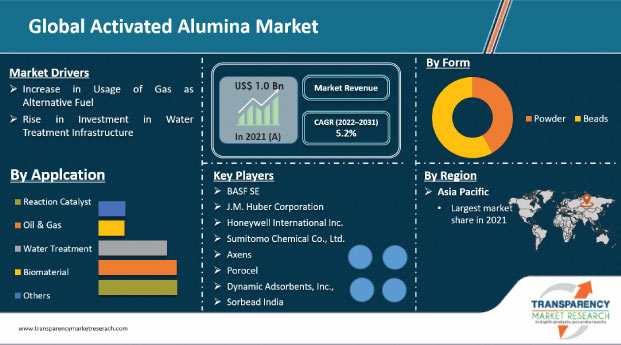
The activated alumina market stood at US$ 1.0 Bn in 2021
The activated alumina market is expected to grow at a CAGR of 5.2% from 2022 to 2031
Increase in usage of gas as alternative fuel and rise in investment in water treatment infrastructure
Beads was the largest form segment that held more than 55% value share in 2021
Asia Pacific was the most lucrative region and held more than 32% share of the activated alumina market in 2021
BASF SE, J.M. Huber Corporation, Honeywell International Inc., Sumitomo Chemical Co., Ltd., Axens, Porocel, Dynamic Adsorbents, Inc., KIN Filter Engineering Co., Limited, and Sorbead India.
1. Executive Summary
1.1. Activated Alumina Market Snapshot
1.2. Current Market and Future Potential
2. Market Overview
2.1. Market Segmentation
2.2. Market Trends
2.3. Market Dynamics
2.3.1. Drivers
2.3.2. Restraints
2.3.3. Opportunities
2.4. Porter’s Five Forces Analysis
2.5. Regulatory Analysis
2.6. Value Chain Analysis
2.6.1. List of Raw Materials Providers
2.6.2. List of Activated Alumina Manufacturers
2.6.3. List of Dealers/Distributors
2.6.4. List of Potential Customer
3. COVID-19 Impact Analysis
4. Activated Alumina Market Analysis and Forecast, by Form, 2022–2031
4.1. Introduction and Definitions
4.2. Global Activated Alumina Market Volume (Tons) and Value (US$ Mn) Forecast, by Form, 2022–2031
4.2.1. Powder
4.2.2. Beads
4.3. Global Activated Alumina Market Attractiveness, by Form
5. Global Activated Alumina Market Analysis and Forecast, Application, 2022–2031
5.1. Introduction and Definitions
5.2. Global Activated Alumina Market Volume (Tons) and Value (US$ Mn) Forecast, by Application, 2022–2031
5.2.1. Reaction Catalyst
5.2.2. Oil & Gas
5.2.2.1. Gas Dehydration
5.2.2.2. Liquid Dehydration
5.2.3. Water Treatment
5.2.4. Biomaterial
5.2.5. Others (including Pharmaceuticals and Textiles)
5.3. Global Activated Alumina Market Attractiveness, by Application
6. Global Activated Alumina Market Analysis and Forecast, by Region, 2022–2031
6.1. Key Findings
6.2. Global Activated Alumina Market Volume (Tons) and Value (US$ Mn) Forecast, by Region, 2022–2031
6.2.1. North America
6.2.2. Europe
6.2.3. Asia Pacific
6.2.4. Latin America
6.2.5. Middle East & Africa
6.3. Global Activated Alumina Market Attractiveness, by Region
7. North America Activated Alumina Market Analysis and Forecast, 2022–2031
7.1. Key Findings
7.2. North America Activated Alumina Market Volume (Tons) and Value (US$ Mn) Forecast, by Form, 2022–2031
7.3. North America Activated Alumina Market Volume (Tons) and Value (US$ Mn) Forecast, by Application, 2022–2031
7.4. North America Activated Alumina Market Volume (Tons) and Value (US$ Mn) Forecast, by Country, 2022–2031
7.4.1. U.S. Activated Alumina Market Volume (Tons) and Value (US$ Mn) Forecast, by Form, 2022–2031
7.4.2. U.S. Activated Alumina Market Volume (Tons) and Value (US$ Mn) Forecast, Application, 2022–2031
7.4.3. Canada Activated Alumina Market Volume (Tons) and Value (US$ Mn) Forecast, by Form, 2022–2031
7.4.4. Canada Activated Alumina Market Volume (Tons) and Value (US$ Mn) Forecast, Application, 2022–2031
7.5. North America Activated Alumina Market Attractiveness Analysis
8. Europe Activated Alumina Market Analysis and Forecast, 2022–2031
8.1. Key Findings
8.2. Europe Activated Alumina Market Volume (Tons) and Value (US$ Mn) Forecast, by Form, 2022–2031
8.3. Europe Activated Alumina Market Volume (Tons) and Value (US$ Mn) Forecast, by Application, 2022–2031
8.4. Europe Activated Alumina Market Volume (Tons) and Value (US$ Mn) Forecast, by Country and Sub-region, 2021-2031
8.4.1. Germany Activated Alumina Market Volume (Tons) and Value (US$ Mn) Forecast, by Form, 2022–2031
8.4.2. Germany Activated Alumina Market Volume (Tons) and Value (US$ Mn) Forecast, Application, 2022–2031
8.4.3. France Activated Alumina Market Volume (Tons) and Value (US$ Mn) Forecast, by Form, 2022–2031
8.4.4. France Activated Alumina Market Volume (Tons) and Value (US$ Mn) Forecast, Application, 2022–2031
8.4.5. U.K. Activated Alumina Market Volume (Tons) and Value (US$ Mn) Forecast, by Form, 2022–2031
8.4.6. U.K. Activated Alumina Market Volume (Tons) and Value (US$ Mn) Forecast, Application, 2022–2031
8.4.7. Italy Activated Alumina Market Volume (Tons) and Value (US$ Mn) Forecast, by Form, 2022–2031
8.4.8. Italy Activated Alumina Market Volume (Tons) and Value (US$ Mn) Forecast, Application, 2022–2031
8.4.9. Russia & CIS Activated Alumina Market Volume (Tons) and Value (US$ Mn) Forecast, by Form, 2022–2031
8.4.10. Russia & CIS Activated Alumina Market Volume (Tons) and Value (US$ Mn) Forecast, Application, 2022–2031
8.4.11. Rest of Europe Activated Alumina Market Volume (Tons) and Value (US$ Mn) Forecast, by Form, 2022–2031
8.4.12. Rest of Europe Activated Alumina Market Volume (Tons) and Value (US$ Mn) Forecast, Application, 2022–2031
8.5. Europe Activated Alumina Market Attractiveness Analysis
9. Asia Pacific Activated Alumina Market Analysis and Forecast, 2022–2031
9.1. Key Findings
9.2. Asia Pacific Activated Alumina Market Volume (Tons) and Value (US$ Mn) Forecast, by Form
9.3. Asia Pacific Activated Alumina Market Volume (Tons) and Value (US$ Mn) Forecast, by Application, 2022–2031
9.4. Asia Pacific Activated Alumina Market Volume (Tons) and Value (US$ Mn) Forecast, by Country and Sub-region, 2021-2031
9.4.1. China Activated Alumina Market Volume (Tons) and Value (US$ Mn) Forecast, by Form, 2022–2031
9.4.2. China Activated Alumina Market Volume (Tons) and Value (US$ Mn) Forecast, Application, 2022–2031
9.4.3. Japan Activated Alumina Market Volume (Tons) and Value (US$ Mn) Forecast, by Form, 2022–2031
9.4.4. Japan Activated Alumina Market Volume (Tons) and Value (US$ Mn) Forecast, Application, 2022–2031
9.4.5. India Activated Alumina Market Volume (Tons) and Value (US$ Mn) Forecast, by Form, 2022–2031
9.4.6. India Activated Alumina Market Volume (Tons) and Value (US$ Mn) Forecast, Application, 2022–2031
9.4.7. ASEAN Activated Alumina Market Volume (Tons) and Value (US$ Mn) Forecast, by Form, 2022–2031
9.4.8. ASEAN Activated Alumina Market Volume (Tons) and Value (US$ Mn) Forecast, Application, 2022–2031
9.4.9. Rest of Asia Pacific Activated Alumina Market Volume (Tons) and Value (US$ Mn) Forecast, by Form, 2022–2031
9.4.10. Rest of Asia Pacific Activated Alumina Market Volume (Tons) and Value (US$ Mn) Forecast, Application, 2022–2031
9.5. Asia Pacific Activated Alumina Market Attractiveness Analysis
10. Latin America Activated Alumina Market Analysis and Forecast, 2022–2031
10.1. Key Findings
10.2. Latin America Activated Alumina Market Volume (Tons) and Value (US$ Mn) Forecast, by Form, 2022–2031
10.3. Latin America Activated Alumina Market Volume (Tons) and Value (US$ Mn) Forecast, by Application, 2022–2031
10.4. Latin America Activated Alumina Market Volume (Tons) and Value (US$ Mn) Forecast, by Country and Sub-region, 2021-2031
10.4.1. Brazil Activated Alumina Market Volume (Tons) and Value (US$ Mn) Forecast, by Form, 2022–2031
10.4.2. Brazil Activated Alumina Market Volume (Tons) and Value (US$ Mn) Forecast, Application, 2022–2031
10.4.3. Mexico Activated Alumina Market Volume (Tons) and Value (US$ Mn) Forecast, by Form, 2022–2031
10.4.4. Mexico Activated Alumina Market Volume (Tons) and Value (US$ Mn) Forecast, Application, 2022–2031
10.4.5. Rest of Latin America Activated Alumina Market Volume (Tons) and Value (US$ Mn) Forecast, by Form, 2022–2031
10.4.6. Rest of Latin America Activated Alumina Market Volume (Tons) and Value (US$ Mn) Forecast, Application, 2022–2031
10.5. Latin America Activated Alumina Market Attractiveness Analysis
11. Middle East & Africa Activated Alumina Market Analysis and Forecast, 2022–2031
11.1. Key Findings
11.2. Middle East & Africa Activated Alumina Market Volume (Tons) and Value (US$ Mn) Forecast, by Form, 2022–2031
11.3. Middle East & Africa Activated Alumina Market Volume (Tons) and Value (US$ Mn) Forecast, by Application, 2022–2031
11.4. Middle East & Africa Activated Alumina Market Volume (Tons) and Value (US$ Mn) Forecast, by Country and Sub-region, 2021-2031
11.4.1. GCC Activated Alumina Market Volume (Tons) and Value (US$ Mn) Forecast, by Form, 2022–2031
11.4.2. GCC Activated Alumina Market Volume (Tons) and Value (US$ Mn) Forecast, Application, 2022–2031
11.4.3. South Africa Activated Alumina Market Volume (Tons) and Value (US$ Mn) Forecast, by Form, 2022–2031
11.4.4. South Africa Activated Alumina Market Volume (Tons) and Value (US$ Mn) Forecast, Application, 2022–2031
11.4.5. Rest of Middle East & Africa Activated Alumina Market Volume (Tons) and Value (US$ Mn) Forecast, by Form, 2022–2031
11.4.6. Rest of Middle East & Africa Activated Alumina Market Volume (Tons) and Value (US$ Mn) Forecast, Application, 2022–2031
11.5. Middle East & Africa Activated Alumina Market Attractiveness Analysis
12. Competition Landscape
12.1. Global Activated Alumina Company Market Share Analysis, 2021
12.2. Company Profiles (Details – Overview, Financials, Recent Developments, and Strategy)
12.2.1. BASF SE
12.2.1.1. Company Description
12.2.1.2. Business Overview
12.2.1.3. Financial Overview
12.2.1.4. Strategic Overview
12.2.2. J.M. Huber Corporation
12.2.2.1. Company Description
12.2.2.2. Business Overview
12.2.2.3. Financial Overview
12.2.2.4. Strategic Overview
12.2.3. Honeywell International Inc.
12.2.3.1. Company Description
12.2.3.2. Business Overview
12.2.3.3. Financial Overview
12.2.3.4. Strategic Overview
12.2.4. Sumitomo Chemical Co., Ltd.
12.2.4.1. Company Description
12.2.4.2. Business Overview
12.2.4.3. Financial Overview
12.2.4.4. Strategic Overview
12.2.5. Axens
12.2.5.1. Company Description
12.2.5.2. Business Overview
12.2.5.3. Financial Overview
12.2.5.4. Strategic Overview
12.2.6. Porocel
12.2.6.1. Company Description
12.2.6.2. Business Overview
12.2.6.3. Financial Overview
12.2.6.4. Strategic Overview
12.2.7. Dynamic Adsorbents, Inc.
12.2.7.1. Company Description
12.2.7.2. Business Overview
12.2.7.3. Financial Overview
12.2.7.4. Strategic Overview
12.2.8. KIN Filter Engineering Co., Limited
12.2.8.1. Company Description
12.2.8.2. Business Overview
12.2.8.3. Financial Overview
12.2.9. Sorbead India
12.2.9.1. Company Description
12.2.9.2. Business Overview
12.2.9.3. Financial Overview
12.2.10. Shayan Corporation
12.2.10.1. Company Description
12.2.10.2. Business Overview
12.2.10.3. Financial Overview
12.2.11. Baltimore Innovations Ltd.
12.2.11.1. Company Description
12.2.11.2. Business Overview
12.2.11.3. Financial Overview
12.2.12. Shandong Boyang New Materials Technology Co., Ltd.
12.2.12.1. Company Description
12.2.12.2. Business Overview
12.2.12.3. Financial Overview
12.2.13. Sialca Industries Company Description
12.2.13.1. Business Overview
12.2.13.2. Financial Overview
13. Primary Research: Key Insights
14. Appendix
List of Tables
Table 1: Global Activated Alumina Market Volume (Tons) Forecast, by Form, 2022–2031
Table 2: Global Activated Alumina Market Value (US$ Mn) Forecast, by Form, 2022–2031
Table 3: Global Activated Alumina Market Volume (Tons) Forecast, by Application, 2022–2031
Table 4: Global Activated Alumina Market Value (US$ Mn) Forecast, by Application, 2022–2031
Table 5: Global Activated Alumina Market Volume (Tons) Forecast, by Region, 2022–2031
Table 6: Global Activated Alumina Market Value (US$ Mn) Forecast, by Region, 2022–2031
Table 7: North America Activated Alumina Market Volume (Tons) Forecast, by Form, 2022–2031
Table 8: North America Activated Alumina Market Value (US$ Mn) Forecast, by Form, 2022–2031
Table 9: North America Activated Alumina Market Volume (Tons) Forecast, by Application, 2022–2031
Table 10: North America Activated Alumina Market Value (US$ Mn) Forecast, by Application, 2022–2031
Table 11: North America Activated Alumina Market Volume (Tons) Forecast, by Country, 2022–2031
Table 12: North America Activated Alumina Market Value (US$ Mn) Forecast, by Country, 2022–2031
Table 13: U.S. Activated Alumina Market Volume (Tons) Forecast, by Form, 2022–2031
Table 14: U.S. Activated Alumina Market Value (US$ Mn) Forecast, by Form, 2022–2031
Table 15: U.S. Activated Alumina Market Volume (Tons) Forecast, by Application, 2022–2031
Table 16: U.S. Activated Alumina Market Value (US$ Mn) Forecast, by Application, 2022–2031
Table 17: Canada Activated Alumina Market Volume (Tons) Forecast, by Form, 2022–2031
Table 18: Canada Activated Alumina Market Value (US$ Mn) Forecast, by Form, 2022–2031
Table 19: Canada Activated Alumina Market Volume (Tons) Forecast, by Application, 2022–2031
Table 20: Canada Activated Alumina Market Value (US$ Mn) Forecast, by Application 2022–2031
Table 21: Europe Activated Alumina Market Volume (Tons) Forecast, by Form, 2022–2031
Table 22: Europe Activated Alumina Market Value (US$ Mn) Forecast, by Form, 2022–2031
Table 23: Europe Activated Alumina Market Volume (Tons) Forecast, by Application, 2022–2031
Table 24: Europe Activated Alumina Market Value (US$ Mn) Forecast, by Application 2022–2031
Table 25: Europe Activated Alumina Market Volume (Tons) Forecast, by Country and Sub-region, 2022–2031
Table 26: Europe Activated Alumina Market Value (US$ Mn) Forecast, by Country and Sub-region, 2022–2031
Table 27: Germany Activated Alumina Market Volume (Tons) Forecast, by Form, 2022–2031
Table 28: Germany Activated Alumina Market Value (US$ Mn) Forecast, by Form, 2022–2031
Table 29: Germany Activated Alumina Market Volume (Tons) Forecast, by Application, 2022–2031
Table 30: Germany Activated Alumina Market Value (US$ Mn) Forecast, by Application 2022–2031
Table 31: France Activated Alumina Market Volume (Tons) Forecast, by Form, 2022–2031
Table 32: France Activated Alumina Market Value (US$ Mn) Forecast, by Form, 2022–2031
Table 33: France Activated Alumina Market Volume (Tons) Forecast, by Application, 2022–2031
Table 34: France Activated Alumina Market Value (US$ Mn) Forecast, by Application 2022–2031
Table 35: U.K. Activated Alumina Market Volume (Tons) Forecast, by Form, 2022–2031
Table 36: U.K. Activated Alumina Market Value (US$ Mn) Forecast, by Form, 2022–2031
Table 37: U.K. Activated Alumina Market Volume (Tons) Forecast, by Application, 2022–2031
Table 38: U.K. Activated Alumina Market Value (US$ Mn) Forecast, by Application 2022–2031
Table 39: Italy Activated Alumina Market Volume (Tons) Forecast, by Form, 2022–2031
Table 40: Italy Activated Alumina Market Value (US$ Mn) Forecast, by Form, 2022–2031
Table 41: Italy Activated Alumina Market Volume (Tons) Forecast, by Application, 2022–2031
Table 42: Italy Activated Alumina Market Value (US$ Mn) Forecast, by Application 2022–2031
Table 43: Spain Activated Alumina Market Volume (Tons) Forecast, by Form, 2022–2031
Table 44: Spain Activated Alumina Market Value (US$ Mn) Forecast, by Form, 2022–2031
Table 45: Spain Activated Alumina Market Volume (Tons) Forecast, by Application, 2022–2031
Table 46: Spain Activated Alumina Market Value (US$ Mn) Forecast, by Application 2022–2031
Table 47: Russia & CIS Activated Alumina Market Volume (Tons) Forecast, by Form, 2022–2031
Table 48: Russia & CIS Activated Alumina Market Value (US$ Mn) Forecast, by Form, 2022–2031
Table 49: Russia & CIS Activated Alumina Market Volume (Tons) Forecast, by Application, 2022–2031
Table 50: Russia & CIS Activated Alumina Market Value (US$ Mn) Forecast, by Application 2022–2031
Table 51: Rest of Europe Activated Alumina Market Volume (Tons) Forecast, by Form, 2022–2031
Table 52: Rest of Europe Activated Alumina Market Value (US$ Mn) Forecast, by Form, 2022–2031
Table 53: Rest of Europe Activated Alumina Market Volume (Tons) Forecast, by Application, 2022–2031
Table 54: Rest of Europe Activated Alumina Market Value (US$ Mn) Forecast, by Application 2022–2031
Table 55: Asia Pacific Activated Alumina Market Volume (Tons) Forecast, by Form, 2022–2031
Table 56: Asia Pacific Activated Alumina Market Value (US$ Mn) Forecast, by Form, 2022–2031
Table 57: Asia Pacific Activated Alumina Market Volume (Tons) Forecast, by Application, 2022–2031
Table 58: Asia Pacific Activated Alumina Market Value (US$ Mn) Forecast, by Application 2022–2031
Table 59: Asia Pacific Activated Alumina Market Volume (Tons) Forecast, by Country and Sub-region, 2022–2031
Table 60: Asia Pacific Activated Alumina Market Value (US$ Mn) Forecast, by Country and Sub-region, 2022–2031
Table 61: China Activated Alumina Market Volume (Tons) Forecast, by Form, 2022–2031
Table 62: China Activated Alumina Market Value (US$ Mn) Forecast, by Form 2022–2031
Table 63: China Activated Alumina Market Volume (Tons) Forecast, by Application, 2022–2031
Table 64: China Activated Alumina Market Value (US$ Mn) Forecast, by Application 2022–2031
Table 65: Japan Activated Alumina Market Volume (Tons) Forecast, by Form, 2022–2031
Table 66: Japan Activated Alumina Market Value (US$ Mn) Forecast, by Form, 2022–2031
Table 67: Japan Activated Alumina Market Volume (Tons) Forecast, by Application, 2022–2031
Table 68: Japan Activated Alumina Market Value (US$ Mn) Forecast, by Application 2022–2031
Table 69: India Activated Alumina Market Volume (Tons) Forecast, by Form, 2022–2031
Table 70: India Activated Alumina Market Value (US$ Mn) Forecast, by Form, 2022–2031
Table 71: India Activated Alumina Market Volume (Tons) Forecast, by Application, 2022–2031
Table 72: India Activated Alumina Market Value (US$ Mn) Forecast, by Application 2022–2031
Table 73: ASEAN Activated Alumina Market Volume (Tons) Forecast, by Form, 2022–2031
Table 74: ASEAN Activated Alumina Market Value (US$ Mn) Forecast, by Form, 2022–2031
Table 75: ASEAN Activated Alumina Market Volume (Tons) Forecast, by Application, 2022–2031
Table 76: ASEAN Activated Alumina Market Value (US$ Mn) Forecast, by Application 2022–2031
Table 77: Rest of Asia Pacific Activated Alumina Market Volume (Tons) Forecast, by Form, 2022–2031
Table 78: Rest of Asia Pacific Activated Alumina Market Value (US$ Mn) Forecast, by Form, 2022–2031
Table 79: Rest of Asia Pacific Activated Alumina Market Volume (Tons) Forecast, by Application, 2022–2031
Table 80: Rest of Asia Pacific Activated Alumina Market Value (US$ Mn) Forecast, by Application 2022–2031
Table 81: Latin America Activated Alumina Market Volume (Tons) Forecast, by Form, 2022–2031
Table 82: Latin America Activated Alumina Market Value (US$ Mn) Forecast, by Form, 2022–2031
Table 83: Latin America Activated Alumina Market Volume (Tons) Forecast, by Application, 2022–2031
Table 84: Latin America Activated Alumina Market Value (US$ Mn) Forecast, by Application 2022–2031
Table 85: Latin America Activated Alumina Market Volume (Tons) Forecast, by Country and Sub-region, 2022–2031
Table 86: Latin America Activated Alumina Market Value (US$ Mn) Forecast, by Country and Sub-region, 2022–2031
Table 87: Brazil Activated Alumina Market Volume (Tons) Forecast, by Form, 2022–2031
Table 88: Brazil Activated Alumina Market Value (US$ Mn) Forecast, by Form, 2022–2031
Table 89: Brazil Activated Alumina Market Volume (Tons) Forecast, by Application, 2022–2031
Table 90: Brazil Activated Alumina Market Value (US$ Mn) Forecast, by Application 2022–2031
Table 91: Mexico Activated Alumina Market Volume (Tons) Forecast, by Form, 2022–2031
Table 92: Mexico Activated Alumina Market Value (US$ Mn) Forecast, by Form, 2022–2031
Table 93: Mexico Activated Alumina Market Volume (Tons) Forecast, by Application, 2022–2031
Table 94: Mexico Activated Alumina Market Value (US$ Mn) Forecast, by Application 2022–2031
Table 95: Rest of Latin America Activated Alumina Market Volume (Tons) Forecast, by Form, 2022–2031
Table 96: Rest of Latin America Activated Alumina Market Value (US$ Mn) Forecast, by Form, 2022–2031
Table 97: Rest of Latin America Activated Alumina Market Volume (Tons) Forecast, by Application, 2022–2031
Table 98: Rest of Latin America Activated Alumina Market Value (US$ Mn) Forecast, by Application 2022–2031
Table 99: Middle East & Africa Activated Alumina Market Volume (Tons) Forecast, by Form, 2022–2031
Table 100: Middle East & Africa Activated Alumina Market Value (US$ Mn) Forecast, by Form, 2022–2031
Table 101: v Activated Alumina Market Volume (Tons) Forecast, by Application, 2022–2031
Table 102: Middle East & Africa Activated Alumina Market Value (US$ Mn) Forecast, by Application 2022–2031
Table 103: Middle East & Africa Activated Alumina Market Volume (Tons) Forecast, by Country and Sub-region, 2022–2031
Table 104: Middle East & Africa Activated Alumina Market Value (US$ Mn) Forecast, by Country and Sub-region, 2022–2031
Table 105: GCC Activated Alumina Market Volume (Tons) Forecast, by Form, 2022–2031
Table 106: GCC Activated Alumina Market Value (US$ Mn) Forecast, by Form, 2022–2031
Table 107: GCC Activated Alumina Market Volume (Tons) Forecast, by Application, 2022–2031
Table 108: GCC Activated Alumina Market Value (US$ Mn) Forecast, by Application 2022–2031
Table 109: South Africa Activated Alumina Market Volume (Tons) Forecast, by Form, 2022–2031
Table 110: South Africa Activated Alumina Market Value (US$ Mn) Forecast, by Form, 2022–2031
Table 111: South Africa Activated Alumina Market Volume (Tons) Forecast, by Application, 2022–2031
Table 112: South Africa Activated Alumina Market Value (US$ Mn) Forecast, by Application 2022–2031
Table 113: Rest of Middle East & Africa Activated Alumina Market Volume (Tons) Forecast, by Form, 2022–2031
Table 114: Rest of Middle East & Africa Activated Alumina Market Value (US$ Mn) Forecast, by Form, 2022–2031
Table 115: Rest of Middle East & Africa Activated Alumina Market Volume (Tons) Forecast, by Application, 2022–2031
Table 116: Rest of Middle East & Africa Activated Alumina Market Value (US$ Mn) Forecast, by Application 2022–2031
List of Figures
Figure 1: Global Activated Alumina Market Volume Share Analysis, by Form, 2021, 2027, and 2031
Figure 2: Global Activated Alumina Market Attractiveness, by Form
Figure 3: Global Activated Alumina Market Volume Share Analysis, by Application, 2021, 2027, and 2031
Figure 4: Global Activated Alumina Market Attractiveness, by Application
Figure 5: Global Activated Alumina Market Volume Share Analysis, by Region, 2021, 2027, and 2031
Figure 6: Global Activated Alumina Market Attractiveness, by Region
Figure 7: North America Activated Alumina Market Volume Share Analysis, by Form, 2021, 2027, and 2031
Figure 8: North America Activated Alumina Market Attractiveness, by Form
Figure 9: North America Activated Alumina Market Attractiveness, by Form
Figure 10: North America Activated Alumina Market Volume Share Analysis, by Application, 2021, 2027, and 2031
Figure 11: North America Activated Alumina Market Attractiveness, by Application
Figure 12: North America Activated Alumina Market Attractiveness, by Country and Sub-region
Figure 13: Europe Activated Alumina Market Volume Share Analysis, by Form, 2021, 2027, and 2031
Figure 14: Europe Activated Alumina Market Attractiveness, by Form
Figure 15: Europe Activated Alumina Market Volume Share Analysis, by Application, 2021, 2027, and 2031
Figure 16: Europe Activated Alumina Market Attractiveness, by Application
Figure 17: Europe Activated Alumina Market Volume Share Analysis, by Country and Sub-region, 2021, 2027, and 2031
Figure 18: Europe Activated Alumina Market Attractiveness, by Country and Sub-region
Figure 19: Asia Pacific Activated Alumina Market Volume Share Analysis, by Form, 2021, 2027, and 2031
Figure 20: Asia Pacific Activated Alumina Market Attractiveness, by Form
Figure 21: Asia Pacific Activated Alumina Market Volume Share Analysis, by Application, 2021, 2027, and 2031
Figure 22: Asia Pacific Activated Alumina Market Attractiveness, by Application
Figure 23: Asia Pacific Activated Alumina Market Volume Share Analysis, by Country and Sub-region, 2021, 2027, and 2031
Figure 24: Asia Pacific Activated Alumina Market Attractiveness, by Country and Sub-region
Figure 25: Latin America Activated Alumina Market Volume Share Analysis, by Form, 2021, 2027, and 2031
Figure 26: Latin America Activated Alumina Market Attractiveness, by Form
Figure 27: Latin America Activated Alumina Market Volume Share Analysis, by Application, 2021, 2027, and 2031
Figure 28: Latin America Activated Alumina Market Attractiveness, by Application
Figure 29: Latin America Activated Alumina Market Volume Share Analysis, by Country and Sub-region, 2021, 2027, and 2031
Figure 30: Latin America Activated Alumina Market Attractiveness, by Country and Sub-region
Figure 31: Middle East & Africa Activated Alumina Market Volume Share Analysis, by Form, 2021, 2027, and 2031
Figure 32: Middle East & Africa Activated Alumina Market Attractiveness, by Form
Figure 33: Middle East & Africa Activated Alumina Market Volume Share Analysis, by Application, 2021, 2027, and 2031
Figure 34: Middle East & Africa Activated Alumina Market Attractiveness, by Application
Figure 35: Middle East & Africa Activated Alumina Market Volume Share Analysis, by Country and Sub-region, 2021, 2027, and 2031
Figure 36: Middle East & Africa Activated Alumina Market Attractiveness, by Country and Sub-region
Copyright © Transparency Market Research, Inc. All Rights reserved
Trust Online

Activated Alumina Market