
Reports
Reports
Yellow pea protein is a supplement that is primarily extracted from yellow peas and is increasingly used across the food & beverages sector to increase protein content in shakes and smoothies. Over the past decade, new food trends have emerged at a consistent rate around the world, including veganism, free form, clean-label, and chemical-free. As a result, the demand for yellow pea protein has witnessed steady growth and the trend is expected to gain further momentum during the forecast period. The health benefits associated with yellow pea protein is another major factor that has attracted considerable interest from food manufacturers.
Plant-based food products have gained fast-paced popularity over the course of the last decade due to which, the demand for plant-based proteins continues to move in the upward trajectory– an important factor that is likely to drive the expansion of the global yellow pea protein market during the assessment period. Some of the other factors that are likely to aid the growth of the market for yellow pea protein include its optimum shelf life, easy-to-add attribute, stable price, nutrients content, and sustainability, among others. At present, yellow pea protein is increasingly being used to manufacture protein shake powders, vegan burgers, plant-based milk, etc.
At the back of these factors, along with the entry of a number of food manufacturers that are pinning their hopes of the growth of plant-based and vegan products, the global yellow pea protein market is expected to attain a market value of ~US$ 3.1 Bn by the end of 2030.
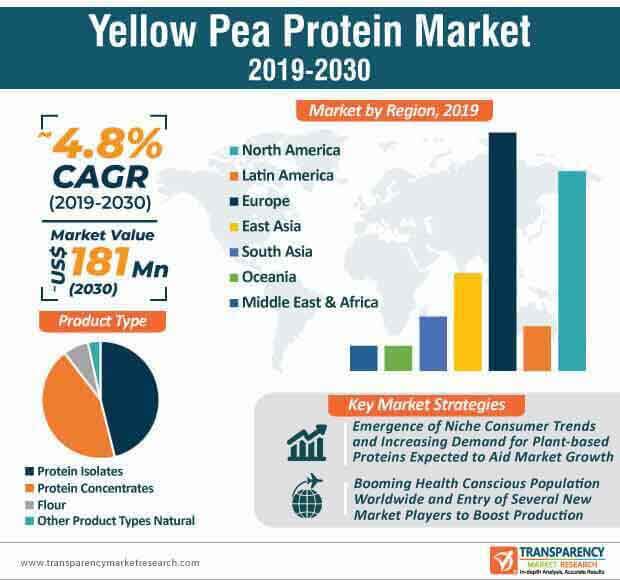
As niche trends, including veganism and plant-based eating continue to gain considerable momentum, yellow pea protein is projected to gain mainstream recognition over the next few years due to which, the global yellow pea protein market is on the course to experience steady growth. The number of health conscious and fitness-savvy consumers around the world, particularly in regions, including Europe and North America, has grown at an exponential pace over the past few years. As per current observations, the number is expected to rise at a rapid pace during the assessment period– a factor that is likely to provide a boost to the yellow pea protein market. Yellow pea protein has emerged as an exceptional source of iron, and aids in weight loss, muscle growth, and maintains cardiac health.
Due to mounting environmental concerns and animal cruelty reports, modern day consumers are gradually shying away from consuming meat-based products. As consumers continue to explore alternative sources of protein, food manufacturers are increasingly focusing on adding yellow pea protein products to their product portfolio to attract more consumers. Several prominent food manufacturers such as Warburtons have revealed that the company is adding yellow pea protein to their existing range of products. In addition, as yellow pea protein is not an allergen and has a higher environment-friendly quotient in comparison with other alternatives, it has gradually emerged as an exceptional source of protein. Over the past three to four years, the number of products with yellow pea protein has witnessed two-fold growth in several regions of the world and the numbers are likely to grow even further in the upcoming years.
In addition, several influential athletes and sports personalities have turned to yellow pea protein due to which, the demand is set to grow at a consistent pace in the upcoming years. Dieticians around the world are encouraging their customers to include yellow pea protein in their diet– another factor that is anticipated to boost the yellow pea protein market.
The ongoing COVID-19 pandemic is expected to have a minor impact on the overall growth of the global yellow pea protein market during the assessment period. As more number of consumers are turning their back toward meat-based products, especially in the Asia Pacific region due to the fear of contracting the novel coronavirus, plant-based proteins, including yellow pea protein are gaining considerable traction during the pandemic. However, stringent lockdowns in several nations and restriction on transportation and trade are some of the leading factors that are expected to negatively impact the offline sales of yellow pea protein products.
Analysts’ Viewpoint
The global yellow pea protein market is expected to expand at a healthy CAGR of 6.1% during the forecast period. The market growth is largely driven by evolving consumer trends, growing demand for plant-based proteins, growing awareness pertaining to the benefits of yellow pea protein, impactful marketing and brand awareness campaigns, and booming health conscious population worldwide. Although the sales are likely to remain lower than usual during 2020 due to the COVID-19 pandemic, the yellow pea protein market is likely to show signs of recovery in the last quarter of 2020.
Yellow Pea Protein Market: Overview
Yellow Pea Protein: Market Frontrunners
Yellow Pea Protein Market: Trends
Marketing Yellow Pea Protein as New Substitute to Conventional Ingredients
Yellow Pea Protein Market: Strategies
Target Region for Yellow Pea Protein Market
Yellow Pea Protein Market: Players
1. Executive Summary
1.1. Market Overview
1.2. Market Analysis
1.3. TMR Analysis and Recommendations
1.4. Opportunity Matrix
2. Market Introduction
2.1. Market Definition
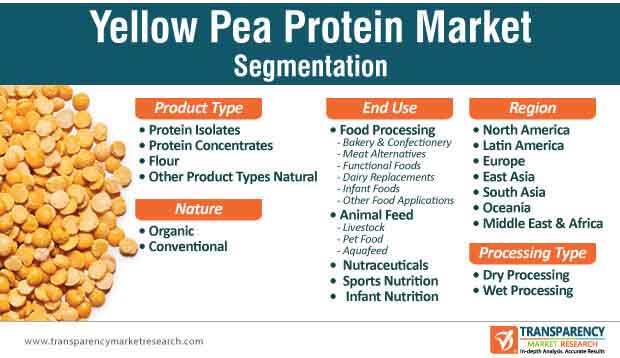
2.2. Market Taxonomy
3. Yellow Pea Protein Market Background
3.1. Evolution of Plant Based Food Products (2010 – 2020)
3.2. Key Certifications
3.3. Peas Production Overview
3.3.1. Total Production of Peas
3.3.2. Per Capita Consumption of Peas
3.3.3. Total Consumption of Peas
3.4. Policy Developments and Regulatory Scenario
3.5. Product Launches for Yellow Pea Protein in 2019 and 2020 (YTD)
3.6. Macro-Economic Indicators
3.7. Global Economic Outlook
3.7.1. Global GDP by Region and Country, 2006–2021
3.7.2. Global Industry Value Added
3.7.3. Global Retail Industry Outlook
3.8. Value Chain Analysis
3.8.1. Raw Material Suppliers
3.8.2. Yellow Pea Protein Manufacturers
3.8.3. Distributors/Suppliers/Wholesalers
3.8.4. Traders
3.8.5. End Users
3.9. Market Dynamics
3.9.1. Drivers
3.9.2. Restraints
3.9.3. Opportunities
3.9.4. Trends
3.10. Forecast Factors – Relevance and Impact
4. Global Yellow Pea Protein Market Analysis 2015–2019 and Forecast 2020–2030
4.1. Per Capita Consumption of Yellow Pea Protein, by Country/Region, 2020
4.2. Market Volume (Metric Tons) and Forecast
4.3. Market Size (US$ Mn) and Forecast
4.3.1. Market Size (US$ Mn) and Y-o-Y Growth
4.3.2. Absolute $ Opportunity
5. Global Yellow Pea Protein Market Pricing Analysis
5.1. Regional Average Pricing Analysis (US$/MT)
5.1.1. North America
5.1.2. Latin America
5.1.3. Europe
5.1.4. East Asia
5.1.5. South Asia
5.1.6. Oceania
5.1.7. Middle East & Africa
5.2. Pricing Analysis, By Product Type
6. Global Yellow Pea Protein Market Analysis 2015–2019 and Forecast 2020–2030, by Nature
6.1. Introduction
6.2. Historical Market Size (US$ Mn) and Volume (MT) By Nature, 2015–2019
6.3. Market Size (US$ Mn) and Volume (MT) Forecast By Nature, 2020-2030
6.3.1. Organic
6.3.2. Conventional
6.4. Attractiveness Analysis by Nature
7. Global Yellow Pea Protein Market Analysis 2015–2019 and Forecast 2020–2030, by Product Type
7.1. Introduction
7.2. Historical Market Size (US$ Mn) and Volume (MT) By Product Type, 2015–2019
7.3. Market Size (US$ Mn) and Volume (MT) Forecast By Product Type, 2020-2030
7.3.1. Protein Concentrates
7.3.2. Protein Isolates
7.3.3. Textured Protein
7.3.4. Hydrolyzed Protein
7.4. Attractiveness Analysis by Product Type
8. Global Yellow Pea Protein Market Analysis 2015–2019 and Forecast 2020–2030, by End-use
8.1. Introduction
8.2. Historical Market Size (US$ Mn) and Volume (MT) By End-use, 2015–2019
8.3. Market Size (US$ Mn) and Volume (MT) Forecast By End-use, 2020-2030
8.3.1. Food Processing
8.3.1.1. Meat Alternatives
8.3.1.2. Bakery Products
8.3.1.3. Confectionery
8.3.1.4. Snacks & Cereals
8.3.1.5. Meat-Based Products
8.3.1.6. Functional Beverages
8.3.1.7. Others
8.3.2. Animal Feed
8.3.2.1. Livestock
8.3.2.1.1. Cattle
8.3.2.1.2. Swine
8.3.2.1.3. Poultry
8.3.2.2. Pet Food
8.3.2.3. Aquafeed
8.3.3. Nutraceuticals
8.3.4. Sports Nutrition
8.3.5. Infant Nutrition
8.3.6. Cosmetic and Personal Care
8.4. Attractiveness Analysis By End-use
9. Global Yellow Pea Protein Market Analysis 2015–2019 and Forecast 2020–2030, by Processing Type
9.1. Introduction
9.2. Historical Market Size (US$ Mn) and Volume (MT) By Processing Type, 2015–2019
9.3. Market Size (US$ Mn) and Volume (MT) Forecast By Processing Type, 2020-2030
9.3.1. Dry Processing
9.3.2. Wet Processing Herbs
9.4. Attractiveness Analysis By Processing Type
10. Global Yellow Pea Protein Market Analysis 2015–2019 and Forecast 2020–2030, by Region
10.1. Introduction
10.2. Historical Market Size (US$ Mn) and Volume (MT) By Region, 2015–2019
10.3. Market Size (US$ Mn) and Volume (MT) Forecast By Region, 2020-2030
10.3.1. North America
10.3.2. Latin America
10.3.3. Europe
10.3.4. East Asia
10.3.5. South Asia
10.3.6. Oceania
10.3.7. MEA
10.4. Attractiveness Analysis By Region
11. North America Yellow Pea Protein Market Analysis 2015–2019 and Forecast 2020–2030
11.1. Introduction
11.2. Historical Market Value (US$ Mn) and Volume (Metric Tons) By Market Segments, 2015–2019
11.3. Market Value (US$ Mn) and Volume (Metric Tons) Forecast By Market Segments, 2020-2030
11.3.1. By Country
11.3.1.1. U.S.
11.3.1.2. Canada
11.3.2. By Nature
11.3.3. By Product Type
11.3.4. By End-use
11.3.5. By Processing Type
11.4. Market Attractiveness Analysis
11.4.1. By Country
11.4.2. By Nature
11.4.3. By Product Type
11.4.4. By End-use
11.4.5. By Processing Type
11.5. Drivers and Restraints: Impact Analysis
11.6. Key Participants Market Presence Intensity Mapping
12. Latin America Yellow Pea Protein Market Analysis 2015–2019 and Forecast 2020–2030
12.1. Introduction
12.2. Historical Market Value (US$ Mn) and Volume (Metric Tons) By Market Segments, 2015–2019
12.3. Market Value (US$ Mn) and Volume (Metric Tons) Forecast By Market Segments, 2020-2030
12.3.1. By Country
12.3.1.1. Brazil
12.3.1.2. Mexico
12.3.1.3. Chile
12.3.1.4. Peru
12.3.1.5. Argentina
12.3.1.6. Rest of Latin America
12.3.2. By Nature
12.3.3. By Product Type
12.3.4. By End-use
12.3.5. By Processing Type
12.4. Market Attractiveness Analysis
12.4.1. By Country
12.4.2. By Nature
12.4.3. By Product Type
12.4.4. By End-use
12.4.5. By Processing Type
12.5. Drivers and Restraints: Impact Analysis
12.6. Key Participants Market Presence Intensity Mapping
13. Europe Yellow Pea Protein Market Analysis 2015–2019 and Forecast 2020–2030
13.1. Introduction
13.2. Historical Market Value (US$ Mn) and Volume (Metric Tons) By Market Segments, 2015–2019
13.3. Market Value (US$ Mn) and Volume (Metric Tons) Forecast By Market Segments, 2020-2030
13.3.1. By Country
13.3.1.1. EU-4
13.3.1.2. U.K
13.3.1.3. BENELUX
13.3.1.4. NORDIC
13.3.1.5. Russia
13.3.1.6. Poland
13.3.1.7. Rest of Europe
13.3.2. By Nature
13.3.3. By Product Type
13.3.4. By End-use
13.3.5. By Processing Type
13.4. Market Attractiveness Analysis
13.4.1. By Country
13.4.2. By Nature
13.4.3. By Product Type
13.4.4. By End-use
13.4.5. By Processing Type
13.5. Drivers and Restraints: Impact Analysis
13.6. Key Participants Market Presence Intensity Mapping
14. East Asia Yellow Pea Protein Market Analysis 2015–2019 and Forecast 2020–2030
14.1. Introduction
14.2. Historical Market Value (US$ Mn) and Volume (Metric Tons) By Market Segments, 2015–2019
14.3. Market Value (US$ Mn) and Volume (Metric Tons) Forecast By Market Segments, 2020-2030
14.3.1. By Country
14.3.1.1. China
14.3.1.2. Japan
14.3.1.3. South Korea
14.3.2. By Nature
14.3.3. By Product Type
14.3.4. By End-use
14.3.5. By Processing Type
14.4. Market Attractiveness Analysis
14.4.1. By Country
14.4.2. By Nature
14.4.3. By Product Type
14.4.4. By End-use
14.4.5. By Processing Type
14.5. Drivers and Restraints: Impact Analysis
14.6. Key Participants Market Presence Intensity Mapping
15. South Asia Yellow Pea Protein Market Analysis 2015–2019 and Forecast 2020–2030
15.1. Introduction
15.2. Historical Market Value (US$ Mn) and Volume (Metric Tons) By Market Segments, 2015–2019
15.3. Market Value (US$ Mn) and Volume (Metric Tons) Forecast By Market Segments, 2020-2030
15.3.1. By Country
15.3.1.1. India
15.3.1.2. Thailand
15.3.1.3. Indonesia
15.3.1.4. Malaysia
15.3.1.5. Singapore
15.3.1.6. Rest of South Asia
15.3.2. By Nature
15.3.3. By Product Type
15.3.4. By End-use
15.3.5. By Processing Type
15.4. Market Attractiveness Analysis
15.4.1. By Country
15.4.2. By Nature
15.4.3. By Product Type
15.4.4. By End-use
15.4.5. By Processing Type
15.5. Drivers and Restraints: Impact Analysis
15.6. Key Participants Market Presence Intensity Mapping
16. Oceania Yellow Pea Protein Market Analysis 2015–2019 and Forecast 2020–2030
16.1. Introduction
16.2. Historical Market Value (US$ Mn) and Volume (Metric Tons) By Market Segments, 2015–2019
16.3. Market Value (US$ Mn) and Volume (Metric Tons) Forecast By Market Segments, 2020-2030
16.3.1. By Country
16.3.1.1. Australia
16.3.1.2. New Zealand
16.3.2. By Nature
16.3.3. By Product Type
16.3.4. By End-use
16.3.5. By Processing Type
16.4. Market Attractiveness Analysis
16.4.1. By Country
16.4.2. By Nature
16.4.3. By Product Type
16.4.4. By End-use
16.4.5. By Processing Type
16.5. Drivers and Restraints: Impact Analysis
16.6. Key Participants Market Presence Intensity Mapping
17. MEA Yellow Pea Protein Market Analysis 2015–2019 and Forecast 2020–2030
17.1. Introduction
17.2. Historical Market Value (US$ Mn) and Volume (Metric Tons) By Market Segments, 2015–2019
17.3. Market Value (US$ Mn) and Volume (Metric Tons) Forecast By Market Segments, 2020-2030
17.3.1. By Country
17.3.1.1. GCC Countries
17.3.1.2. South Africa
17.3.1.3. Turkey
17.3.1.4. Rest of MEA
17.3.2. By Nature
17.3.3. By Product Type
17.3.4. By End-use
17.3.5. By Processing Type
17.4. Market Attractiveness Analysis
17.4.1. By Country
17.4.2. By Nature
17.4.3. By Product Type
17.4.4. By End-use
17.4.5. By Processing Type
17.5. Drivers and Restraints: Impact Analysis
17.6. Key Participants Market Presence Intensity Mapping
18. Yellow Pea Protein Market Industry Structure
18.1. Market Analysis by Tier of Companies
18.1.1. By Large, Medium and Small
18.2. Market Concentration
18.2.1. By Top 5 and By Top 10
18.3. Market Share Analysis of Top 10 Players
18.4. Market Presence Analysis
18.4.1. By Regional Footprint
18.4.2. By Product Footprint
18.4.3. By Channel Footprint
19. Competition Analysis
19.1. Competition Dashboard
19.2. Competitive Benchmarking
19.3. Competition Developments (Mergers, Acquisitions and Expansions)
19.4. Competition Deepdive (Tentative List)
19.4.1. Roquette Frères
19.4.1.1. Overview
19.4.1.2. Product Portfolio
19.4.1.3. Profitability by Market Segments (Product/Channel/Region)
19.4.1.4. Sales Footprint
19.4.1.5. Channel Footprint
19.4.1.6. Strategy Overview
19.4.1.6.1. Marketing Strategy
19.4.1.6.2. Product Strategy
19.4.1.6.3. Channel Strategy
19.4.2. Cargill Inc.
19.4.2.1. Overview
19.4.2.2. Product Portfolio
19.4.2.3. Profitability by Market Segments (Product/Channel/Region)
19.4.2.4. Sales Footprint
19.4.2.5. Channel Footprint
19.4.2.6. Strategy Overview
19.4.2.6.1. Marketing Strategy
19.4.2.6.2. Product Strategy
19.4.2.6.3. Channel Strategy
19.4.3. Glanbia Plc.
19.4.3.1. Overview
19.4.3.2. Product Portfolio
19.4.3.3. Profitability by Market Segments (Product/Channel/Region)
19.4.3.4. Sales Footprint
19.4.3.5. Channel Footprint
19.4.3.6. Strategy Overview
19.4.3.6.1. Marketing Strategy
19.4.3.6.2. Product Strategy
19.4.3.6.3. Channel Strategy
19.4.4. Kerry Group PLC
19.4.4.1. Overview
19.4.4.2. Product Portfolio
19.4.4.3. Profitability by Market Segments (Product/Channel/Region)
19.4.4.4. Sales Footprint
19.4.4.5. Channel Footprint
19.4.4.6. Strategy Overview
19.4.4.6.1. Marketing Strategy
19.4.4.6.2. Product Strategy
19.4.4.6.3. Channel Strategy
19.4.5. DuPont de Nemours, Inc.
19.4.5.1. Overview
19.4.5.2. Product Portfolio
19.4.5.3. Profitability by Market Segments (Product/Channel/Region)
19.4.5.4. Sales Footprint
19.4.5.5. Channel Footprint
19.4.5.6. Strategy Overview
19.4.5.6.1. Marketing Strategy
19.4.5.6.2. Product Strategy
19.4.5.6.3. Channel Strategy
19.4.6. The Scoular Company
19.4.6.1. Overview
19.4.6.2. Product Portfolio
19.4.6.3. Profitability by Market Segments (Product/Channel/Region)
19.4.6.4. Sales Footprint
19.4.6.5. Channel Footprint
19.4.6.6. Strategy Overview
19.4.6.6.1. Marketing Strategy
19.4.6.6.2. Product Strategy
19.4.6.6.3. Channel Strategy
19.4.7. Puris Proteins LLC
19.4.7.1. Overview
19.4.7.2. Product Portfolio
19.4.7.3. Profitability by Market Segments (Product/Channel/Region)
19.4.7.4. Sales Footprint
19.4.7.5. Channel Footprint
19.4.7.6. Strategy Overview
19.4.7.6.1. Marketing Strategy
19.4.7.6.2. Product Strategy
19.4.7.6.3. Channel Strategy
19.4.8. Cosucra Groupe Warcoing S.A.
19.4.8.1. Overview
19.4.8.2. Product Portfolio
19.4.8.3. Profitability by Market Segments (Product/Channel/Region)
19.4.8.4. Sales Footprint
19.4.8.5. Channel Footprint
19.4.8.6. Strategy Overview
19.4.8.6.1. Marketing Strategy
19.4.8.6.2. Product Strategy
19.4.8.6.3. Channel Strategy
19.4.9. Bata Food
19.4.9.1. Overview
19.4.9.2. Product Portfolio
19.4.9.3. Profitability by Market Segments (Product/Channel/Region)
19.4.9.4. Sales Footprint
19.4.9.5. Channel Footprint
19.4.9.6. Strategy Overview
19.4.9.6.1. Marketing Strategy
19.4.9.6.2. Product Strategy
19.4.9.6.3. Channel Strategy
19.4.10. Shandong Jianyuan Group
19.4.10.1. Overview
19.4.10.2. Product Portfolio
19.4.10.3. Profitability by Market Segments (Product/Channel/Region)
19.4.10.4. Sales Footprint
19.4.10.5. Channel Footprint
19.4.10.6. Strategy Overview
19.4.10.6.1. Marketing Strategy
19.4.10.6.2. Product Strategy
19.4.10.6.3. Channel Strategy
19.4.11. Axiom Foods, Inc.
19.4.11.1. Overview
19.4.11.2. Product Portfolio
19.4.11.3. Profitability by Market Segments (Product/Channel/Region)
19.4.11.4. Sales Footprint
19.4.11.5. Channel Footprint
19.4.11.6. Strategy Overview
19.4.11.6.1. Marketing Strategy
19.4.11.6.2. Product Strategy
19.4.11.6.3. Channel Strategy
19.4.12. The Green Lab LLC
19.4.12.1. Overview
19.4.12.2. Product Portfolio
19.4.12.3. Profitability by Market Segments (Product/Channel/Region)
19.4.12.4. Sales Footprint
19.4.12.5. Channel Footprint
19.4.12.6. Strategy Overview
19.4.12.6.1. Marketing Strategy
19.4.12.6.2. Product Strategy
19.4.12.6.3. Channel Strategy
20. Assumptions and Acronyms Used
21. Research Methodology
List of Table
Table 01: Global Yellow Pea Protein Historical Market Value (US$ Mn) by Region, 2015–2019
Table 02: Global Yellow Pea Protein Forecast Market Value (US$ Mn) by Region, 2020-2030
Table 03: Global Yellow Pea Protein Historical Market Volume (Metric Tons) by Region, 2015–2019
Table 04: Global Yellow Pea Protein Forecast Market Volume (Metric Tons) by Region, 2020–2030
Table 05: Global Yellow Pea Protein Historical Market Value (US$ Mn) by Nature, 2015–2019
Table 06: Global Yellow Pea Protein Forecast Market Value (US$ Mn) by Nature, 2020–2030
Table 07: Global Yellow Pea Protein Historical Market Volume (Metric Tons) by Nature, 2015–2019
Table 08: Global Yellow Pea Protein Forecast Market Volume (Metric Tons) by Nature, 2020–2030
Table 09: Global Yellow Pea Protein Historical Market Value (US$ Mn) by End-Use, 2015–2019
Table 10: Global Yellow Pea Protein Forecast Market Value (US$ Mn) by End-Use, 2020–2030
Table 11: Global Yellow Pea Protein Historical Market Volume (Metric Tons) by End-Use, 2015–2019
Table 12: Global Yellow Pea Protein Forecast Market Volume (Metric Tons) by End-Use, 2020–2030
Table 13: Global Yellow Pea Protein Historical Market Value (US$ Mn) by Product Type, 2015–2019
Table 14: Global Yellow Pea Protein Forecast Market Value (US$ Mn) by Product Type, 2020–2030
Table 15: Global Yellow Pea Protein Historical Market Volume (Metric Tons) by Product Type, 2015–2019
Table 16: Global Yellow Pea Protein Forecast Market Volume (Metric Tons) by Product Type, 2020–2030
Table 17: Global Yellow Pea Protein Historical Market Value (US$ Mn) by Processing Type, 2015–2019
Table 18: Global Yellow Pea Protein Forecast Market Value (US$ Mn) by Processing Type, 2020–2030
Table 19: Global Yellow Pea Protein Historical Market Volume (Metric Tons) by Processing Type, 2015–2019
Table 20: Global Yellow Pea Protein Forecast Market Volume (Metric Tons) by Processing Type, 2020–2030
Table 21: North America Yellow Pea Protein Historical Market Value (US$ Mn) by Country, 2015–2019
Table 22: North America Yellow Pea Protein Forecast Market Value (US$ Mn) by Country, 2020–2030
Table 23: North America Yellow Pea Protein Historical Market Volume (Metric Tons) by Country, 2015–2019
Table 24: North America Yellow Pea Protein Forecast Market Volume (Metric Tons) by Country, 2020–2030
Table 25: North America Yellow Pea Protein Historical Market Value (US$ Mn) by Nature, 2015–2019
Table 26: North America Yellow Pea Protein Forecast Market Value (US$ Mn) by Nature, 2020–2030
Table 27: North America Yellow Pea Protein Historical Market Volume (Metric Tons) by Nature, 2015–2019
Table 28: North America Yellow Pea Protein Forecast Market Volume (Metric Tons) by Nature, 2020–2030
Table 29: North America Yellow Pea Protein Historical Market Value (US$ Mn) by End-Use, 2015–2019
Table 30: North America Yellow Pea Protein Forecast Market Value (US$ Mn) by End-Use, 2020–2030
Table 31: North America Yellow Pea Protein Historical Market Volume (Metric Tons) by End-Use, 2015–2019
Table 32: North America Yellow Pea Protein Forecast Market Volume (Metric Tons) by End-Use, 2020–2030
Table 33: North America Yellow Pea Protein Historical Market Value (US$ Mn) by Product Type, 2015–2019
Table 34: North America Yellow Pea Protein Forecast Market Value (US$ Mn) by Product Type, 2020–2030
Table 35: North America Yellow Pea Protein Historical Market Volume (Metric Tons) by Product Type, 2015–2019
Table 36: North America Yellow Pea Protein Forecast Market Volume (Metric Tons) by Product Type, 2020–2030
Table 37: North America Yellow Pea Protein Historical Market Value (US$ Mn) by Processing Type, 2015–2019
Table 38: North America Yellow Pea Protein Forecast Market Value (US$ Mn) by Processing Type, 2020–2030
Table 39: North America Yellow Pea Protein Historical Market Volume (Metric Tons) by Processing Type, 2015–2019
Table 40: North America Yellow Pea Protein Forecast Market Volume (Metric Tons) by Processing Type, 2020–2030
Table 41: Latin America Yellow Pea Protein Historical Market Value (US$ Mn) by Country, 2015–2019
Table 42: Latin America Yellow Pea Protein Forecast Market Value (US$ Mn) by Country, 2020–2030
Table 43: Latin America Yellow Pea Protein Historical Market Volume (Metric Tons) by Country, 2015–2019
Table 44: Latin America Yellow Pea Protein Forecast Market Volume (Metric Tons) by Country, 2020–2030
Table 45: Latin America Yellow Pea Protein Historical Market Value (US$ Mn) by Nature, 2015–2019
Table 46: Latin America Yellow Pea Protein Forecast Market Value (US$ Mn) by Nature, 2020–2030
Table 47: Latin America Yellow Pea Protein Historical Market Volume (Metric Tons) by Nature, 2015–2019
Table 48: Latin America Yellow Pea Protein Forecast Market Volume (Metric Tons) by Nature, 2020–2030
Table 49: Latin America Yellow Pea Protein Historical Market Value (US$ Mn) by End-Use, 2015–2019
Table 50: Latin America Yellow Pea Protein Forecast Market Value (US$ Mn) by End-Use, 2020–2030
Table 51: Latin America Yellow Pea Protein Historical Market Volume (Metric Tons) by End-Use, 2015–2019
Table 52: Latin America Yellow Pea Protein Forecast Market Volume (Metric Tons) by End-Use, 2020–2030
Table 53: Latin America Yellow Pea Protein Historical Market Value (US$ Mn) by Product Type, 2015–2019
Table 54: Latin America Yellow Pea Protein Forecast Market Value (US$ Mn) by Product Type, 2020–2030
Table 55: Latin America Yellow Pea Protein Historical Market Volume (Metric Tons) by Product Type, 2015–2019
Table 56: Latin America Yellow Pea Protein Forecast Market Volume (Metric Tons) by Product Type, 2020–2030
Table 57: Latin America Yellow Pea Protein Historical Market Value (US$ Mn) by Processing Type, 2015–2019
Table 58: Latin America Yellow Pea Protein Forecast Market Value (US$ Mn) by Processing Type, 2020–2030
Table 59: Latin America Yellow Pea Protein Historical Market Volume (Metric Tons) by Processing Type, 2015–2019
Table 60: Latin America Yellow Pea Protein Forecast Market Volume (Metric Tons) by Processing Type, 2020–2030
Table 61: Europe Yellow Pea Protein Historical Market Value (US$ Mn) by Country, 2015–2019
Table 62: Europe Yellow Pea Protein Forecast Market Value (US$ Mn) by Country, 2020–2030
Table 63: Europe Yellow Pea Protein Historical Market Volume (Metric Tons) by Country, 2015–2019
Table 64: Europe Yellow Pea Protein Forecast Market Volume (Metric Tons) by Country, 2020–2030
Table 65: Europe Yellow Pea Protein Historical Market Value (US$ Mn) by Nature, 2015–2019
Table 66: Europe Yellow Pea Protein Forecast Market Value (US$ Mn) by Nature, 2020–2030
Table 67: Europe Yellow Pea Protein Historical Market Volume (Metric Tons) by Nature, 2015–2019
Table 68: Europe Yellow Pea Protein Forecast Market Volume (Metric Tons) by Nature, 2020–2030
Table 69: Europe Yellow Pea Protein Historical Market Value (US$ Mn) by End-Use, 2015–2019
Table 70: Europe Yellow Pea Protein Forecast Market Value (US$ Mn) by End-Use, 2020–2030
Table 71: Europe Yellow Pea Protein Historical Market Volume (Metric Tons) by End-Use, 2015–2019
Table 72: Europe Yellow Pea Protein Forecast Market Volume (Metric Tons) by End-Use, 2020–2030
Table 73: Europe Yellow Pea Protein Historical Market Value (US$ Mn) by Product Type, 2015–2019
Table 74: Europe Yellow Pea Protein Forecast Market Value (US$ Mn) by Product Type, 2020–2030
Table 75: Europe Yellow Pea Protein Historical Market Volume (Metric Tons) by Product Type, 2015–2019
Table 76: Europe Yellow Pea Protein Forecast Market Volume (Metric Tons) by Product Type, 2020–2030
Table 77: Europe Yellow Pea Protein Historical Market Value (US$ Mn) by Processing Type, 2015–2019
Table 78: Europe Yellow Pea Protein Forecast Market Value (US$ Mn) by Processing Type, 2020–2030
Table 79: Europe Yellow Pea Protein Historical Market Volume (Metric Tons) by Processing Type, 2015–2019
Table 80: Europe Yellow Pea Protein Forecast Market Volume (Metric Tons) by Processing Type, 2020–2030
Table 81: East Asia Yellow Pea Protein Historical Market Value (US$ Mn) by Country, 2015–2019
Table 82: East Asia Yellow Pea Protein Forecast Market Value (US$ Mn) by Country, 2020–2030
Table 83: East Asia Yellow Pea Protein Historical Market Volume (Metric Tons) by Country, 2015–2019
Table 84: East Asia Yellow Pea Protein Forecast Market Volume (Metric Tons) by Country, 2020–2030
Table 85: East Asia Yellow Pea Protein Historical Market Value (US$ Mn) by Nature, 2015–2019
Table 86: East Asia Yellow Pea Protein Forecast Market Value (US$ Mn) by Nature, 2020–2030
Table 87: East Asia Yellow Pea Protein Historical Market Volume (Metric Tons) by Nature, 2015–2019
Table 88: East Asia Yellow Pea Protein Forecast Market Volume (Metric Tons) by Nature, 2020–2030
Table 89: East Asia Yellow Pea Protein Historical Market Value (US$ Mn) by End-Use, 2015–2019
Table 90: East Asia Yellow Pea Protein Forecast Market Value (US$ Mn) by End-Use, 2020–2030
Table 91: East Asia Yellow Pea Protein Historical Market Volume (Metric Tons) by End-Use, 2015–2019
Table 92: East Asia Yellow Pea Protein Forecast Market Volume (Metric Tons) by End-Use, 2020–2030
Table 93: East Asia Yellow Pea Protein Historical Market Value (US$ Mn) by Product Type, 2015–2019
Table 94: East Asia Yellow Pea Protein Forecast Market Value (US$ Mn) by Product Type, 2020–2030
Table 95: East Asia Yellow Pea Protein Historical Market Volume (Metric Tons) by Product Type, 2015–2019
Table 96: East Asia Yellow Pea Protein Forecast Market Volume (Metric Tons) by Product Type, 2020–2030
Table 97: East Asia Yellow Pea Protein Historical Market Value (US$ Mn) by Processing Type, 2015–2019
Table 98: East Asia Yellow Pea Protein Forecast Market Value (US$ Mn) by Processing Type, 2020–2030
Table 99: East Asia Yellow Pea Protein Historical Market Volume (Metric Tons) by Processing Type, 2015–2019
Table 100: East Asia Yellow Pea Protein Forecast Market Volume (Metric Tons) by Processing Type, 2020–2030
Table 101: South Asia Yellow Pea Protein Historical Market Value (US$ Mn) by Country, 2015–2019
Table 102: South Asia Yellow Pea Protein Forecast Market Value (US$ Mn) by Country, 2020–2030
Table 103: South Asia Yellow Pea Protein Historical Market Volume (Metric Tons) by Country, 2015–2019
Table 104: South Asia Yellow Pea Protein Forecast Market Volume (Metric Tons) by Country, 2020–2030
Table 105: South Asia Yellow Pea Protein Historical Market Value (US$ Mn) by Nature, 2015–2019
Table 106: South Asia Yellow Pea Protein Forecast Market Value (US$ Mn) by Nature, 2020–2030
Table 107: South Asia Yellow Pea Protein Historical Market Volume (Metric Tons) by Nature, 2015–2019
Table 108: South Asia Yellow Pea Protein Forecast Market Volume (Metric Tons) by Nature, 2020–2030
Table 109: South Asia Yellow Pea Protein Historical Market Value (US$ Mn) by End-Use, 2015–2019
Table 110: South Asia Yellow Pea Protein Forecast Market Value (US$ Mn) by End-Use, 2020–2030
Table 111: South Asia Yellow Pea Protein Historical Market Volume (Metric Tons) by End-Use, 2015–2019
Table 112: South Asia Yellow Pea Protein Forecast Market Volume (Metric Tons) by End-Use, 2020–2030
Table 113: South Asia Yellow Pea Protein Historical Market Value (US$ Mn) by Product Type, 2015–2019
Table 114: South Asia Yellow Pea Protein Forecast Market Value (US$ Mn) by Product Type, 2020–2030
Table 115: South Asia Yellow Pea Protein Historical Market Volume (Metric Tons) by Product Type, 2015–2019
Table 116: South Asia Yellow Pea Protein Forecast Market Volume (Metric Tons) by Product Type, 2020–2030
Table 117: South Asia Yellow Pea Protein Historical Market Value (US$ Mn) by Processing Type, 2015–2019
Table 118: South Asia Yellow Pea Protein Forecast Market Value (US$ Mn) by Processing Type, 2020–2030
Table 119: South Asia Yellow Pea Protein Historical Market Volume (Metric Tons) by Processing Type, 2015–2019
Table 120: South Asia Yellow Pea Protein Forecast Market Volume (Metric Tons) by Processing Type, 2020–2030
Table 121: Oceania Yellow Pea Protein Historical Market Value (US$ Mn) by Country, 2015–2019
Table 122: Oceania Yellow Pea Protein Forecast Market Value (US$ Mn) by Country, 2020–2030
Table 123: Oceania Yellow Pea Protein Historical Market Volume (Metric Tons) by Country, 2015–2019
Table 124: Oceania Yellow Pea Protein Forecast Market Volume (Metric Tons) by Country, 2020–2030
Table 125: Oceania Yellow Pea Protein Historical Market Value (US$ Mn) by Nature, 2015–2019
Table 126: Oceania Yellow Pea Protein Forecast Market Value (US$ Mn) by Nature, 2020–2030
Table 127: Oceania Yellow Pea Protein Historical Market Volume (Metric Tons) by Nature, 2015–2019
Table 128: Oceania Yellow Pea Protein Forecast Market Volume (Metric Tons) by Nature, 2020–2030
Table 129: Oceania Yellow Pea Protein Historical Market Value (US$ Mn) by End-Use, 2015–2019
Table 130: Oceania Yellow Pea Protein Forecast Market Value (US$ Mn) by End-Use, 2020–2030
Table 131: Oceania Yellow Pea Protein Historical Market Volume (Metric Tons) by End-Use, 2015–2019
Table 132: Oceania Yellow Pea Protein Forecast Market Volume (Metric Tons) by End-Use, 2020–2030
Table 133: Oceania Yellow Pea Protein Historical Market Value (US$ Mn) by Product Type, 2015–2019
Table 134: Oceania Yellow Pea Protein Forecast Market Value (US$ Mn) by Product Type, 2020–2030
Table 135: Oceania Yellow Pea Protein Historical Market Volume (Metric Tons) by Product Type, 2015–2019
Table 136: Oceania Yellow Pea Protein Forecast Market Volume (Metric Tons) by Product Type, 2020–2030
Table 137: Oceania Yellow Pea Protein Historical Market Value (US$ Mn) by Processing Type, 2015–2019
Table 138: Oceania Yellow Pea Protein Forecast Market Value (US$ Mn) by Processing Type, 2020–2030
Table 139: Oceania Yellow Pea Protein Historical Market Volume (Metric Tons) by Processing Type, 2015–2019
Table 140: Oceania Yellow Pea Protein Forecast Market Volume (Metric Tons) by Processing Type, 2020–2030
Table 141: Middle East & Africa Yellow Pea Protein Historical Market Value (US$ Mn) by Country, 2015–2019
Table 142: Middle East & Africa Yellow Pea Protein Forecast Market Value (US$ Mn) by Country, 2020–2030
Table 143: Middle East & Africa Yellow Pea Protein Historical Market Volume (Metric Tons) by Country, 2015–2019
Table 144: Middle East & Africa Yellow Pea Protein Forecast Market Volume (Metric Tons) by Country, 2020–2030
Table 145: Middle East & Africa Yellow Pea Protein Historical Market Value (US$ Mn) by Nature, 2015–2019
Table 146: Middle East & Africa Yellow Pea Protein Forecast Market Value (US$ Mn) by Nature, 2020–2030
Table 147: Middle East & Africa Yellow Pea Protein Historical Market Volume (Metric Tons) by Nature, 2015–2019
Table 148: Middle East & Africa Yellow Pea Protein Forecast Market Volume (Metric Tons) by Nature, 2020–2030
Table 149: Middle East & Africa Yellow Pea Protein Historical Market Value (US$ Mn) by End-Use, 2015–2019
Table 150: Middle East & Africa Yellow Pea Protein Forecast Market Value (US$ Mn) by End-Use, 2020–2030
Table 151: Middle East & Africa Yellow Pea Protein Historical Market Volume (Metric Tons) by End-Use, 2015–2019
Table 152: Middle East & Africa Yellow Pea Protein Forecast Market Volume (Metric Tons) by End-Use, 2020–2030
Table 153: Middle East & Africa Yellow Pea Protein Historical Market Value (US$ Mn) by Product Type, 2015–2019
Table 154: Middle East & Africa Yellow Pea Protein Forecast Market Value (US$ Mn) by Product Type, 2020–2030
Table 155: Middle East & Africa Yellow Pea Protein Historical Market Volume (Metric Tons) by Product Type, 2015–2019
Table 156: Middle East & Africa Yellow Pea Protein Forecast Market Volume (Metric Tons) by Product Type, 2020–2030
Table 157: Middle East & Africa Yellow Pea Protein Historical Market Value (US$ Mn) by Processing Type, 2015–2019
Table 158: Middle East & Africa Yellow Pea Protein Forecast Market Value (US$ Mn) by Processing Type, 2020–2030
Table 159: Middle East & Africa Yellow Pea Protein Historical Market Volume (Metric Tons) by Processing Type, 2015–2019
Table 160: Middle East & Africa Yellow Pea Protein Forecast Market Volume (Metric Tons) by Processing Type, 2020–2030
List of Figure
Figure 01: Global Yellow Pea Protein Market Value (US$ Mn) and Volume (MT) Forecast, 2020–2030
Figure 02: Global Yellow Pea Protein Market Absolute $ Opportunity (US$ Mn), 2020–2030
Figure 03: Global Yellow Pea Protein Market Value (US$ Mn) and % Growth by Region, 2020 & 2030
Figure 04: Global Yellow Pea Protein Market Attractiveness, by Region, 2020 to 2030
Figure 05: Global Yellow Pea Protein Market Y-o-Y Growth Rate by Region, 2020 - 2030
Figure 06: Global Yellow Pea Protein Market Value (US$ Mn) and % Growth by Nature, 2020 & 2030
Figure 07: Global Yellow Pea Protein Market Attractiveness, by Nature, 2020 to 2030
Figure 08: Global Yellow Pea Protein Market Y-o-Y Growth Rate by Nature, 2020 - 2030
Figure 09: Global Yellow Pea Protein Market Value (US$ Mn) and % Growth by End-Use, 2020 & 2030
Figure 10: Global Yellow Pea Protein Market Attractiveness, by End-Use, 2020 to 2030
Figure 11: Global Yellow Pea Protein Market Y-o-Y Growth Rate by End-Use, 2020 - 2030
Figure 12: Global Yellow Pea Protein Market Value (US$ Mn) and % Growth by Product Type, 2020 & 2030
Figure 13: Global Yellow Pea Protein Market Attractiveness, by Product Type, 2020 to 2030
Figure 14: Global Yellow Pea Protein Market Y-o-Y Growth Rate by Product Type, 2020 - 2030
Figure 15: Global Yellow Pea Protein Market Value (US$ Mn) and % Growth by Processing Type, 2020 & 2030
Figure 16: Global Yellow Pea Protein Market Attractiveness, by Processing Type, 2020 to 2030
Figure 17: Global Yellow Pea Protein Market Y-o-Y Growth Rate by Processing Type, 2020 - 2030
Figure 18: North America Yellow Pea Protein Market Value (US$ Mn) and % Growth by Country, 2020 & 2030
Figure 19: North America Yellow Pea Protein Market Attractiveness, by Country, 2020 to 2030
Figure 20: North America Yellow Pea Protein Market Y-o-Y Growth Rate by Country, 2020 - 2030
Figure 21: North America Yellow Pea Protein Market Value (US$ Mn) and % Growth by Nature, 2020 & 2030
Figure 22: North America Yellow Pea Protein Market Attractiveness, by Nature, 2020 to 2030
Figure 23: North America Yellow Pea Protein Market Y-o-Y Growth Rate by Nature, 2020 - 2030
Figure 24: North America Yellow Pea Protein Market Value (US$ Mn) and % Growth by End-Use, 2020 & 2030
Figure 25: North America Yellow Pea Protein Market Attractiveness, by End-Use, 2020 to 2030
Figure 26: North America Yellow Pea Protein Market Y-o-Y Growth Rate by End-Use, 2020 - 2030
Figure 27: North America Yellow Pea Protein Market Value (US$ Mn) and % Growth by Product Type, 2020 & 2030
Figure 28: North America Yellow Pea Protein Market Attractiveness, by Product Type, 2020 to 2030
Figure 29: North America Yellow Pea Protein Market Y-o-Y Growth Rate by Product Type, 2020 - 2030
Figure 30: North America Yellow Pea Protein Market Value (US$ Mn) and % Growth by Processing Type, 2020 & 2030
Figure 31: North America Yellow Pea Protein Market Attractiveness, by Processing Type, 2020 to 2030
Figure 32: North America Yellow Pea Protein Market Y-o-Y Growth Rate by Processing Type, 2020 - 2030
Figure 33: Latin America Yellow Pea Protein Market Value (US$ Mn) and % Growth by Country, 2020 & 2030
Figure 34: Latin America Yellow Pea Protein Market Attractiveness, by Country, 2020 to 2030
Figure 35: Latin America Yellow Pea Protein Market Y-o-Y Growth Rate by Country, 2020 - 2030
Figure 36: Latin America Yellow Pea Protein Market Value (US$ Mn) and % Growth by Nature, 2020 & 2030
Figure 37: Latin America Yellow Pea Protein Market Attractiveness, by Nature, 2020 to 2030
Figure 38: Latin America Yellow Pea Protein Market Y-o-Y Growth Rate by Nature, 2020 - 2030
Figure 39: Latin America Yellow Pea Protein Market Value (US$ Mn) and % Growth by End-Use, 2020 & 2030
Figure 40: Latin America Yellow Pea Protein Market Attractiveness, by End-Use, 2020 to 2030
Figure 41: Latin America Yellow Pea Protein Market Y-o-Y Growth Rate by End-Use, 2020 - 2030
Figure 42: Latin America Yellow Pea Protein Market Value (US$ Mn) and % Growth by Product Type, 2020 & 2030
Figure 43: Latin America Yellow Pea Protein Market Attractiveness, by Product Type, 2020 to 2030
Figure 44: Latin America Yellow Pea Protein Market Y-o-Y Growth Rate by Product Type, 2020 - 2030
Figure 45: Latin America Yellow Pea Protein Market Value (US$ Mn) and % Growth by Processing Type, 2020 & 2030
Figure 46: Latin America Yellow Pea Protein Market Attractiveness, by Processing Type, 2020 to 2030
Figure 47: Latin America Yellow Pea Protein Market Y-o-Y Growth Rate by Processing Type, 2020 - 2030
Figure 48: Europe Yellow Pea Protein Market Value (US$ Mn) and % Growth by Country, 2020 & 2030
Figure 49: Europe Yellow Pea Protein Market Attractiveness, by Country, 2020 to 2030
Figure 50: Europe Yellow Pea Protein Market Y-o-Y Growth Rate by Country, 2020 - 2030
Figure 51: Europe Yellow Pea Protein Market Value (US$ Mn) and % Growth by Nature, 2020 & 2030
Figure 52: Europe Yellow Pea Protein Market Attractiveness, by Nature, 2020 to 2030
Figure 53: Europe Yellow Pea Protein Market Y-o-Y Growth Rate by Nature, 2020 - 2030
Figure 54: Europe Yellow Pea Protein Market Value (US$ Mn) and % Growth by End-Use, 2020 & 2030
Figure 55: Europe Yellow Pea Protein Market Attractiveness, by End-Use, 2020 to 2030
Figure 56: Europe Yellow Pea Protein Market Y-o-Y Growth Rate by End-Use, 2020 - 2030
Figure 57: Europe Yellow Pea Protein Market Value (US$ Mn) and % Growth by Product Type, 2020 & 2030
Figure 58: Europe Yellow Pea Protein Market Attractiveness, by Product Type, 2020 to 2030
Figure 59: Europe Yellow Pea Protein Market Y-o-Y Growth Rate by Product Type, 2020 - 2030
Figure 60: Europe Yellow Pea Protein Market Value (US$ Mn) and % Growth by Processing Type, 2020 & 2030
Figure 61: Europe Yellow Pea Protein Market Attractiveness, by Processing Type, 2020 to 2030
Figure 62: Europe Yellow Pea Protein Market Y-o-Y Growth Rate by Processing Type, 2020 - 2030
Figure 63: East Asia Yellow Pea Protein Market Value (US$ Mn) and % Growth by Country, 2020 & 2030
Figure 64: East Asia Yellow Pea Protein Market Attractiveness, by Country, 2020 to 2030
Figure 65: East Asia Yellow Pea Protein Market Y-o-Y Growth Rate by Country, 2020 - 2030
Figure 66: East Asia Yellow Pea Protein Market Value (US$ Mn) and % Growth by Nature, 2020 & 2030
Figure 67: East Asia Yellow Pea Protein Market Attractiveness, by Nature, 2020 to 2030
Figure 68: East Asia Yellow Pea Protein Market Y-o-Y Growth Rate by Nature, 2020 - 2030
Figure 69: East Asia Yellow Pea Protein Market Value (US$ Mn) and % Growth by End-Use, 2020 & 2030
Figure 70: East Asia Yellow Pea Protein Market Attractiveness, by End-Use, 2020 to 2030
Figure 71: East Asia Yellow Pea Protein Market Y-o-Y Growth Rate by End-Use, 2020 - 2030
Figure 72: East Asia Yellow Pea Protein Market Value (US$ Mn) and % Growth by Product Type, 2020 & 2030
Figure 73: East Asia Yellow Pea Protein Market Attractiveness, by Product Type, 2020 to 2030
Figure 74: East Asia Yellow Pea Protein Market Y-o-Y Growth Rate by Product Type, 2020 - 2030
Figure 75: East Asia Yellow Pea Protein Market Value (US$ Mn) and % Growth by Processing Type, 2020 & 2030
Figure 76: East Asia Yellow Pea Protein Market Attractiveness, by Processing Type, 2020 to 2030
Figure 77: East Asia Yellow Pea Protein Market Y-o-Y Growth Rate by Processing Type, 2020 - 2030
Figure 78: South Asia Yellow Pea Protein Market Value (US$ Mn) and % Growth by Country, 2020 & 2030
Figure 79: South Asia Yellow Pea Protein Market Attractiveness, by Country, 2020 to 2030
Figure 80: South Asia Yellow Pea Protein Market Y-o-Y Growth Rate by Country, 2020 - 2030
Figure 81: South Asia Yellow Pea Protein Market Value (US$ Mn) and % Growth by Nature, 2020 & 2030
Figure 82: South Asia Yellow Pea Protein Market Attractiveness, by Nature, 2020 to 2030
Figure 83: South Asia Yellow Pea Protein Market Y-o-Y Growth Rate by Nature, 2020 - 2030
Figure 84: South Asia Yellow Pea Protein Market Value (US$ Mn) and % Growth by End-Use, 2020 & 2030
Figure 85: South Asia Yellow Pea Protein Market Attractiveness, by End-Use, 2020 to 2030
Figure 86: South Asia Yellow Pea Protein Market Y-o-Y Growth Rate by End-Use, 2020 - 2030
Figure 87: South Asia Yellow Pea Protein Market Value (US$ Mn) and % Growth by Product Type, 2020 & 2030
Figure 88: South Asia Yellow Pea Protein Market Attractiveness, by Product Type, 2020 to 2030
Figure 89: South Asia Yellow Pea Protein Market Y-o-Y Growth Rate by Product Type, 2020 - 2030
Figure 90: South Asia Yellow Pea Protein Market Value (US$ Mn) and % Growth by Processing Type, 2020 & 2030
Figure 91: South Asia Yellow Pea Protein Market Attractiveness, by Processing Type, 2020 to 2030
Figure 92: South Asia Yellow Pea Protein Market Y-o-Y Growth Rate by Processing Type, 2020 - 2030
Figure 93: Oceania Yellow Pea Protein Market Value (US$ Mn) and % Growth by Country, 2020 & 2030
Figure 94: Oceania Yellow Pea Protein Market Attractiveness, by Country, 2020 to 2030
Figure 95: Oceania Yellow Pea Protein Market Y-o-Y Growth Rate by Country, 2020 - 2030
Figure 96: Oceania Yellow Pea Protein Market Value (US$ Mn) and % Growth by Nature, 2020 & 2030
Figure 97: Oceania Yellow Pea Protein Market Attractiveness, by Nature, 2020 to 2030
Figure 98: Oceania Yellow Pea Protein Market Y-o-Y Growth Rate by Nature, 2020 - 2030
Figure 99: Oceania Yellow Pea Protein Market Value (US$ Mn) and % Growth by End-Use, 2020 & 2030
Figure 100: Oceania Yellow Pea Protein Market Attractiveness, by End-Use, 2020 to 2030
Figure 101: Oceania Yellow Pea Protein Market Y-o-Y Growth Rate by End-Use, 2020 - 2030
Figure 102: Oceania Yellow Pea Protein Market Value (US$ Mn) and % Growth by Product Type, 2020 & 2030
Figure 103: Oceania Yellow Pea Protein Market Attractiveness, by Product Type, 2020 to 2030
Figure 104: Oceania Yellow Pea Protein Market Y-o-Y Growth Rate by Product Type, 2020 - 2030
Figure 105: Oceania Yellow Pea Protein Market Value (US$ Mn) and % Growth by Processing Type, 2020 & 2030
Figure 106: Oceania Yellow Pea Protein Market Attractiveness, by Processing Type, 2020 to 2030
Figure 107: Oceania Yellow Pea Protein Market Y-o-Y Growth Rate by Processing Type, 2020 - 2030
Figure 108: Middle East & Africa Yellow Pea Protein Market Value (US$ Mn) and % Growth by Country, 2020 & 2030
Figure 109: Middle East & Africa Yellow Pea Protein Market Attractiveness, by Country, 2020 to 2030
Figure 110: Middle East & Africa Yellow Pea Protein Market Y-o-Y Growth Rate by Country, 2020 - 2030
Figure 111: Middle East & Africa Yellow Pea Protein Market Value (US$ Mn) and % Growth by Nature, 2020 & 2030
Figure 112: Middle East & Africa Yellow Pea Protein Market Attractiveness, by Nature, 2020 to 2030
Figure 113: Middle East & Africa Yellow Pea Protein Market Y-o-Y Growth Rate by Nature, 2020 - 2030
Figure 114: Middle East & Africa Yellow Pea Protein Market Value (US$ Mn) and % Growth by End-Use, 2020 & 2030
Figure 115: Middle East & Africa Yellow Pea Protein Market Attractiveness, by End-Use, 2020 to 2030
Figure 116: Middle East & Africa Yellow Pea Protein Market Y-o-Y Growth Rate by End-Use, 2020 - 2030
Figure 117: Middle East & Africa Yellow Pea Protein Market Value (US$ Mn) and % Growth by Product Type, 2020 & 2030
Figure 118: Middle East & Africa Yellow Pea Protein Market Attractiveness, by Product Type, 2020 to 2030
Figure 119: Middle East & Africa Yellow Pea Protein Market Y-o-Y Growth Rate by Product Type, 2020 - 2030
Figure 120: Middle East & Africa Yellow Pea Protein Market Value (US$ Mn) and % Growth by Processing Type, 2020 & 2030
Figure 121: Middle East & Africa Yellow Pea Protein Market Attractiveness, by Processing Type, 2020 to 2030
Figure 122: Middle East & Africa Yellow Pea Protein Market Y-o-Y Growth Rate by Processing Type, 2020 – 2030
Copyright © Transparency Market Research, Inc. All Rights reserved
Trust Online

Yellow Pea Protein Market