
Reports
Reports
Advantages of waterproof and weatherproof labels are that they are resistant to abrasion and are unaffected by changing climate as well. Further, they also bring about easy tracking, which in turn, makes it easier to handle massive amounts of goods being transferred from one place to another.
Because of so many unique perceived benefits, waterproof and weatherproof labels, which were used mainly for labelling chemical and hazardous products, are now finding applications in the food and beverages, consumer goods, and pharmaceutical industry as well. This is primarily because of their durability which helps to improve the visibility of the brand logo and name of the company.
A trend in the global waterproof and weatherproof labels market that is gaining traction is the use of foil on account of their ability to prevent moisture from entering and bringing down effects of other environmental conditions.
Proving counterproductive to the global market for waterproof and weatherproof labels, on the flipside, is the rising use of surface printing, as it does away with the need for labels altogether.
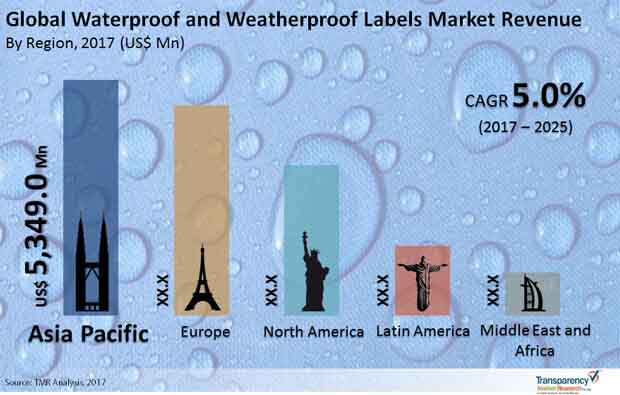
As per a study by Transparency Market Research, the global market for waterproof and weatherproof labels will likely rise at a steady CAGR of 5.0% from 2017 to 2025. At this pace, the market is slated to become worth US$23 billion by 2025 from US$16.09 billion in 2017.
Depending upon end use, the main segments of the global waterproof and weatherproof labels market are the food and beverage, cosmetics and personal care, pharmaceuticals, automotive and mechanical parts packaging, chemicals, etc. Of them, the segment of food is slated to account for around 30.0% share in the overall market in the years to come.
The segment of beverage trails the food segment in terms of market share. By the end of 2025, the revenue in the region will likely become US$4.8 billion.
Depending upon the printing technology, the global waterproof and weatherproof labels market can be divided into thermal printed labels, digital printed labels, lithographic printed labels, and flexographic printed labels, and flexographic printed labels. The segment of digital printing, among them, is projected to hold around a quarter of the share in the waterproof and weatherproof labels market and register a CAGR of 5.2% between 2017 and 2025.
From a geographic standpoint, Asia Pacific leads the global waterproof and weatherproof labels market. In the years ahead too, the region is slated to maintain its dominant position by registering maximum CAGR of 6.6%. The market is being driven mainly by China, which has a massive manufacturing sector. The explosive growth in modern retail outlets and the food industry in India and the rest of the region is also serving to underpin the growth in the market.
North America is another key market for waterproof and weatherproof labels. The region is slated to see moderate growth in the upcoming years. The Middle East and Africa offer lucrative opportunities in the market as well, and will likely clock an impressive CAGR of 6.4% during the period from 2017 to 2025.
Some of the prominent participants in the global waterproof and weatherproof labels market are Avery Dennison Corporation, Lintec Corporation, Bemis Company, Inc., UPM Raflatac Ltd, 3M Company, Herma Gmbh, Fuji Seal International, INC., PMC Label, Robos GmbH & Co. KG, Ahlstrom-Munksjö, LabTAG.com., Brady Worldwide, Inc., NFI Corp, Advanced Barcode & Label Technologies, Inc., Weber Packaging Solutions, Inc., and SYMBIO, INC.
Waterproof and Weatherproof Label Market to Gain Impetus from Food and Beverage Sector’s Demand
The increasing demand for water resistance labels from the food and beverage and pharmaceutical industries stands as a key factor promoting the growth of the global waterproof and weatherproof label market. These labels are resistant to climatic changes as well and helps to contain the authenticity of the product sealed, thereby making handling easy. This, coupled with the other additional benefits such as easy tracking facility that further helps to ease the management of goods in enormous amounts for transportation are likely to aid in expansion of the market in the coming years.
A pattern in the worldwide waterproof and weatherproof names market that is acquiring footing is the utilization of foil because of their damp-proof nature that resists leakage from entering and cutting down impacts of other natural conditions. On the flipside, the rising utilization of surface printing may pose as a major challenge to the growth of this market as surface printing helps to get rid of the requirement for names through and through, unlike their waterproof and weatherproof counterparts.
Waterproof and weatherproof labels were utilized mostly for marking substance and unsafe items earlier, and are presently discovering applications in the food and drinks, customer merchandise, and drug ventures also. This is basically a result of their toughness that assists with improving the perceivability of the brand logo and name of the organization. Thus, the increasing demand from these consumer goods, packaging, and pharmaceutical industries are further expected to boost the growth of the global waterproof and weatherproof market in the years to come.
Geographically, the global market for weatherproof and waterproof labels is dominated by Asia Pacific with major contributions from China, This is owing to the presence of major manufacturing units and the rapid growth of the retail industry in emerging nations such as India, and China. On the other side, the market in North America is expected to witness notable growth in the following years, followed by the Middle East and Africa that may witness lucrative growth opportunities from the expanding food and beverage industry.
1. Executive Summary
2. Market Introduction
2.1. Market Definition
2.2. Market Taxonomy
2.3. Market Overview
3. Waterproof & Weatherproof Labels Market Overview
3.1. Introduction
3.2. Industry Trends and Recent Developments
3.2.1. Design Level Trends and Market Developments
3.2.2. Technology Level Trends and Market Developments
3.2.3. Business Level Trends and Market Developments
3.3. Waterproof & Weatherproof Labels Market and Y-o-Y Growth
3.4. Waterproof & Weatherproof Labels Market (US$ Mn) and Forecast
3.5. Waterproof & Weatherproof Labels Market Value Chain Analysis
3.5.1. Profitability Margins
3.5.2. List of Active Participants
3.5.2.1. Raw Material Suppliers
3.5.2.2. Manufacturers
4. Waterproof & Weatherproof Labels Market Analysis
4.1. Pricing Analysis
4.1.1. Pricing Assumption
4.1.2. Price Projections By Region
4.2. Market Size (US$ Mn) and Forecast
4.2.1. Market Size and Y-o-Y Growth
4.2.2. Absolute $ Opportunity
5. Waterproof & Weatherproof Labels Market Dynamics
5.1. Macro-economic Factors
5.2. Drivers
5.2.1. Supply Side
5.2.2. Demand Side
5.3. Restraints
5.4. Opportunity
6. Global Waterproof & Weatherproof Labels Market Analysis and Forecast, By Product Type
6.1. Introduction
6.1.1. Market share and Basis Points (BPS) Analysis By Product Type
6.1.2. Y-o-Y Growth Projections By Product Type
6.2. Market Size (US$ Mn) and Volume (Tonnes) Forecast, By Product Type
6.2.1. Non-Adhesive
6.2.1.1. Glue Applied Label
6.2.1.2. In-Mold Label
6.2.1.3. Sleeve Label
6.2.2. Adhesive
6.2.2.1. Permanent
6.2.2.2. Removable
6.3. Market Attractiveness Analysis By Product Type
6.4. Prominent Trends
7. Global Waterproof & Weatherproof Labels Market Analysis and Forecast, By Material Type
7.1. Introduction
7.1.1. Market share and Basis Points (BPS) Analysis By Material Type
7.1.2. Y-o-Y Growth Projections By Material Type
7.2. Market Size (US$ Mn) and Volume (Tonnes) Forecast, By Material Type
7.2.1. Specialty Papers
7.2.2. Foil
7.2.3. Plastics
7.2.3.1. Polypropylene (PP)
7.2.3.2. Polyethylene (PE)
7.2.3.3. Polystyrene (PS)
7.2.3.4. Polycarbonate (PC)
7.2.3.5. Polymethyl Methacrylate (PMMA)
7.2.3.6. Others
7.3. Market Attractiveness Analysis By Material Type
7.4. Prominent Trends
8. Global Waterproof & Weatherproof Labels Market Analysis and Forecast, By Printing Technology
8.1. Market Size (US$ Mn) and Volume (Tonnes) Forecast By Printing Technology
8.1.1. Digital Printed Labels
8.1.2. Thermal Printed Labels
8.1.3. Lithographic Printed Labels
8.1.4. Flexographic Printed Labels
8.2. Market Attractiveness Analysis By Printing Technology
8.3. Prominent Trends
9. Global Waterproof & Weatherproof Labels Market Analysis and Forecast, By End Use Industry
9.1. Introduction
9.1.1. Market share and Basis Points (BPS) Analysis By End Use Industry
9.1.2. Y-o-Y Growth Projections By Application
9.2. Market Size (US$ Mn) and Volume (Tonnes) Forecast By End Use Industry
9.2.1. Food
9.2.2. Beverages
9.2.3. Pharmaceutical
9.2.4. Cosmetics & Personal Care
9.2.5. Chemical
9.2.6. Automotive & Mechanical Parts Packaging
9.2.7. Others (PET, etc.)
9.3. Market Attractiveness Analysis By End Use Industry
9.4. Prominent Trends
10. Global Waterproof & Weatherproof Labels Market Analysis and Forecast, By Region
10.1. Introduction
10.1.1. Market share and Basis Points (BPS) Analysis By Region
10.1.2. Y-o-Y Growth Projections By Region
10.2. Market Size (US$ Mn) and Volume (Tonnes) Forecast By Region
10.2.1. North America
10.2.2. Europe
10.2.3. Asia Pacific
10.2.4. Latin America
10.2.5. Middle East and Africa (MEA)
10.3. Market Attractiveness Analysis By Region
10.4. Prominent Trends
11. North America Waterproof & Weatherproof Labels Market Analysis and Forecast
11.1. Introduction
11.1.1. Market share and Basis Points (BPS) Analysis By Country
11.1.2. Y-o-Y Growth Projections By Country
11.2. Market Size (US$ Mn) and Volume (Tonnes) Forecast By Country
11.2.1. U.S.
11.2.2. Canada
11.3. Market Size (US$ Mn) and Volume (Tonnes) Forecast, By Product Type
11.3.1. Non-Adhesive
11.3.2. Non-Adhesive
11.3.2.1. Glue Applied Label
11.3.2.2. In-Mold Label
11.3.2.3. Sleeve Label
11.3.3. Adhesive
11.3.3.1. Permanent
11.3.3.2. Removable
11.4. Market Size (US$ Mn) and Volume (Tonnes) Forecast, By Material Type
11.4.1. Specialty Papers
11.4.2. Foil
11.4.3. Plastics
11.4.3.1. Polypropylene (PP)
11.4.3.2. Polyethylene (PE)
11.4.3.3. Polystyrene (PS)
11.4.3.4. Polycarbonate (PC)
11.4.3.5. Polymethyl Methacrylate (PMMA)
11.4.3.6. Others
11.5. Market Size (US$ Mn) and Volume (Tonnes) Forecast By Printing Technology
11.5.1. Digital Printed Labels
11.5.2. Thermal Printed Labels
11.5.3. Lithographic Printed Labels
11.5.4. Flexographic Printed Labels
11.6. Market Size (US$ Mn) and Volume (Tonnes) Forecast By End Use Industry
11.6.1. Food
11.6.2. Beverages
11.6.3. Pharmaceutical
11.6.4. Cosmetics & Personal Care
11.6.5. Chemical
11.6.6. Automotive & Mechanical Parts Packaging
11.6.7. Others (PET, etc.)
11.7. Analysis
11.7.1. By Country
11.7.2. By Product Type
11.7.3. By Material Type
11.7.4. By Printing Technology
11.7.5. By End Use Industry
11.8. Prominent Trends
11.9. Drivers and Restraints: Impact Analysis
12. Europe Waterproof & Weatherproof Labels Market Analysis and Forecast
12.1. Introduction
12.1.1. Market share and Basis Points (BPS) Analysis By Country
12.1.2. Y-o-Y Growth Projections By Country
12.2. Market Size (US$ Mn) and Volume (Tonnes) Forecast By Country
12.2.1. Germany
12.2.2. Spain
12.2.3. Italy
12.2.4. France
12.2.5. U.K.
12.2.6. BENELUX
12.2.7. Russia
12.2.8. Rest of Europe
12.3. Market Size (US$ Mn) and Volume (Tonnes) Forecast, By Product Type
12.3.1. Non-Adhesive
12.3.2. Non-Adhesive
12.3.2.1. Glue Applied Label
12.3.2.2. In-Mold Label
12.3.2.3. Sleeve Label
12.3.3. Adhesive
12.3.3.1. Permanent
12.3.3.2. Removable
12.4. Market Size (US$ Mn) and Volume (Tonnes) Forecast, By Material Type
12.4.1. Specialty Papers
12.4.2. Foil
12.4.3. Plastics
12.4.3.1. Polypropylene (PP)
12.4.3.2. Polyethylene (PE)
12.4.3.3. Polystyrene (PS)
12.4.3.4. Polycarbonate (PC)
12.4.3.5. Polymethyl Methacrylate (PMMA)
12.4.3.6. Others
12.5. Market Size (US$ Mn) and Volume (Tonnes) Forecast By Printing Technology
12.5.1. Digital Printed Labels
12.5.2. Thermal Printed Labels
12.5.3. Lithographic Printed Labels
12.5.4. Flexographic Printed Labels
12.6. Market Size (US$ Mn) and Volume (Tonnes) Forecast By End Use Industry
12.6.1. Food
12.6.2. Beverages
12.6.3. Pharmaceutical
12.6.4. Cosmetics & Personal Care
12.6.5. Chemical
12.6.6. Automotive & Mechanical Parts Packaging
12.6.7. Others (PET, etc.)
12.7. Analysis
12.7.1. By Country
12.7.2. By Product Type
12.7.3. By Material Type
12.7.4. By Printing Technology
12.7.5. By End Use Industry
12.8. Prominent Trends
12.9. Drivers and Restraints: Impact Analysis
13. Asia Pacific Waterproof & Weatherproof Labels Market Analysis and Forecast
13.1. Introduction
13.1.1. Market share and Basis Points (BPS) Analysis By Country
13.1.2. Y-o-Y Growth Projections By Country
13.2. Market Size (US$ Mn) and Volume (Tonnes) Forecast By Country
13.2.1. China
13.2.2. India
13.2.3. Japan
13.2.4. ASEAN
13.2.5. Australia and New Zealand
13.2.6. Rest of APAC
13.3. Market Size (US$ Mn) and Volume (Tonnes) Forecast, By Product Type
13.3.1. Non-Adhesive
13.3.2. Non-Adhesive
13.3.2.1. Glue Applied Label
13.3.2.2. In-Mold Label
13.3.2.3. Sleeve Label
13.3.3. Adhesive
13.3.3.1. Permanent
13.3.3.2. Removable
13.4. Market Size (US$ Mn) and Volume (Tonnes) Forecast, By Material Type
13.4.1. Specialty Papers
13.4.2. Foil
13.4.3. Plastics
13.4.3.1. Polypropylene (PP)
13.4.3.2. Polyethylene (PE)
13.4.3.3. Polystyrene (PS)
13.4.3.4. Polycarbonate (PC)
13.4.3.5. Polymethyl Methacrylate (PMMA)
13.4.3.6. Others
13.5. Market Size (US$ Mn) and Volume (Tonnes) Forecast By Printing Technology
13.5.1. Digital Printed Labels
13.5.2. Thermal Printed Labels
13.5.3. Lithographic Printed Labels
13.5.4. Flexographic Printed Labels
13.6. Market Size (US$ Mn) and Volume (Tonnes) Forecast By End Use Industry
13.6.1. Food
13.6.2. Beverages
13.6.3. Pharmaceutical
13.6.4. Cosmetics & Personal Care
13.6.5. Chemical
13.6.6. Automotive & Mechanical Parts Packaging
13.6.7. Others (PET, etc.)
13.7. Analysis
13.7.1. By Country
13.7.2. By Product Type
13.7.3. By Material Type
13.7.4. By Printing Technology
13.7.5. By End Use Industry
13.8. Prominent Trends
13.9. Drivers and Restraints: Impact Analysis
14. Latin America Waterproof & Weatherproof Labels Market Analysis and Forecast
14.1. Introduction
14.1.1. Market share and Basis Points (BPS) Analysis By Country
14.1.2. Y-o-Y Growth Projections By Country
14.2. Market Size (US$ Mn) and Volume (Tonnes) Forecast By Country
14.2.1. Brazil
14.2.2. Mexico
14.2.3. Rest of Latin America
14.3. Market Size (US$ Mn) and Volume (Tonnes) Forecast, By Product Type
14.3.1. Non-Adhesive
14.3.2. Non-Adhesive
14.3.2.1. Glue Applied Label
14.3.2.2. In-Mold Label
14.3.2.3. Sleeve Label
14.3.3. Adhesive
14.3.3.1. Permanent
14.3.3.2. Removable
14.4. Market Size (US$ Mn) and Volume (Tonnes) Forecast, By Material Type
14.4.1. Specialty Papers
14.4.2. Foil
14.4.3. Plastics
14.4.3.1. Polypropylene (PP)
14.4.3.2. Polyethylene (PE)
14.4.3.3. Polystyrene (PS)
14.4.3.4. Polycarbonate (PC)
14.4.3.5. Polymethyl Methacrylate (PMMA)
14.4.3.6. Others
14.5. Market Size (US$ Mn) and Volume (Tonnes) Forecast By Printing Technology
14.5.1. Digital Printed Labels
14.5.2. Thermal Printed Labels
14.5.3. Lithographic Printed Labels
14.5.4. Flexographic Printed Labels
14.6. Market Size (US$ Mn) and Volume (Tonnes) Forecast By End Use Industry
14.6.1. Food
14.6.2. Beverages
14.6.3. Pharmaceutical
14.6.4. Cosmetics & Personal Care
14.6.5. Chemical
14.6.6. Automotive & Mechanical Parts Packaging
14.6.7. Others (PET, etc.)
14.7. Analysis
14.7.1. By Country
14.7.2. By Product Type
14.7.3. By Material Type
14.7.4. By Printing Technology
14.7.5. By End Use Industry
14.8. Prominent Trends
14.9. Drivers and Restraints: Impact Analysis
15. Middle East and Africa Waterproof & Weatherproof Labels Market Analysis and Forecast
15.1. Introduction
15.1.1. Market share and Basis Points (BPS) Analysis By Country
15.1.2. Y-o-Y Growth Projections By Country
15.2. Market Size (US$ Mn) and Volume (Tonnes) Forecast By Country
15.2.1. North Africa
15.2.2. South Africa
15.2.3. GCC countries
15.2.4. Rest of MEA
15.3. Market Size (US$ Mn) and Volume (Tonnes) Forecast, By Product Type
15.3.1. Non-Adhesive
15.3.2. Non-Adhesive
15.3.2.1. Glue Applied Label
15.3.2.2. In-Mold Label
15.3.2.3. Sleeve Label
15.3.3. Adhesive
15.3.3.1. Permanent
15.3.3.2. Removable
15.4. Market Size (US$ Mn) and Volume (Tonnes) Forecast, By Material Type
15.4.1. Specialty Papers
15.4.2. Foil
15.4.3. Plastics
15.4.3.1. Polypropylene (PP)
15.4.3.2. Polyethylene (PE)
15.4.3.3. Polystyrene (PS)
15.4.3.4. Polycarbonate (PC)
15.4.3.5. Polymethyl Methacrylate (PMMA)
15.4.3.6. Others
15.5. Market Size (US$ Mn) and Volume (Tonnes) Forecast By Printing Technology
15.5.1. Digital Printed Labels
15.5.2. Thermal Printed Labels
15.5.3. Lithographic Printed Labels
15.5.4. Flexographic Printed Labels
15.6. Market Size (US$ Mn) and Volume (Tonnes) Forecast By End Use Industry
15.6.1. Food
15.6.2. Beverages
15.6.3. Pharmaceutical
15.6.4. Cosmetics & Personal Care
15.6.5. Chemical
15.6.6. Automotive & Mechanical Parts Packaging
15.6.7. Others (PET, etc.)
15.7. Analysis
15.7.1. By Country
15.7.2. By Product Type
15.7.3. By Material Type
15.7.4. By Printing Technology
15.7.5. By End Use Industry
15.8. Prominent Trends
15.9. Drivers and Restraints: Impact Analysis
16. Competitive Landscape
16.1. Competition Dashboard
16.2. Company Market Share Analysis
16.3. Company Profiles (Details – Overview, Financials, Strategy, Recent Developments, SWOT analysis)
16.4. Global Players
16.4.1. AVERY DENNISON CORPORATION.
16.4.1.1. Company Overview
16.4.1.2. Product Offerings
16.4.1.3. Key Financials
16.4.1.4. Developments
16.4.1.5. SWOT Analysis
16.4.1.6. Strategy
16.4.2. Lintec Corporation
16.4.2.1. Company Overview
16.4.2.2. Product Offerings
16.4.2.3. Key Financials
16.4.2.4. Developments
16.4.2.5. SWOT Analysis
16.4.2.6. Strategy
16.4.3. Bemis Company, Inc.
16.4.3.1. Company Overview
16.4.3.2. Product Offerings
16.4.3.3. Key Financials
16.4.3.4. Developments
16.4.3.5. SWOT Analysis
16.4.3.6. Strategy
16.4.4. UPM Raflatac Ltd
16.4.4.1. Company Overview
16.4.4.2. Product Offerings
16.4.4.3. Key Financials
16.4.4.4. Developments
16.4.4.5. SWOT Analysis
16.4.4.6. Strategy
16.4.5. 3M Company
16.4.5.1. Company Overview
16.4.5.2. Product Offerings
16.4.5.3. Key Financials
16.4.5.4. Developments
16.4.5.5. SWOT Analysis
16.4.5.6. Strategy
16.4.6. CCL Label Inc.
16.4.6.1. Company Overview
16.4.6.2. Product Offerings
16.4.6.3. Key Financials
16.4.6.4. Developments
16.4.6.5. SWOT Analysis
16.4.6.6. Strategy
16.4.7. WS Packaging Group, Inc.
16.4.7.1. Company Overview
16.4.7.2. Product Offerings
16.4.7.3. Key Financials
16.4.7.4. Developments
16.4.7.5. SWOT Analysis
16.4.7.6. Strategy
16.4.8. Herma Gmbh
16.4.8.1. Company Overview
16.4.8.2. Product Offerings
16.4.8.3. Key Financials
16.4.8.4. Developments
16.4.8.5. SWOT Analysis
16.4.8.6. Strategy
16.4.9. Fuji Seal International, INC.
16.4.9.1. Company Overview
16.4.9.2. Product Offerings
16.4.9.3. Key Financials
16.4.9.4. Developments
16.4.9.5. SWOT Analysis
16.4.9.6. Strategy
16.4.10. PMC Label
16.4.10.1. Company Overview
16.4.10.2. Product Offerings
16.4.10.3. Key Financials
16.4.10.4. Developments
16.4.10.5. SWOT Analysis
16.4.10.6. Strategy
16.4.11. Robos GmbH & Co. KG
16.4.11.1. Company Overview
16.4.11.2. Product Offerings
16.4.11.3. Key Financials
16.4.11.4. Developments
16.4.11.5. SWOT Analysis
16.4.11.6. Strategy
16.4.12. Ahlstrom-Munksjö
16.4.12.1. Company Overview
16.4.12.2. Product Offerings
16.4.12.3. Key Financials
16.4.12.4. Developments
16.4.12.5. SWOT Analysis
16.4.12.6. Strategy
16.4.13. LabTAG.com.
16.4.13.1. Company Overview
16.4.13.2. Product Offerings
16.4.13.3. Key Financials
16.4.13.4. Developments
16.4.13.5. SWOT Analysis
16.4.13.6. Strategy
16.4.14. Brady Worldwide, Inc.
16.4.14.1. Company Overview
16.4.14.2. Product Offerings
16.4.14.3. Key Financials
16.4.14.4. Developments
16.4.14.5. SWOT Analysis
16.4.14.6. Strategy
16.4.15. NFI Corp
16.4.15.1. Company Overview
16.4.15.2. Product Offerings
16.4.15.3. Key Financials
16.4.15.4. Developments
16.4.15.5. SWOT Analysis
16.4.15.6. Strategy
16.4.16. ZIH Corp
16.4.16.1. Company Overview
16.4.16.2. Product Offerings
16.4.16.3. Key Financials
16.4.16.4. Developments
16.4.16.5. SWOT Analysis
16.4.16.6. Strategy
16.4.17. Advanced Barcode & Label Technologies, Inc.
16.4.17.1. Company Overview
16.4.17.2. Product Offerings
16.4.17.3. Key Financials
16.4.17.4. Developments
16.4.17.5. SWOT Analysis
16.4.17.6. Strategy
16.4.18. Weber Packaging Solutions, Inc.
16.4.18.1. Company Overview
16.4.18.2. Product Offerings
16.4.18.3. Key Financials
16.4.18.4. Developments
16.4.18.5. SWOT Analysis
16.4.18.6. Strategy
16.4.19. Thai KK
16.4.19.1. Company Overview
16.4.19.2. Product Offerings
16.4.19.3. Key Financials
16.4.19.4. Developments
16.4.19.5. SWOT Analysis
16.4.19.6. Strategy
16.4.20. SYMBIO, INC
16.4.20.1. Company Overview
16.4.20.2. Product Offerings
16.4.20.3. Key Financials
16.4.20.4. Developments
16.4.20.5. SWOT Analysis
16.4.20.6. Strategy
17. Assumptions and Acronyms Used
18. Research Methodology
List of Tables
Table 01: Global Waterproof& Weatherproof Labels Market Value (US$ Mn) and Volume (Sq.M) 2016–2025, By Product Type
Table 02: Global Waterproof& Weatherproof Labels Market Value (US$ Mn) and Volume (Sq.M) 2016–2025, By Material Type
Table 03: Global Waterproof& Weatherproof Labels Market Value (US$ Mn) and Volume (Sq.M) 2016–2025, By Printing Technology Type
Table 04: Global Waterproof& Weatherproof Labels Market Value (US$ Mn) and Volume (Sq.M) 2016–2025, By End Use Industry
Table 05: Global Waterproof& Weatherproof Labels Market Value (US$ Mn) and Volume (Sq.M) 2016–2025, By Region
Table 06: North America Waterproof& Weatherproof Labels Market Value (US$ Mn) and Volume (Sq.M) 2016–2025, By Country
Table 07: North America Waterproof& Weatherproof Labels Market Value (US$ Mn) and Volume (Sq.M) 2016–2025, By Product Type
Table 08: North America Waterproof& Weatherproof Labels Market Value (US$ Mn) and Volume (Sq.M) 2016–2025, By Material Type
Table 09: North America Waterproof& Weatherproof Labels Market Value (US$ Mn) and Volume (Sq.M) 2016–2025, By Printing Technology Type
Table 10: North America Waterproof& Weatherproof Labels Market Value (US$ Mn) and Volume (Sq.M) 2016–2025, By End Use
Table 11: Latin America Waterproof& Weatherproof Labels Market Value (US$ Mn) and Volume (Sq.M) 2016–2025, By Country
Table 12: Latin America Waterproof& Weatherproof Labels Market Value (US$ Mn) and Volume (Sq.M) 2016–2025, By Product Type
Table 13: North America Waterproof& Weatherproof Labels Market Value (US$ Mn) and Volume (Sq.M) 2016–2025, By Material Type
Table 14: Latin America Waterproof& Weatherproof Labels Market Value (US$ Mn) and Volume (Sq.M) 2016–2025, By Printing Technology Type
Table 15: Latin America Waterproof& Weatherproof Labels Market Value (US$ Mn) and Volume (Sq.M) 2016–2025, By End Use
Table 16: North America Waterproof& Weatherproof Labels Market Value (US$ Mn) and Volume (Sq.M) 2016–2025, By Country
Table 17: Europe Waterproof& Weatherproof Labels Market Value (US$ Mn) and Volume (Sq.M) 2016–2025, By Product Type
Table 18: Europe Waterproof& Weatherproof Labels Market Value (US$ Mn) and Volume (Sq.M) 2016–2025, By Material Type
Table 19: Europe Waterproof& Weatherproof Labels Market Value (US$ Mn) and Volume (Sq.M) 2016–2025, By Printing Technology Type
Table 20: Europe Waterproof& Weatherproof Labels Market Value (US$ Mn) and Volume (Sq.M) 2016–2025, By End Use
Table 21: APAC Waterproof& Weatherproof Labels Market Value (US$ Mn) and Volume (Sq.M) 2016–2025, By Country
Table 22: APAC Waterproof& Weatherproof Labels Market Value (US$ Mn) and Volume (Sq.M) 2016–2025, By Material Type
Table 23: APAC Waterproof& Weatherproof Labels Market Value (US$ Mn) and Volume (Sq.M) 2016–2025, By Printing Technology Type
Table 24: APAC Waterproof& Weatherproof Labels Market Value (US$ Mn) and Volume (Sq.M) 2016–2025, By End Use
Table 25: MEA Waterproof& Weatherproof Labels Market Value (US$ Mn) and Volume (Sq.M) 2016–2025, By Country
Table 26: MEA Waterproof& Weatherproof Labels Market Value (US$ Mn) and Volume (Sq.M) 2016–2025, By Product Type
Table 27: MEA Waterproof& Weatherproof Labels Market Value (US$ Mn) and Volume (Sq.M) 2016–2025, By Material Type
Table 28: MEA Waterproof& Weatherproof Labels Market Value (US$ Mn) and Volume (Sq.M) 2016–2025, By Printing Technology Type
Table 29: MEA Waterproof& Weatherproof Labels Market Value (US$ Mn) and Volume (Sq.M) 2016–2025, By End Use
List of Figures
Figure 01: Global Waterproof & Weatherproof Labels Value Share, by Product Type, 2017
Figure 02: Global Waterproof & Weatherproof Labels Value Share, by Material Type, 2017
Figure 03: Global Waterproof & Weatherproof Labels Value Share, by Printing Technology Type, 2017
Figure 04: Global Waterproof & Weatherproof Labels Value Share, by End Use Industry, 2017
Figure 05: Global Waterproof & Weatherproof Labels Market Value (US$ Mn) and Volume (Sq.M) 2016-2025
Figure 06: Global Waterproof & Weatherproof Labels Market Absolute $ Opportunity, 2017-2025
Figure 07: Global Waterproof & Weatherproof Labels Market Share and BPS Analysis, By Product Type, 2017 & 2025
Figure 08: Global Waterproof & Weatherproof Labels Market Y-o-Y Growth, By Product Type, 2017-2025
Figure 09: Global Waterproof & Weatherproof Labels Market Value (US$ Mn) and Volume (Sq.M),by Adhesive Based Labels 2016-2025
Figure 10: Global Waterproof & Weatherproof Labels Market Absolute $ Opportunity, by Adhesive Based Labels 2017-2025
Figure 11: Global Adhesive Based Labels Market Value (US$ Mn), 2016-2025
Figure 12: Global Adhesive Based Labels Market Volume (Sq.M), 2016-2025
Figure 13: Global Waterproof & Weatherproof Labels Market Value (US$ Mn) and Volume (Sq.M),by Non Adhesive Labels 2016-2025
Figure 14: Global Waterproof & Weatherproof Labels Market Absolute $ Opportunity, by Non Adhesive Labels 2017-2025
Figure 15: Global Non Adhesive Based Labels Market Value (US$ Mn), 2016-2025
Figure 16: Global Non Adhesive Based Labels Market Volume (Sq.M), 2016-2025
Figure 17: Global Waterproof & Weatherproof Labels Market Attractiveness Analysis By Product Type
Figure 18: Global Waterproof & Weatherproof Labels Market Share and BPS Analysis, By Material Type, 2017 & 2025
Figure 19: Global Waterproof & Weatherproof Labels Market Y-o-Y Growth, By Material Type, 2017-2025
Figure 20: Global Waterproof & Weatherproof Labels Market Value (US$ Mn) and Volume (Sq.M),by Specialty Papers 2016-2025
Figure 21: Global Waterproof & Weatherproof Labels Market Absolute $ Opportunity, by Specialty Papers 2017-2025
Figure 22: Global Waterproof & Weatherproof Labels Market Value (US$ Mn) and Volume (Sq.M),by Foil 2016-2025
Figure 23: Global Waterproof & Weatherproof Labels Market Absolute $ Opportunity, by Foil 2017-2025
Figure 24: Global Waterproof & Weatherproof Labels Market Value (US$ Mn) and Volume (Sq.M),by Plastic 2016-2025
Figure 25: Global Waterproof & Weatherproof Labels Market Absolute $ Opportunity, by Plastic 2017-2025
Figure 26: Global Waterproof & Weatherproof Labels Market Value (US$ Mn), By Plastic Type Sub-segment 2016-2025
Figure 27: Global Waterproof & Weatherproof Labels Market Volume (Sq.M), By Plastic Type Sub-segment 2016-2025
Figure 28: Global Waterproof & Weatherproof Labels Market Attractiveness Analysis By Material Type
Figure 29: Global Waterproof & Weatherproof Labels Market Share and BPS Analysis, By Printing Technology, 2017 & 2025
Figure 30: Global Waterproof & Weatherproof Labels Market Y-o-Y Growth, By Printing Technology, 2017-2025
Figure 31: Global Waterproof & Weatherproof Labels Market Value (US$ Mn) and Volume (Sq.M),by Digital printed Labels 2016-2025
Figure 32: Global Waterproof & Weatherproof Labels Market Absolute $ Opportunity, by Digital Printed Labels 2017-2025
Figure 33: Global Waterproof & Weatherproof Labels Market Value (US$ Mn) and Volume (Sq.M),by Thermal printed Labels 2016-2025
Figure 34: Global Waterproof & Weatherproof Labels Market Absolute $ Opportunity, by Thermal Printed Labels 2017-2025
Figure 35: Global Waterproof & Weatherproof Labels Market Value (US$ Mn) and Volume (Sq.M),by Lithographic printed Labels 2016-2025
Figure 36: Global Waterproof & Weatherproof Labels Market Absolute $ Opportunity, by Lithographic Printed Labels 2017-2025
Figure 37: Global Waterproof & Weatherproof Labels Market Value (US$ Mn) and Volume (Sq.M),by Flexographic printed Labels 2016-2025
Figure 38: Global Waterproof & Weatherproof Labels Market Absolute $ Opportunity, by Flexographic Printed Labels 2017-2025
Figure 39: Global Waterproof & Weatherproof Labels Market Attractiveness Analysis By Printing Technology
Figure 40: Global Waterproof & Weatherproof Labels Market Share and BPS Analysis, By End Use Industry, 2017 & 2025
Figure 41: Global Waterproof & Weatherproof Labels Market Y-o-Y Growth, By End Use Industry, 2017-2025
Figure 42: Global Waterproof & Weatherproof Labels Market Value (US$ Mn) and Volume (Sq.M),by Food Industry 2016-2025
Figure 43: Global Waterproof & Weatherproof Labels Market Absolute $ Opportunity, by Food Industry 2017-2025
Figure 44: Global Waterproof & Weatherproof Labels Market Value (US$ Mn) and Volume (Sq.M),by Food Industry 2016-2025
Figure 45: Global Waterproof & Weatherproof Labels Market Absolute $ Opportunity, by Food Industry 2017-2025
Figure 46: Global Waterproof & Weatherproof Labels Market Value (US$ Mn) and Volume (Sq.M),by Pharmaceuticals Industry 2016-2025
Figure 47: Global Waterproof & Weatherproof Labels Market Absolute $ Opportunity, by Pharmaceuticals Industry 2017-2025
Figure 48: Global Waterproof & Weatherproof Labels Market Value (US$ Mn) and Volume (Sq.M),by Cosmetics & Personal Care Industry 2016-2025
Figure 49: Global Waterproof & Weatherproof Labels Market Absolute $ Opportunity, by Cosmetics & Personal Care Industry 2017-2025
Figure 50: Global Waterproof & Weatherproof Labels Market Value (US$ Mn) and Volume (Sq.M),by Automotive & Mechanical Parts Packaging 2016-2025
Figure 51: Global Waterproof & Weatherproof Labels Market Absolute $ Opportunity, by Automotive & Mechanical Parts Packaging 2017-2025
Figure 52: Global Waterproof & Weatherproof Labels Market Value (US$ Mn) and Volume (Sq.M),by Chemicals Industry 2016-2025
Figure 53: Global Waterproof & Weatherproof Labels Market Absolute $ Opportunity, by Chemicals Industry 2017-2025
Figure 54: Global Waterproof & Weatherproof Labels Market Value (US$ Mn) and Volume (Sq.M),by Others (Security, etc.) Industry 2016-2025
Figure 55: Global Waterproof & Weatherproof Labels Market Absolute $ Opportunity, by Others (Security, etc.) Industry 2017-2025
Figure 56: Global Waterproof & Weatherproof Labels Market Attractiveness Analysis By End Use Industry
Figure 57: Global Waterproof & Weatherproof Labels Market Share and BPS Analysis, By Region, 2017 & 2025
Figure 58: Global Waterproof & Weatherproof Labels Market Y-o-Y Growth, By Region, 2017-2025
Figure 59: Global Waterproof & Weatherproof Labels Market Attractiveness Analysis By Region
Figure 60: North America Waterproof & Weatherproof Labels Market Value (US$ Mn) and Volume (Sq.M), for year 2016-2025
Figure 61: North America Waterproof & Weatherproof Labels Market Absolute $ Opportunity, for year 2017-2025
Figure 62: North America Waterproof & Weatherproof Labels Market Share and BPS Analysis, By Country 2017 & 2025
Figure 63: North America Waterproof & Weatherproof Labels Market Y-o-Y Growth, By Country 2017-2025
Figure 64: North America Waterproof & Weatherproof Labels Market Attractiveness Analysis By Country
Figure 65: North America Waterproof & Weatherproof Labels Market Value (US$ Mn), By Product Type 2016-2025
Figure 66: North America Waterproof & Weatherproof Labels Market Volume (Sq.M), By Product Type 2016-2025
Figure 67: North America Waterproof & Weatherproof Labels Market Value (US$ Mn), By Adhesive based Sub-Segment 2016-2025
Figure 68: North America Waterproof & Weatherproof Labels Market Volume (Sq.M), By Adhesive based Sub-Segment 2016-2025
Figure 69: North America Waterproof & Weatherproof Labels Market Value (US$ Mn), By Non Adhesive based Sub-Segment 2016-2025
Figure 70: North America Waterproof & Weatherproof Labels Market Volume (Sq.M), By Non Adhesive based Sub-Segment 2016-2025
Figure 71: North America Waterproof & Weatherproof Labels Market Attractiveness Analysis By Product Type
Figure 72: North America Waterproof & Weatherproof Labels Market Value (US$ Mn), By Material type 2016-2025
Figure 73: North America Waterproof & Weatherproof Labels Market Volume (Sq.M), By Material Type 2016-2025
Figure 74: North America Waterproof & Weatherproof Labels Market Value (US$ Mn), By Plastic Sub-Segment 2016-2025
Figure 75: North America Waterproof & Weatherproof Labels Market Volume (Sq.M), By Plastic Sub-Segment 2016-2025
Figure 76: North America Waterproof & Weatherproof Labels Market Attractiveness Analysis By Material Type
Figure 77: North America Waterproof & Weatherproof Labels Market Value (US$ Mn), By Printing Technology 2016-2025
Figure 78: North America Waterproof & Weatherproof Labels Market Volume (Sq.M), By Printing Technology 2016-2025
Figure 79: North America Waterproof & Weatherproof Labels Market Attractiveness Analysis By Printing Technology
Figure 80: North America Waterproof & Weatherproof Labels Market Value (US$ Mn), By End Use Industry 2016-2025
Figure 81: North America Waterproof & Weatherproof Labels Market Volume (Sq.M), By End Use Industry 2016-2025
Figure 82: North America Waterproof & Weatherproof Labels Market Attractiveness Analysis By End Use Industry
Figure 83: Latin America Waterproof & Weatherproof Labels Market Value (US$ Mn) and Volume (Sq.M), for year 2016-2025
Figure 84: Latin America Waterproof & Weatherproof Labels Market Absolute $ Opportunity, for year 2017-2025
Figure 85: Latin America Waterproof & Weatherproof Labels Market Share and BPS Analysis, By Country 2017 & 2025
Figure 86: Latin America Waterproof & Weatherproof Labels Market Y-o-Y Growth, By Country 2017-2025
Figure 87: Latin America Waterproof & Weatherproof Labels Market Attractiveness Analysis By Country
Figure 88: Latin America Waterproof & Weatherproof Labels Market Value (US$ Mn), By Product Type 2016-2025
Figure 89: Latin America Waterproof & Weatherproof Labels Market Volume (Sq.M), By Product Type 2016-2025
Figure 90: Latin America Waterproof & Weatherproof Labels Market Value (US$ Mn), By Adhesive based Sub-Segment 2016-2025
Figure 91: Latin America Waterproof & Weatherproof Labels Market Volume (Sq.M), By Adhesive based Sub-Segment 2016-2025
Figure 92: Latin America Waterproof & Weatherproof Labels Market Value (US$ Mn), By Non Adhesive based Sub-Segment 2016-2025
Figure 93: Latin America Waterproof & Weatherproof Labels Market Volume (Sq.M), By Non Adhesive based Sub-Segment 2016-2025
Figure 94: Latin America Waterproof & Weatherproof Labels Market Attractiveness Analysis By Product Type
Figure 95: Latin America Waterproof & Weatherproof Labels Market Value (US$ Mn), By Material type 2016-2025
Figure 96: Latin America Waterproof & Weatherproof Labels Market Volume (Sq.M), By Material Type 2016-2025
Figure 97: Latin America Waterproof & Weatherproof Labels Market Value (US$ Mn), By Plastic Sub-Segment 2016-2025
Figure 98: Latin America Waterproof & Weatherproof Labels Market Volume (Sq.M), By Plastic Sub-Segment 2016-2025
Figure 99: Latin America Waterproof & Weatherproof Labels Market Attractiveness Analysis By Material Type
Figure 100: Latin America Waterproof & Weatherproof Labels Market Value (US$ Mn), By Printing Technology 2016-2025
Figure 101: Latin America Waterproof & Weatherproof Labels Market Volume (Sq.M), By Printing Technology 2016-2025
Figure 102: North America Waterproof & Weatherproof Labels Market Attractiveness Analysis By Printing Technology
Figure 103: Latin America Waterproof & Weatherproof Labels Market Value (US$ Mn), By End Use Industry 2016-2025
Figure 104: Latin America Waterproof & Weatherproof Labels Market Volume (Sq.M), By End Use Industry 2016-2025
Figure 105: Latin America Waterproof & Weatherproof Labels Market Attractiveness Analysis By End Use Industry
Figure 106: Europe Waterproof & Weatherproof Labels Market Value (US$ Mn) and Volume (Sq.M), for year 2016-2025
Figure 107: Europe Waterproof & Weatherproof Labels Market Absolute $ Opportunity, for year 2017-2025
Figure 108: Europe Waterproof & Weatherproof Labels Market Share and BPS Analysis, By Country 2017 & 2025
Figure 109: Europe Waterproof & Weatherproof Labels Market Y-o-Y Growth, By Country 2017-2025
Figure 110: Europe Waterproof & Weatherproof Labels Market Attractiveness Analysis By Country
Figure111: Europe Waterproof & Weatherproof Labels Market Value (US$ Mn), By Product Type 2016-2025
Figure 112: Europe Waterproof & Weatherproof Labels Market Volume (Sq.M), By Product Type 2016-2025
Figure 113: Europe Waterproof & Weatherproof Labels Market Value (US$ Mn), By Adhesive based Sub-Segment 2016-2025
Figure 114: Europe Waterproof & Weatherproof Labels Market Volume (Sq.M), By Adhesive based Sub-Segment 2016-2025
Figure 115: Europe Waterproof & Weatherproof Labels Market Value (US$ Mn), By Non Adhesive based Sub-Segment 2016-2025
Figure 116: Europe Waterproof & Weatherproof Labels Market Volume (Sq.M), By Non Adhesive based Sub-Segment 2016-2025
Figure 117: Europe Waterproof & Weatherproof Labels Market Attractiveness Analysis By Product Type
Figure 118: Europe Waterproof & Weatherproof Labels Market Value (US$ Mn), By Material type 2016-2025
Figure 119: Europe Waterproof & Weatherproof Labels Market Volume (Sq.M), By Material Type 2016-2025
Figure 120: Europe Waterproof & Weatherproof Labels Market Value (US$ Mn), By Plastic Sub-Segment 2016-2025
Figure 121: Europe Waterproof & Weatherproof Labels Market Volume (Sq.M), By Plastic Sub-Segment 2016-2025
Figure 122: North America Waterproof & Weatherproof Labels Market Attractiveness Analysis By Material Type
Figure 123: Europe Waterproof & Weatherproof Labels Market Value (US$ Mn), By Printing Technology 2016-2025
Figure 124: Europe Waterproof & Weatherproof Labels Market Volume (Sq.M), By Printing Technology 2016-2025
Figure 125: Europe Waterproof & Weatherproof Labels Market Attractiveness Analysis By Printing Technology
Figure 126: Europe Waterproof & Weatherproof Labels Market Value (US$ Mn), By End Use Industry 2016-2025
Figure 127: Europe Waterproof & Weatherproof Labels Market Volume (Sq.M), By End Use Industry 2016-2025
Figure 128: Europe Waterproof & Weatherproof Labels Market Attractiveness Analysis By End Use Industry
Figure 129: APAC Waterproof & Weatherproof Labels Market Value (US$ Mn) and Volume (Sq.M), for year 2016-2025
Figure 130: APAC Waterproof & Weatherproof Labels Market Absolute $ Opportunity, for year 2017-2025
Figure 131: APAC Waterproof & Weatherproof Labels Market Share and BPS Analysis, By Country 2017 & 2025
Figure 132: APAC Waterproof & Weatherproof Labels Market Y-o-Y Growth, By Country 2017-2025
Figure 133: APAC Waterproof & Weatherproof Labels Market Attractiveness Analysis By Country
Figure 134: APAC Waterproof & Weatherproof Labels Market Value (US$ Mn), By Product Type 2016-2025
Figure 135: APAC Waterproof & Weatherproof Labels Market Volume (Sq.M), By Product Type 2016-2025
Figure 136: APAC Waterproof & Weatherproof Labels Market Value (US$ Mn), By Adhesive based Sub-Segment 2016-2025
Figure 137: APAC Waterproof & Weatherproof Labels Market Volume (Sq.M), By Adhesive based Sub-Segment 2016-2025
Figure 138: APAC Waterproof & Weatherproof Labels Market Value (US$ Mn), By Non Adhesive based Sub-Segment 2016-2025
Figure 139: APAC Waterproof & Weatherproof Labels Market Volume (Sq.M), By Non Adhesive based Sub-Segment 2016-2025
Figure 140: APAC Waterproof & Weatherproof Labels Market Attractiveness Analysis By Product Type
Figure 141: APAC Waterproof & Weatherproof Labels Market Value (US$ Mn), By Material type 2016-2025
Figure 142: APAC Waterproof & Weatherproof Labels Market Volume (Sq.M), By Material Type 2016-2025
Figure 143: APAC Waterproof & Weatherproof Labels Market Value (US$ Mn), By Plastic Sub-Segment 2016-2025
Figure 144: APAC Waterproof & Weatherproof Labels Market Volume (Sq.M), By Plastic Sub-Segment 2016-2025
Figure 145: North America Waterproof & Weatherproof Labels Market Attractiveness Analysis By Material Type
Figure 146: APAC Waterproof & Weatherproof Labels Market Value (US$ Mn), By Printing Technology 2016-2025
Figure 147: APAC Waterproof & Weatherproof Labels Market Volume (Sq.M), By Printing Technology 2016-2025
Figure 148: APAC Waterproof & Weatherproof Labels Market Attractiveness Analysis By Printing Technology
Figure 149: APAC Waterproof & Weatherproof Labels Market Value (US$ Mn), By End Use Industry 2016-2025
Figure 150: APAC Waterproof & Weatherproof Labels Market Volume (Sq.M), By End Use Industry 2016-2025
Figure 151: APAC Waterproof & Weatherproof Labels Market Attractiveness Analysis By End Use Industry
Figure 152: MEA Waterproof & Weatherproof Labels Market Value (US$ Mn) and Volume (Sq.M), for year 2016-2025
Figure 153: MEA Waterproof & Weatherproof Labels Market Absolute $ Opportunity, for year 2017-2025
Figure 154: MEA Waterproof & Weatherproof Labels Market Share and BPS Analysis, By Country 2017 & 2025
Figure 155: MEA Waterproof & Weatherproof Labels Market Y-o-Y Growth, By Country 2017-2025
Figure 156: MEA Waterproof & Weatherproof Labels Market Attractiveness Analysis By Country
Figure 157: MEA Waterproof & Weatherproof Labels Market Value (US$ Mn), By Product Type 2016-2025
Figure 158: MEA Waterproof & Weatherproof Labels Market Volume (Sq.M), By Product Type 2016-2025
Figure 159: MEA Waterproof & Weatherproof Labels Market Value (US$ Mn), By Adhesive based Sub-Segment 2016-2025
Figure 160: MEA Waterproof & Weatherproof Labels Market Volume (Sq.M), By Adhesive based Sub-Segment 2016-2025
Figure 161: MEA Waterproof & Weatherproof Labels Market Value (US$ Mn), By Non Adhesive based Sub-Segment 2016-2025
Figure 162: MEA Waterproof & Weatherproof Labels Market Volume (Sq.M), By Non Adhesive based Sub-Segment 2016-2025
Figure 163: North America Waterproof & Weatherproof Labels Market Attractiveness Analysis By Product Type
Figure 164: MEA Waterproof & Weatherproof Labels Market Value (US$ Mn), By Material type 2016-2025
Figure 165: MEA Waterproof & Weatherproof Labels Market Volume (Sq.M), By Material Type 2016-2025
Figure 166: MEA Waterproof & Weatherproof Labels Market Value (US$ Mn), By Plastic Sub-Segment 2016-2025
Figure 167: MEA Waterproof & Weatherproof Labels Market Volume (Sq.M), By Plastic Sub-Segment 2016-2025
Figure 168: MEA Waterproof & Weatherproof Labels Market Attractiveness Analysis By Material Type
Figure 169: MEA Waterproof & Weatherproof Labels Market Value (US$ Mn), By Printing Technology 2016-2025
Figure 170: MEA Waterproof & Weatherproof Labels Market Volume (Sq.M), By Printing Technology 2016-2025
Figure 171: MEA Waterproof & Weatherproof Labels Market Attractiveness Analysis By Printing Technology
Figure 172: MEA Waterproof & Weatherproof Labels Market Value (US$ Mn), By End Use Industry 2016-2025
Figure 173: MEA Waterproof & Weatherproof Labels Market Volume (Sq.M), By End Use Industry 2016-2025
Figure 174: MEA Waterproof & Weatherproof Labels Market Attractiveness Analysis By End Use Industry
Copyright © Transparency Market Research, Inc. All Rights reserved
Trust Online

Waterproof and Weatherproof Label Market