
Reports
Reports
Rapidly spreading covid-19 virus and its impact on global economy has harshly affected the warranty management software market. Manufacturers operating in the warranty management software market are striving to keep their wheels turning at the time of global financial crisis due to forced lockdown and shutting down of businesses. In order to deal with uncertainty and to overcome challenges in the global warranty management software market, companies are trying to re-establish their businesses by adopting innovative solutions. Vendors have started using artificial intelligence (AI) and cloud-based technologies in warranty management software to maintain product quality and increase the productivity. Due to the increasing demand for cloud-based warranty management software, North America shows lucrative growth opportunities amid coronavirus pandemic.
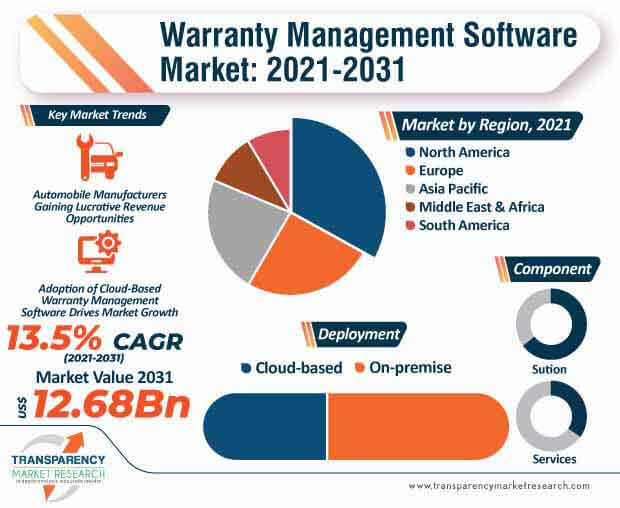
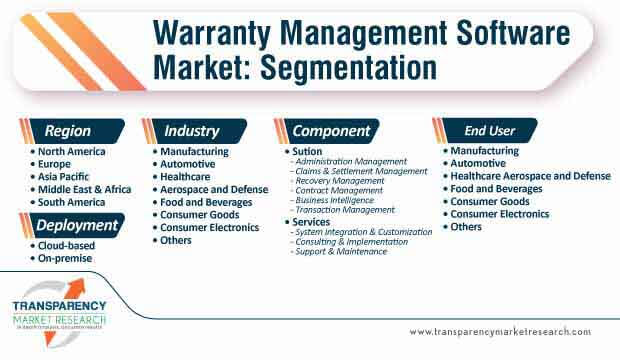
Advancements in warranty management software help consumers to claim and track their warranties and clear their doubts. It is important for product manufacturers from different end-use industries to improve customer satisfaction by ensuring quality of the products delivered. Warranty management software ensures claim management, warranty processing, and administration of warranties through entire product lifecycle. Digitalization and technological advancement have created a number of opportunities for the market players. The adoption of advanced technologies such as AI and ML is creating value-grab opportunities for the manufacturers. The increasing demand and popularity of cloud services across enterprises is expected to boost the global warranty management software market in the upcoming years. Innovations and improved infrastructure for establishing businesses and growth in information and technology services drive the global market. The warranty management software market is expected to cross US$ 12.68 Bn by 2031.
The automobile industry is regaining momentum after the threatening coronavirus pandemic. Development of automobile sector and increasing demand for vehicles are encouraging manufacturers to develop innovative products companies. Successful product lifecycle management and billing management system have positively influenced the global market. Increase in the production of vehicles across the globe has led to rise in the demand for warranty management software and services. Automobile manufacturers are focusing on increasing their annual budgets to improve the overall quality of the product. Apart from automobiles, warranty management software is essential in various other industries such as consumer electronics, healthcare, construction, food & beverage, manufacturing, etc. These software and services help manufacturers to build stronger relationships with customers, which, in turns, drives warranty management software.
Tavant Technologies, ServicePower, Caspio, Inc., and Wipro Limited are some of the key players operating in the global warranty management software market. The growing competition among these players create better relationships with customers by providing quality services. The rising demand for warranty management software drives the global market in Asia Pacific. Market players introduce new technologies, which contribute to market expansion. Moreover, manufacturers operating in the warranty management software market are focusing on overcoming challenges in the market. Lack of knowledge of advanced technologies, scarcity of skilled professionals, and stringent regulations can hamper market growth. Owing to the strong presence of top market contributors and adoption of cloud-based services, North America is expected to boost market growth.
Analysts’ Viewpoint
Rising applications of customer relationship management software in various end-use industries are boosting the demand and popularity of warranty management software market. Market contributors should target emerging technologies such as AI, ML, and cloud, etc. to improve customer experience. However, lack of knowledge about advanced tools and technologies in underdeveloped countries, along with high installation costs can hamper the global warranty management software market. Challenge here is to improve customer satisfaction by ensuring product quality. In order to increase profitability and overall customer experience to claim and manage warranties in product lifecycle, manufacturers are developing innovative solutions to attract customers and generate potential revenue opportunities.
|
Attribute |
Detail |
|
Market Size Value in 2020 (Base Year) |
US$ 3.20 Bn |
|
Market Forecast Value in 2031 |
US$ 12.68 Bn |
|
Growth Rate (CAGR) |
13.5% |
|
Forecast Period |
2021-2031 |
|
Market Analysis |
It includes market size assessment for the historic period 2016-2019, along with base year and forecast period, in terms of value (US$ Mn). It also provides insights such as regional analysis, opportunity assessment, product development and innovation, and ecosystem analysis, etc. |
|
Competition Landscape |
|
|
Format |
Electronic (PDF) + Excel |
|
Market Segmentation |
|
|
Regions Covered |
|
|
Countries Covered |
|
|
Companies Profiled |
|
|
Customization Scope |
Available upon Request |
|
Pricing |
Available upon Request |
1. Preface
1.1. Market Introduction
1.2. Market Segmentation
1.3. Key Research Objectives
2. Assumptions and Research Methodology
2.1. Research Methodology
2.1.1. List of Primary and Secondary Sources
2.2. Key Assumptions for Data Modelling
3. Executive Summary - Global Warranty Management Software Market
4. Market Overview
4.1. Market Definition
4.2. Technology/ Product Roadmap
4.3. Market Factor Analysis
4.3.1. Forecast Factors
4.3.2. Ecosystem/ Value Chain Analysis
4.3.3. Market Dynamics (Growth Influencers)
4.3.3.1. Drivers
4.3.3.2. Restraints
4.3.3.3. Opportunities
4.3.3.4. Impact Analysis of Drivers and Restraints
4.4. COVID-19 Impact Analysis
4.4.1. Impact of COVID-19 on the Warranty Management Software Market
4.4.2. End-user Sentiment Analysis: Comparative Analysis on Spending
4.4.2.1. Increase in Spending
4.4.2.2. Decrease in Spending
4.4.3. Short Term and Long Term Impact on the Market
4.5. Market Opportunity Assessment – by Region (North America/ Europe/ Asia Pacific/ Middle East & Africa/ South America)
4.5.1. By Component
4.5.2. By Deployment
4.5.3. By Industry
4.6. Competitive Scenario and Trends
4.6.1. List of Emerging, Prominent and Leading Players
4.6.2. Mergers & Acquisitions, Expansions
4.7. Adoption Analysis of Warranty Management Software Market, by Aftermarket Service Provider
5. Global Warranty Management Software Market Analysis and Forecast
5.1. Market Revenue Analysis (US$ Mn), 2016-2031
5.1.1. Historic Growth Trends, 2015-2020
5.1.2. Forecast Trends, 2021-2031
5.2. Pricing Model Analysis/ Price Trend Analysis
6. Global Warranty Management Software Market Analysis, by Component
6.1. Overview and Definitions
6.2. Key Segment Analysis
6.3. Warranty Management Software Market Size (US$ Mn) Forecast, by Component, 2018 - 2031
6.3.1. Solution
6.3.1.1. Administration Management
6.3.1.2. Claims & Settlement Management
6.3.1.3. Recovery Management
6.3.1.4. Contract Management
6.3.1.5. Business Intelligence
6.3.1.6. Transaction Management
6.3.2. Services
6.3.2.1. System Integration & Customization
6.3.2.2. Consulting & Implementation
6.3.2.3. Support & Maintenance
7. Global Warranty Management Software Market Analysis, by Deployment
7.1. Overview and Definitions
7.2. Key Segment Analysis
7.3. Warranty Management Software Market Size (US$ Mn) Forecast, by Deployment, 2018 - 2031
7.3.1. Cloud-based
7.3.2. On-premise
8. Global Warranty Management Software Market Analysis, by Industry
8.1. Overview and Definitions
8.2. Key Segment Analysis
8.3. Warranty Management Software Market Size (US$ Mn) Forecast, by Industry, 2018 - 2031
8.3.1. Manufacturing
8.3.2. Automotive
8.3.3. Healthcare
8.3.4. Aerospace and Defense
8.3.5. Food and Beverages
8.3.6. Consumer Goods
8.3.7. Consumer Electronics
8.3.8. Others
9. Global Warranty Management Software Market Analysis and Forecast, By Region
9.1. Key Findings
9.2. Warranty Management Software Market Size (US$ Mn) Forecast, by Region, 2018 - 2031
9.2.1. North America
9.2.2. Europe
9.2.3. Asia Pacific
9.2.4. Middle East & Africa
9.2.5. South America
10. North America Warranty Management Software Market Analysis
10.1. Regional Outlook
10.2. Warranty Management Software Market Size (US$ Mn) Analysis and Forecast (2018 - 2031)
10.2.1. By Component
10.2.2. By Deployment
10.2.3. By Industry
10.3. Warranty Management Software Market Size (US$ Mn) Forecast, by Country, 2018 - 2031
10.3.1. U.S.
10.3.2. Canada
10.3.3. Mexico
11. Europe Warranty Management Software Market Analysis and Forecast
11.1. Regional Outlook
11.2. Warranty Management Software Market Size (US$ Mn) Analysis and Forecast (2018 - 2031)
11.2.1. By Component
11.2.2. By Deployment
11.2.3. By Industry
11.3. Warranty Management Software Market Size (US$ Mn) Forecast, by Country & Sub-region, 2018 - 2031
11.3.1. Germany
11.3.2. U.K.
11.3.3. France
11.3.4. Spain
11.3.5. Italy
11.3.6. Rest of Europe
12. APAC Warranty Management Software Market Analysis and Forecast
12.1. Regional Outlook
12.2. Warranty Management Software Market Size (US$ Mn) Analysis and Forecast (2018 - 2031)
12.2.1. By Component
12.2.2. By Deployment
12.2.3. By Industry
12.3. Warranty Management Software Market Size (US$ Mn) Forecast, by Country & Sub-region, 2018 - 2031
12.3.1. China
12.3.2. India
12.3.3. Japan
12.3.4. ASEAN
12.3.5. Rest of Asia Pacific
13. Middle East & Africa (MEA) Warranty Management Software Market Analysis and Forecast
13.1. Regional Outlook
13.2. Warranty Management Software Market Size (US$ Mn) Analysis and Forecast (2018 - 2031)
13.2.1. By Component
13.2.2. By Deployment
13.2.3. By Industry
13.3. Warranty Management Software Market Size (US$ Mn) Forecast, by Country & Sub-region, 2018 - 2031
13.3.1. Saudi Arabia
13.3.2. The United Arab Emirates
13.3.3. South Africa
13.3.4. Rest of Middle East & Africa (MEA)
14. South America Warranty Management Software Market Analysis and Forecast
14.1. Regional Outlook
14.2. Warranty Management Software Market Size (US$ Mn) Analysis and Forecast (2018 - 2031)
14.2.1. By Component
14.2.2. By Deployment
14.2.3. By Industry
14.3. Warranty Management Software Market Size (US$ Mn) Forecast, by Country & Sub-region, 2018 - 2031
14.3.1. Brazil
14.3.2. Argentina
14.3.3. Rest of South America
15. Competition Landscape
15.1. Market Competition Matrix, by Leading Players
15.2. Market Revenue Share Analysis (%), by Leading Players (2020)
16. Company Profiles
16.1. ServicePower
16.1.1. Business Overview
16.1.2. Product Portfolio
16.1.3. Geographical Footprint
16.1.4. Revenue and Strategy
16.2. Caspio, Inc.
16.2.1. Business Overview
16.2.2. Product Portfolio
16.2.3. Geographical Footprint
16.2.4. Revenue and Strategy
16.3. Clyde Technologies, Inc
16.3.1. Business Overview
16.3.2. Product Portfolio
16.3.3. Geographical Footprint
16.3.4. Revenue and Strategy
16.4. Evia Information Systems Pvt. Ltd.
16.4.1. Business Overview
16.4.2. Product Portfolio
16.4.3. Geographical Footprint
16.4.4. Revenue and Strategy
16.5. Industrial and Financial Systems (IFS) AB
16.5.1. Business Overview
16.5.2. Product Portfolio
16.5.3. Geographical Footprint
16.5.4. Revenue and Strategy
16.6. Infosys Limited
16.6.1. Business Overview
16.6.2. Product Portfolio
16.6.3. Geographical Footprint
16.6.4. Revenue and Strategy
16.7. Intellinet Systems
16.7.1. Business Overview
16.7.2. Product Portfolio
16.7.3. Geographical Footprint
16.7.4. Revenue and Strategy
16.8. International Business Machines (IBM) Corporation
16.8.1. Business Overview
16.8.2. Product Portfolio
16.8.3. Geographical Footprint
16.8.4. Revenue and Strategy
16.9. Mize Inc. (Syncron AB)
16.9.1. Business Overview
16.9.2. Product Portfolio
16.9.3. Geographical Footprint
16.9.4. Revenue and Strategy
16.10. NeuroTags
16.10.1. Business Overview
16.10.2. Product Portfolio
16.10.3. Geographical Footprint
16.10.4. Revenue and Strategy
16.11. Oracle Corporation
16.11.1. Business Overview
16.11.2. Product Portfolio
16.11.3. Geographical Footprint
16.11.4. Revenue and Strategy
16.12. Pegasystems Inc.
16.12.1. Business Overview
16.12.2. Product Portfolio
16.12.3. Geographical Footprint
16.12.4. Revenue and Strategy
16.13. PTC Inc.
16.13.1. Business Overview
16.13.2. Product Portfolio
16.13.3. Geographical Footprint
16.13.4. Revenue and Strategy
16.14. SalesBabu Business Solutions Pvt. Ltd
16.14.1. Business Overview
16.14.2. Product Portfolio
16.14.3. Geographical Footprint
16.14.4. Revenue and Strategy
16.15. SAP SE
16.15.1. Business Overview
16.15.2. Product Portfolio
16.15.3. Geographical Footprint
16.15.4. Revenue and Strategy
16.16. ServiceMax
16.16.1. Business Overview
16.16.2. Product Portfolio
16.16.3. Geographical Footprint
16.16.4. Revenue and Strategy
16.17. Speridian
16.17.1. Business Overview
16.17.2. Product Portfolio
16.17.3. Geographical Footprint
16.17.4. Revenue and Strategy
16.18. Tavant Technologies, Inc.
16.18.1. Business Overview
16.18.2. Product Portfolio
16.18.3. Geographical Footprint
16.18.4. Revenue and Strategy
16.19. Tract Systems
16.19.1. Business Overview
16.19.2. Product Portfolio
16.19.3. Geographical Footprint
16.19.4. Revenue and Strategy
16.20. Wipro Limited
16.20.1. Business Overview
16.20.2. Product Portfolio
16.20.3. Geographical Footprint
16.20.4. Revenue and Strategy
17. Key Takeaways
List of Tables
Table 1: Acronyms Used in Warranty Management Software Market
Table 2: North America Warranty Management Software Market Revenue Analysis, by Country, 2021 - 2031 (US$ Mn)
Table 3: Europe Warranty Management Software Market Revenue Analysis, by Country, 2021 - 2031 (US$ Mn)
Table 4: Asia Pacific Warranty Management Software Market Revenue Analysis, by Country, 2021 - 2031 (US$ Mn)
Table 5: Middle East & Africa Warranty Management Software Market Revenue Analysis, by Country, 2021 and 2031 (US$ Mn)
Table 6: South America Warranty Management Software Market Revenue Analysis, by Country, 2021 - 2031 (US$ Mn)
Table 7: Impact Analysis of Drivers
Table 8: Mergers & Acquisitions, Expansions, Partnerships, and Developments
Table 9: Global Warranty Management Software Market Value (US$ Mn) Forecast, by Component, 2018 – 2031
Table 10: Global Warranty Management Software Market Value (US$ Mn) Forecast, by Deployment, 2018 – 2031
Table 11: Global Warranty Management Software Market Value (US$ Mn) Forecast, by Industry, 2018 – 2031
Table 12: Global Warranty Management Software Market Volume (US$ Mn) Forecast, by Region, 2018 – 2031
Table 13: North America Warranty Management Software Market Value (US$ Mn) Forecast, by Component, 2018 – 2031
Table 14: North America Warranty Management Software Market Value (US$ Mn) Forecast, by Deployment, 2018 – 2031
Table 15: North America Warranty Management Software Market Value (US$ Mn) Forecast, by Industry, 2018 – 2031
Table 16: North America Warranty Management Software Market Value (US$ Mn) Forecast, by Country, 2018 - 2031
Table 17: U.S. Warranty Management Software Market Revenue CAGR Breakdown (%), by Growth Term
Table 18: Canada Warranty Management Software Market Revenue CAGR Breakdown (%), by Growth Term
Table 19: Mexico Warranty Management Software Market Revenue CAGR Breakdown (%), by Growth Term
Table 20: Europe Warranty Management Software Market Value (US$ Mn) Forecast, by Component, 2018 – 2031
Table 21: Europe Warranty Management Software Market Value (US$ Mn) Forecast, by Deployment, 2018 – 2031
Table 22: Europe Warranty Management Software Market Value (US$ Mn) Forecast, by Industry, 2018 – 2031
Table 23: Europe Warranty Management Software Market Value (US$ Mn) Forecast, by Country, 2018 - 2031
Table 24: Germany Warranty Management Software Market Revenue CAGR Breakdown (%), by Growth Term
Table 25: U.K. Warranty Management Software Market Revenue CAGR Breakdown (%), by Growth Term
Table 26: France Warranty Management Software Market Revenue CAGR Breakdown (%), by Growth Term
Table 27: Spain Warranty Management Software Market Revenue CAGR Breakdown (%), by Growth Term
Table 28: Italy Warranty Management Software Market Revenue CAGR Breakdown (%), by Growth Term
Table 29: Asia Pacific Warranty Management Software Market Value (US$ Mn) Forecast, by Component, 2018 – 2031
Table 30: Asia Pacific Warranty Management Software Market Value (US$ Mn) Forecast, by Deployment, 2018 – 2031
Table 31: Asia Pacific Warranty Management Software Market Value (US$ Mn) Forecast, by Industry, 2018 – 2031
Table 32: Asia Pacific Warranty Management Software Market Value (US$ Mn) Forecast, by Country, 2018 - 2031
Table 33: China Warranty Management Software Market Revenue CAGR Breakdown (%), by Growth Term
Table 34: India Warranty Management Software Market Revenue CAGR Breakdown (%), by Growth Term
Table 35: Japan Warranty Management Software Market Revenue CAGR Breakdown (%), by Growth Term
Table 36: ASEAN Warranty Management Software Market Revenue CAGR Breakdown (%), by Growth Term
Table 37: Middle East & Africa Warranty Management Software Market Value (US$ Mn) Forecast, by Component, 2018 – 2031
Table 38: Middle East & Africa Warranty Management Software Market Value (US$ Mn) Forecast, by Deployment, 2018 – 2031
Table 39: Middle East & Africa Warranty Management Software Market Value (US$ Mn) Forecast, by Industry, 2018 – 2031
Table 40: Middle East & Africa Warranty Management Software Market Value (US$ Mn) Forecast, by Country, 2018 - 2031
Table 41: Saudi Arabia Warranty Management Software Market Revenue CAGR Breakdown (%), by Growth Term
Table 42: The United Arab Emirates Warranty Management Software Market Revenue CAGR Breakdown (%), by Growth Term
Table 43: South Africa Warranty Management Software Market Revenue CAGR Breakdown (%), by Growth Term
Table 44: South America Warranty Management Software Market Value (US$ Mn) Forecast, by Component, 2018 – 2031
Table 45: South America Warranty Management Software Market Value (US$ Mn) Forecast, by Deployment, 2018 – 2031
Table 46: South America Warranty Management Software Market Value (US$ Mn) Forecast, by Industry, 2018 – 2031
Table 47: South America Warranty Management Software Market Value (US$ Mn) Forecast, by Country, 2018 - 2031
Table 48: Brazil Emirates Warranty Management Software Market Revenue CAGR Breakdown (%), by Growth Term
Table 49: Argentina Warranty Management Software Market Revenue CAGR Breakdown (%), by Growth Term
List of Figures
Figure 1: Global Warranty Management Software Market Size (US$ Mn) Forecast, 2018–2031
Figure 2: Global Warranty Management Software Market Revenue (US$ Mn) Opportunity Assessment, by Region, 2021E
Figure 3: Top Segment Analysis of Warranty Management Software Market
Figure 4: Global Warranty Management Software Market Revenue (US$ Mn) Opportunity Assessment, by Region, 2031F
Figure 5: Global Warranty Management Software Market Attractiveness Assessment, by Component
Figure 6: Global Warranty Management Software Market Attractiveness Assessment, by Deployment
Figure 7: Global Warranty Management Software Market Attractiveness Assessment, by Industry
Figure 8: Global Warranty Management Software Market Attractiveness Assessment, by Region
Figure 9: Global Warranty Management Software Market Revenue (US$ Mn) Historic Trends, 2016 - 2020
Figure 10: Global Warranty Management Software Market Revenue Opportunity (US$ Mn) Historic Trends, 2016 - 2020
Figure 11: Global Warranty Management Software Market Value Share Analysis, by Component, 2021
Figure 12: Global Warranty Management Software Market Value Share Analysis, by Component, 2031
Figure 13: Global Warranty Management Software Market Absolute Opportunity (US$ Mn), by Software, 2021 – 2031
Figure 14: Global Warranty Management Software Market Absolute Opportunity (US$ Mn), by Services, 2021 – 2031
Figure 15: Global Warranty Management Software Market Value Share Analysis, by Deployment, 2021
Figure 16: Global Warranty Management Software Market Value Share Analysis, by Deployment, 2031
Figure 17: Global Warranty Management Software Market Absolute Opportunity (US$ Mn), by Cloud-based, 2021 – 2031
Figure 18: Global Warranty Management Software Market Absolute Opportunity (US$ Mn), by On-premise, 2021 – 2031
Figure 19: Global Warranty Management Software Market Value Share Analysis, by Industry, 2021
Figure 20: Global Warranty Management Software Market Value Share Analysis, by Industry, 2031
Figure 21: Global Warranty Management Software Market Absolute Opportunity (US$ Mn), by Manufacturing, 2021 – 2031
Figure 22: Global Warranty Management Software Market Absolute Opportunity (US$ Mn), by Manufacturing, 2021 – 2031
Figure 23: Global Warranty Management Software Market Absolute Opportunity (US$ Mn), by Healthcare, 2021 – 2031
Figure 24: Global Warranty Management Software Market Absolute Opportunity (US$ Mn), by Aerospace and Defense, 2021 – 2031
Figure 25: Global Warranty Management Software Market Absolute Opportunity (US$ Mn), by Aerospace and Defense, 2021 – 2031
Figure 26: Global Warranty Management Software Market Absolute Opportunity (US$ Mn), by Retail and Consumer Goods, 2021 – 2031
Figure 27: Global Warranty Management Software Market Absolute Opportunity (US$ Mn), by Consumer Electronics, 2021 – 2031
Figure 28: Global Warranty Management Software Market Absolute Opportunity (US$ Mn), by Others, 2021 – 2031
Figure 29: Global Warranty Management Software Market Opportunity (US$ Mn), by Region
Figure 30: Global Warranty Management Software Market Opportunity Share (%), by Region, 2021–2031
Figure 31: Global Warranty Management Software Market Opportunity Share (%), by Region, 2021–2031
Figure 32: Global Warranty Management Software Market Value Share Analysis, by Region, 2021
Figure 33: Global Warranty Management Software Market Value Share Analysis, by Region, 2031
Figure 34: North America Warranty Management Software Market Absolute Opportunity (US$ Mn), 2021 – 2031
Figure 35: Europe Warranty Management Software Market Absolute Opportunity (US$ Mn), 2021 – 2031
Figure 36: Asia Pacific Warranty Management Software Market Absolute Opportunity (US$ Mn), 2021 – 2031
Figure 37: Middle East & Africa Warranty Management Software Market Absolute Opportunity (US$ Mn), 2021 – 2031
Figure 38: South America Warranty Management Software Market Absolute Opportunity (US$ Mn), 2021 – 2031
Figure 39: North America Warranty Management Software Revenue Opportunity Share, by Component
Figure 40: North America Warranty Management Software Revenue Opportunity Share, by Deployment
Figure 41: North America Warranty Management Software Revenue Opportunity Share, by Industry
Figure 42: North America Warranty Management Software Revenue Opportunity Share, by Country
Figure 43: U.S. Warranty Management Software Market Opportunity Growth Analysis (US$ Mn) Forecast, 2021 – 2031
Figure 44: Canada Warranty Management Software Market Opportunity Growth Analysis (US$ Mn) Forecast, 2021 – 2031
Figure 45: Mexico Warranty Management Software Market Opportunity Growth Analysis (US$ Mn) Forecast, 2021 – 2031
Figure 46: North America Warranty Management Software Market Absolute Opportunity (US$ Mn), by Cloud, 2021 – 2031
Figure 47: Europe Warranty Management Software Revenue Opportunity Share, by Component
Figure 48: Europe Warranty Management Software Revenue Opportunity Share, by Industry
Figure 49: Europe Warranty Management Software Revenue Opportunity Share, by Country
Figure 50: Europe Warranty Management Software Market Value Share Analysis, by Component, 2021
Figure 51: Europe Warranty Management Software Market Value Share Analysis, by Component, 2031
Figure 52: Europe Warranty Management Software Market Absolute Opportunity (US$ Mn), by Solution, 2021 – 2031
Figure 53: Europe Warranty Management Software Market Absolute Opportunity (US$ Mn), by Services, 2021 – 2031
Figure 54: Europe Warranty Management Software Market Value Share Analysis, by Deployment, 2021
Figure 55: Europe Warranty Management Software Market Value Share Analysis, by Deployment, 2031
Figure 56: Europe Warranty Management Software Market Absolute Opportunity (US$ Mn), by Cloud-based, 2021 – 2031
Figure 57: Europe Warranty Management Software Market Absolute Opportunity (US$ Mn), by On-premise, 2021 – 2031
Figure 58: Europe Warranty Management Software Market Value Share Analysis, by Industry, 2021
Figure 59: Europe Warranty Management Software Market Value Share Analysis, by Industry, 2031
Figure 60: Europe Warranty Management Software Market Absolute Opportunity (US$ Mn), by Manufacturing, 2021 – 2031
Figure 61: Europe Warranty Management Software Market Absolute Opportunity (US$ Mn), by Manufacturing, 2021 – 2031
Figure 62: Europe Warranty Management Software Market Absolute Opportunity (US$ Mn), by Healthcare, 2021 – 2031
Figure 63: Europe Warranty Management Software Market Absolute Opportunity (US$ Mn), by Aerospace and Defense, 2021 – 2031
Figure 64: Europe Warranty Management Software Market Absolute Opportunity (US$ Mn), by Food and Beverages, 2021 – 2031
Figure 65: Europe Warranty Management Software Market Absolute Opportunity (US$ Mn), by Retail and Consumer Goods, 2021 – 2031
Figure 66: Europe Warranty Management Software Market Absolute Opportunity (US$ Mn), by Consumer Electronics, 2021 – 2031
Figure 67: Europe Warranty Management Software Market Absolute Opportunity (US$ Mn), by Others, 2021 – 2031
Figure 68: Europe Warranty Management Software Market Value Share Analysis, by Country, 2021
Figure 69: Europe Warranty Management Software Market Value Share Analysis, by Country, 2031
Figure 70: Germany Warranty Management Software Market Opportunity Growth Analysis (US$ Mn) Forecast, 2021 – 2031
Figure 71: U.K. Warranty Management Software Market Opportunity Growth Analysis (US$ Mn) Forecast, 2021 – 2031
Figure 72: France Warranty Management Software Market Opportunity Growth Analysis (US$ Mn) Forecast, 2021 – 2031
Figure 73: Spain Warranty Management Software Market Opportunity Growth Analysis (US$ Mn) Forecast, 2021 – 2031
Figure 74: Italy Warranty Management Software Market Opportunity Growth Analysis (US$ Mn) Forecast, 2021 – 2031
Figure 75: Asia Pacific Warranty Management Software Revenue Opportunity Share, by Component
Figure 76: Asia Pacific Warranty Management Software Revenue Opportunity Share, by Deployment
Figure 77: Asia Pacific Warranty Management Software Revenue Opportunity Share, by Industry
Figure 78: Asia Pacific Warranty Management Software Revenue Opportunity Share, by Country
Figure 79: Asia Pacific l Warranty Management Software Market Value Share Analysis, by Component, 2021
Figure 80: Asia Pacific Warranty Management Software Market Value Share Analysis, by Component, 2031
Figure 81: Asia Pacific Warranty Management Software Market Absolute Opportunity (US$ Mn), by Solution, 2021 – 2031
Figure 82: Asia Pacific Warranty Management Software Market Absolute Opportunity (US$ Mn), by Services, 2021 – 2031
Figure 83: Asia Pacific Warranty Management Software Market Value Share Analysis, by Deployment, 2021
Figure 84: Asia Pacific Warranty Management Software Market Value Share Analysis, by Deployment, 2031
Figure 85: Asia Pacific Warranty Management Software Market Absolute Opportunity (US$ Mn), by Cloud-based, 2021 – 2031
Figure 86: Asia Pacific Warranty Management Software Market Absolute Opportunity (US$ Mn), by On-premise, 2021 – 2031
Figure 87: Asia Pacific Warranty Management Software Market Value Share Analysis, by Industry, 2021
Figure 88: Asia Pacific Warranty Management Software Market Value Share Analysis, by Industry, 2031
Figure 89: Asia Pacific Warranty Management Software Market Absolute Opportunity (US$ Mn), by Manufacturing, 2021 – 2031
Figure 90: Asia Pacific Warranty Management Software Market Absolute Opportunity (US$ Mn), by Automotive, 2021 – 2031
Figure 91: Asia Pacific Warranty Management Software Market Absolute Opportunity (US$ Mn), by Healthcare, 2021 – 2031
Figure 92: Asia Pacific Warranty Management Software Market Absolute Opportunity (US$ Mn), by Aerospace and Defense, 2021 – 2031
Figure 93: Asia Pacific Warranty Management Software Market Absolute Opportunity (US$ Mn), by Food and Beverages, 2021 – 2031
Figure 94: Asia Pacific Warranty Management Software Market Absolute Opportunity (US$ Mn), by Retail and Consumer Goods, 2021 – 2031
Figure 95: Asia Pacific Warranty Management Software Market Absolute Opportunity (US$ Mn), by Consumer Electronics, 2021 – 2031
Figure 96: Asia Pacific Warranty Management Software Market Absolute Opportunity (US$ Mn), by Others, 2021 – 2031
Figure 97: Asia Pacific Warranty Management Software Market Value Share Analysis, by Country, 2021
Figure 98: Asia Pacific Warranty Management Software Market Value Share Analysis, by Country, 2031
Figure 99: China Warranty Management Software Market Opportunity Growth Analysis (US$ Mn) Forecast, 2021 – 2031
Figure 100: India Warranty Management Software Market Opportunity Growth Analysis (US$ Mn) Forecast, 2021 – 2031
Figure 101: Japan Warranty Management Software Market Opportunity Growth Analysis (US$ Mn) Forecast, 2021 – 2031
Figure 102: ASEAN Warranty Management Software Market Opportunity Growth Analysis (US$ Mn) Forecast, 2021 – 2031
Figure 103: Middle East & Africa Warranty Management Software Revenue Opportunity Share, by Component
Figure 104: Middle East & Africa Warranty Management Software Revenue Opportunity Share, by Deployment
Figure 105: Middle East & Africa Warranty Management Software Revenue Opportunity Share, by Industry
Figure 106: Middle East & Africa Warranty Management Software Revenue Opportunity Share, by Country
Figure 107: Middle East & Africa l Warranty Management Software Market Value Share Analysis, by Component, 2021
Figure 108: Middle East & Africa Warranty Management Software Market Value Share Analysis, by Component, 2031
Figure 109: Middle East & Africa Warranty Management Software Market Absolute Opportunity (US$ Mn), by Solution, 2021 – 2031
Figure 110: Middle East & Africa Warranty Management Software Market Absolute Opportunity (US$ Mn), by Services, 2021 – 2031
Figure 111: Middle East & Africa Warranty Management Software Market Value Share Analysis, by Deployment, 2021
Figure 112: Middle East & Africa Warranty Management Software Market Value Share Analysis, by Deployment, 2031
Figure 113: Middle East & Africa Warranty Management Software Market Absolute Opportunity (US$ Mn), by Cloud-based, 2021 – 2031
Figure 114: Middle East & Africa Warranty Management Software Market Absolute Opportunity (US$ Mn), by On-premise, 2021 – 2031
Figure 115: Middle East & Africa Warranty Management Software Market Value Share Analysis, by Industry, 2021
Figure 116: Middle East & Africa Warranty Management Software Market Value Share Analysis, by Industry, 2031
Figure 117: Middle East & Africa Warranty Management Software Market Absolute Opportunity (US$ Mn), by Manufacturing, 2021 – 2031
Figure 118: Middle East & Africa Warranty Management Software Market Absolute Opportunity (US$ Mn), by Automotive, 2021 – 2031
Figure 119: Middle East & Africa Warranty Management Software Market Absolute Opportunity (US$ Mn), by Healthcare, 2021 – 2031
Figure 120: Middle East & Africa Warranty Management Software Market Absolute Opportunity (US$ Mn), by Aerospace and Defense, 2021 – 2031
Figure 121: Middle East & Africa Warranty Management Software Market Absolute Opportunity (US$ Mn), by Food and Beverages, 2021 – 2031
Figure 122: Middle East & Africa Warranty Management Software Market Absolute Opportunity (US$ Mn), by Retail and Consumer Goods, 2021 – 2031
Figure 123: Middle East & Africa Warranty Management Software Market Absolute Opportunity (US$ Mn), by Consumer Electronics, 2021 – 2031
Figure 124: Middle East & Africa Warranty Management Software Market Absolute Opportunity (US$ Mn), by Others, 2021 – 2031
Figure 125: Middle East & Africa Warranty Management Software Market Value Share Analysis, by Country, 2021
Figure 126: Middle East & Africa Warranty Management Software Market Value Share Analysis, by Country, 2031
Figure 127: Saudi Arabia Warranty Management Software Market Opportunity Growth Analysis (US$ Mn) Forecast, 2021 – 2031
Figure 128: The United Arab Emirates Warranty Management Software Market Opportunity Growth Analysis (US$ Mn) Forecast, 2021 – 2031
Figure 129: South Africa Warranty Management Software Market Opportunity Growth Analysis (US$ Mn) Forecast, 2021 – 2031
Figure 130: South America Warranty Management Software Revenue Opportunity Share, by Component
Figure 131: South America Warranty Management Software Revenue Opportunity Share, by Deployment
Figure 132: South America Warranty Management Software Revenue Opportunity Share, by Industry
Figure 133: South America Warranty Management Software Revenue Opportunity Share, by Country
Figure 134: South America l Warranty Management Software Market Value Share Analysis, by Component, 2021
Figure 135: South America Warranty Management Software Market Value Share Analysis, by Component, 2031
Figure 136: South America Warranty Management Software Market Absolute Opportunity (US$ Mn), by Solution, 2021 – 2031
Figure 137: South America Warranty Management Software Market Absolute Opportunity (US$ Mn), by Services, 2021 – 2031
Figure 138: South America Warranty Management Software Market Value Share Analysis, by Deployment, 2021
Figure 139: South America Warranty Management Software Market Value Share Analysis, by Deployment, 2031
Figure 140: South America Warranty Management Software Market Absolute Opportunity (US$ Mn), by Cloud-based, 2021 – 2031
Figure 141: South America Warranty Management Software Market Absolute Opportunity (US$ Mn), by On-premise, 2021 – 2031
Figure 142: South America Warranty Management Software Market Value Share Analysis, by Industry, 2021
Figure 143: South America Warranty Management Software Market Value Share Analysis, by Industry, 2031
Figure 144: South America Warranty Management Software Market Absolute Opportunity (US$ Mn), by Manufacturing, 2021 – 2031
Figure 145: South America Warranty Management Software Market Absolute Opportunity (US$ Mn), by Automotive, 2021 – 2031
Figure 146: South America Warranty Management Software Market Absolute Opportunity (US$ Mn), by Healthcare, 2021 – 2031
Figure 147: South America Warranty Management Software Market Absolute Opportunity (US$ Mn), by Aerospace and Defense, 2021 – 2031
Figure 148: South America Warranty Management Software Market Absolute Opportunity (US$ Mn), by Food and Beverages, 2021 – 2031
Figure 149: South America Warranty Management Software Market Absolute Opportunity (US$ Mn), by Retail and Consumer Goods, 2021 – 2031
Figure 150: South America Warranty Management Software Market Absolute Opportunity (US$ Mn), by Consumer Electronics, 2021 – 2031
Figure 151: South America Warranty Management Software Market Absolute Opportunity (US$ Mn), by Others, 2021 – 2031
Figure 152: Brazil Warranty Management Software Market Opportunity Growth Analysis (US$ Mn) Forecast, 2021 – 2031
Figure 153: Argentina Warranty Management Software Market Opportunity Growth Analysis (US$ Mn) Forecast, 2021 – 2031
Copyright © Transparency Market Research, Inc. All Rights reserved
Trust Online

Warranty Management Software Market