
Reports
Reports
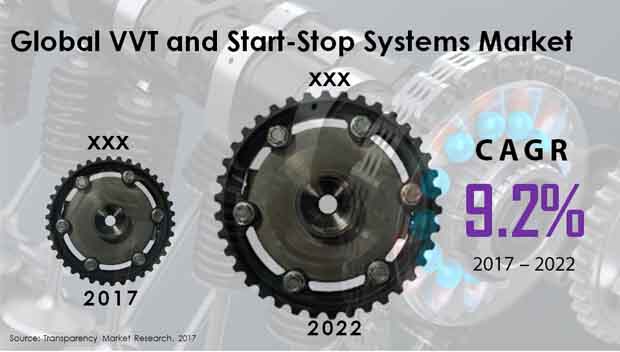
The automotive industry is touching new peaks each year, especially in the emerging economies, and its prosperity is reflecting highly positively on the global VVT & start-stop systems market, which is projected for a CAGR of 9.4% during the forecast period of 2017 to 2022. The growing need to increase fuel efficiency as a result of depleting oil reserves, stringent emission norms that have led to higher VVT standards, and hybridization of vehicles are some of the key factors augmenting the demand in the global VVT & start-stop systems market.
While the growing demand for cam-less actuation and rapidly increasing preference of diesel cars will continue to open new opportunities for the vendors operating in the global VVT & start-stop systems market , factors such as increasing adoption of alternative fuels, high product cost, and substantial maintenance cost are expected to challenge the market from flourishing. Evaluated to be worth US$41,734.7 mn in 2017, the global VVT & start-stop systems market is estimated to be worth US$64,895.9 by the end of the forecast period, which is 2022.
Based on product-type, the global VVT & start-stop systems market has been segmented into dual over-head cam (DOHC) and single over-head cam (SOHC). In the present scenario, the DOHC segment is most profitable, exhibiting an individual CAGR of 9.0% during the forecast period of 2017 to 2022, when it is estimated to be worth US$37,922.9 mn. The dual over-head cam segment is foreseen to produce a revenue of US$2,657.5 mn annually for the next five years, and its absolute growth is larger than any other segment. By the end of 2022, DOHC segment is projected to constitute 58.4% of the overall demand in the global VVT & start-stop systems market.
Technology-wise, the market for VVT start-stop systems has been bifurcated into cam phasing, cam phasing plus changing, belt-driven, direct starter, enhanced starter, and integrated starter. As a result of increasing demand for performance-oriented fuel-efficient vehicles as well as stringent emissions regulations in several developed countries, the adoption of advanced VVT systems such as cam-Phasing plus changing systems is anticipated to be higher in North America and Asia-Pacific. Based on fuel type, the global VVT & start-stop systems market has been classified into gasoline and diesel, whereas application-wise, this market has been categorized into compact passenger cars, mid-sized passenger cars, premium passenger cars, luxury passenger cars, light commercial vehicles, and heavy commercial vehicles.
Geographically, the region of Asia Pacific except Japan (APEJ) is most profitable in the global VVT & start-stop systems market, projected to represent opportunities worth US$22,947.1 mn by the end of the forecast period, which is 2022. This substantial chunk of demand is more than any other individual region studied under this report. The demand in the APEJ VVT stop-start systems market is expected to increment at an above-average CAGR of 10.2% during the said forecast period, gaining traction from increased manufacturing of vehicles equipped with these systems as well as increasing disposable income among the urban populations residing in this region. North America makes for the second most lucrative region for the vendors operating in the VVT & start-stop systems market, expanding at a CAGR of 9.5% between now and 2022 to reach a valuation of US$11,589.2 mn.
Denso Corporation, Mitsubishi Electric Corporation, Schaeffler AG, Robert Bosch GmbH, Continental AG, Hitachi Ltd., BMW, Eaton Corporation plc, Magna International Inc., Delphi Automotive PLC, Toyota Motors, Johnson Controls, Inc., Aisin Seiki Co. Ltd., and Valeo S.A. are some of the key companies currently holding a position of strength in the global VVT & start-stop systems market.
1. Global VVT & Start-Stop Systems Market - Executive Summary
2. Global VVT & Start-Stop Systems Market Overview
2.1. Introduction
2.1.1. Global VVT & Start-Stop Systems Market Taxonomy
2.1.2. Global VVT & Start-Stop Systems Market Definition
2.2. Global VVT & Start-Stop Systems Market Size (US$ Mn) and Forecast, 2012-2022
2.2.1. Global VVT & Start-Stop Systems Market Y-o-Y Growth
2.3. Global VVT & Start-Stop Systems Market Dynamics
2.4. Supply Chain
2.5. Cost Structure
2.6. Pricing Analysis
2.7. Raw Material Sourcing Strategy and Analysis
2.8. List of Distributors
2.9. Key Participants Market Presence (Intensity Map) By Region
3. Global VVT & Start-Stop Systems Market Analysis and Forecast By Product Type
3.1. Global VVT & Start-Stop Systems Market Size and Forecast By Product Type, 2012-2022
3.1.1. Dual Over Head Cam (DOHC) VVT & Start-Stop Systems Market Size and Forecast, 2012-2022
3.1.1.1. Revenue (US$ Mn) Comparison, By Region
3.1.1.2. Market Share Comparison, By Region
3.1.1.3. Y-o-Y growth Comparison, By Region
3.1.2. Single Over Head Cam (SOHC) VVT & Start-Stop Systems Market Size and Forecast, 2012-2022
3.1.2.1. Revenue (US$ Mn) Comparison, By Region
3.1.2.2. Market Share Comparison, By Region
3.1.2.3. Y-o-Y growth Comparison, By Region
4. Global VVT & Start-Stop Systems Market Analysis and Forecast By Technology Type
4.1. Global VVT & Start-Stop Systems Market Size and Forecast By Technology Type , 2012-2022
4.1.1. Cam Phasing VVT & Start-Stop Systems Market Size and Forecast, 2012-2022
4.1.1.1. Revenue (US$ Mn) Comparison, By Region
4.1.1.2. Market Share Comparison, By Region
4.1.1.3. Y-o-Y growth Comparison, By Region
4.1.2. Cam phasing plus changing VVT & Start-Stop Systems Market Size and Forecast, 2012-2022
4.1.2.1. Revenue (US$ Mn) Comparison, By Region
4.1.2.2. Market Share Comparison, By Region
4.1.2.3. Y-o-Y growth Comparison, By Region
4.1.3. Belt-driven alternator starter VVT & Start-Stop Systems Market Size and Forecast, 2012-2022
4.1.3.1. Revenue (US$ Mn) Comparison, By Region
4.1.3.2. Market Share Comparison, By Region
4.1.3.3. Y-o-Y growth Comparison, By Region
4.1.4. Direct starter VVT & Start-Stop Systems Market Size and Forecast, 2012-2022
4.1.4.1. Revenue (US$ Mn) Comparison, By Region
4.1.4.2. Market Share Comparison, By Region
4.1.4.3. Y-o-Y growth Comparison, By Region
4.1.5. Enhanced starter VVT & Start-Stop Systems Market Size and Forecast, 2012-2022
4.1.5.1. Revenue (US$ Mn) Comparison, By Region
4.1.5.2. Market Share Comparison, By Region
4.1.5.3. Y-o-Y growth Comparison, By Region
4.1.6. Integrated starter generator VVT & Start-Stop Systems Market Size and Forecast, 2012-2022
4.1.6.1. Revenue (US$ Mn) Comparison, By Region
4.1.6.2. Market Share Comparison, By Region
4.1.6.3. Y-o-Y growth Comparison, By Region
5. Global VVT & Start-Stop Systems Market Analysis and Forecast By Application
5.1. Global VVT & Start-Stop Systems Market Size and Forecast By Application, 2012-2022
5.1.1. Compact Passenger Cars VVT & Start-Stop Systems Market Size and Forecast, 2012-2022
5.1.1.1. Revenue (US$ Mn) Comparison, By Region
5.1.1.2. Market Share Comparison, By Region
5.1.1.3. Y-o-Y growth Comparison, By Region
5.1.2. Mid-sized Passenger Cars VVT & Start-Stop Systems Market Size and Forecast, 2012-2022
5.1.2.1. Revenue (US$ Mn) Comparison, By Region
5.1.2.2. Market Share Comparison, By Region
5.1.2.3. Y-o-Y growth Comparison, By Region
5.1.3. Premium Passenger Cars VVT & Start-Stop Systems Market Size and Forecast, 2012-2022
5.1.3.1. Revenue (US$ Mn) Comparison, By Region
5.1.3.2. Market Share Comparison, By Region
5.1.3.3. Y-o-Y growth Comparison, By Region
5.1.4. Luxury Passenger Cars VVT & Start-Stop Systems Market Size and Forecast, 2012-2022
5.1.4.1. Revenue (US$ Mn) Comparison, By Region
5.1.4.2. Market Share Comparison, By Region
5.1.4.3. Y-o-Y growth Comparison, By Region
5.1.5. Light Commercial Vehicles VVT & Start-Stop Systems Market Size and Forecast, 2012-2022
5.1.5.1. Revenue (US$ Mn) Comparison, By Region
5.1.5.2. Market Share Comparison, By Region
5.1.5.3. Y-o-Y growth Comparison, By Region
5.1.6. Heavy Commercial Vehicles VVT & Start-Stop Systems Market Size and Forecast, 2012-2022
5.1.6.1. Revenue (US$ Mn) Comparison, By Region
5.1.6.2. Market Share Comparison, By Region
5.1.6.3. Y-o-Y growth Comparison, By Region
6. Global VVT & Start-Stop Systems Market Analysis and Forecast By Fuel Type
6.1. Global VVT & Start-Stop Systems Market Size and Forecast By Fuel Type, 2012-2022
6.1.1. Gasoline VVT & Start-Stop Systems Market Size and Forecast, 2012-2022
6.1.1.1. Revenue (US$ Mn) Comparison, By Region
6.1.1.2. Market Share Comparison, By Region
6.1.1.3. Y-o-Y growth Comparison, By Region
6.1.2. Diesel VVT & Start-Stop Systems Market Size and Forecast, 2012-2022
6.1.2.1. Revenue (US$ Mn) Comparison, By Region
6.1.2.2. Market Share Comparison, By Region
6.1.2.3. Y-o-Y growth Comparison, By Region
7. Global VVT & Start-Stop Systems Market Analysis and Forecast By Region
7.1. Global VVT & Start-Stop Systems Market Size and Forecast, 2012-2022
7.1.1. North America VVT & Start-Stop Systems Market Size and Forecast, 2012-2022
7.1.1.1. Revenue (US$ Mn) Comparison, By Product Type
7.1.1.2. Revenue (US$ Mn) Comparison, By Technology Type
7.1.1.3. Revenue (US$ Mn) Comparison, By Application
7.1.1.4. Revenue (US$ Mn) Comparison, By Fuel Type
7.1.2. Latin America VVT & Start-Stop Systems Market Size and Forecast, 2012-2022
7.1.2.1. Revenue (US$ Mn) Comparison, By Product Type
7.1.2.2. Revenue (US$ Mn) Comparison, By Technology Type
7.1.2.3. Revenue (US$ Mn) Comparison, By Application
7.1.2.4. Revenue (US$ Mn) Comparison, By Fuel Type
7.1.3. Europe VVT & Start-Stop Systems Market Size and Forecast, 2012-2022
7.1.3.1. Revenue (US$ Mn) Comparison, By Product Type
7.1.3.2. Revenue (US$ Mn) Comparison, By Technology Type
7.1.3.3. Revenue (US$ Mn) Comparison, By Application
7.1.3.4. Revenue (US$ Mn) Comparison, By Fuel Type
7.1.4. Japan VVT & Start-Stop Systems Market Size and Forecast, 2012-2022
7.1.4.1. Revenue (US$ Mn) Comparison, By Product Type
7.1.4.2. Revenue (US$ Mn) Comparison, By Technology Type
7.1.4.3. Revenue (US$ Mn) Comparison, By Application
7.1.4.4. Revenue (US$ Mn) Comparison, By Fuel Type
7.1.5. APEJ VVT & Start-Stop Systems Market Size and Forecast, 2012-2022
7.1.5.1. Revenue (US$ Mn) Comparison, By Product Type
7.1.5.2. Revenue (US$ Mn) Comparison, By Technology Type
7.1.5.3. Revenue (US$ Mn) Comparison, By Application
7.1.5.4. Revenue (US$ Mn) Comparison, By Fuel Type
7.1.6. MEA VVT & Start-Stop Systems Market Size and Forecast, 2012-2022
7.1.6.1. Revenue (US$ Mn) Comparison, By Product Type
7.1.6.2. Revenue (US$ Mn) Comparison, By Technology Type
7.1.6.3. Revenue (US$ Mn) Comparison, By Application
7.1.6.4. Revenue (US$ Mn) Comparison, By Fuel Type
8. North America VVT & Start-Stop Systems Market Analysis and Forecast, By Country, 2012-2022
8.1. US VVT & Start-Stop Systems Market Size and Forecast, 2012-2022
8.1.1. Revenue (US$ Mn) Comparison, By Product Type
8.1.2. Revenue (US$ Mn) Comparison, By Technology Type
8.1.3. Revenue (US$ Mn) Comparison, By Application
8.1.4. Revenue (US$ Mn) Comparison, By Fuel Type
8.2. Canada VVT & Start-Stop Systems Market Size and Forecast, 2012-2022
8.2.1. Revenue (US$ Mn) Comparison, By Product Type
8.2.2. Revenue (US$ Mn) Comparison, By Technology Type
8.2.3. Revenue (US$ Mn) Comparison, By Application
8.2.4. Revenue (US$ Mn) Comparison, By Fuel Type
9. Latin America VVT & Start-Stop Systems Market Analysis and Forecast, By Country, 2012-2022
9.1. Brazil VVT & Start-Stop Systems Market Size and Forecast, 2012-2022
9.1.1. Revenue (US$ Mn) Comparison, By Product Type
9.1.2. Revenue (US$ Mn) Comparison, By Technology Type
9.1.3. Revenue (US$ Mn) Comparison, By Application
9.1.4. Revenue (US$ Mn) Comparison, By Fuel Type
9.2. Mexico VVT & Start-Stop Systems Market Size and Forecast, 2012-2022
9.2.1. Revenue (US$ Mn) Comparison, By Product Type
9.2.2. Revenue (US$ Mn) Comparison, By Technology Type
9.2.3. Revenue (US$ Mn) Comparison, By Application
9.2.4. Revenue (US$ Mn) Comparison, By Fuel Type
9.3. Argentina VVT & Start-Stop Systems Market Size and Forecast, 2012-2022
9.3.1. Revenue (US$ Mn) Comparison, By Product Type
9.3.2. Revenue (US$ Mn) Comparison, By Technology Type
9.3.3. Revenue (US$ Mn) Comparison, By Application
9.3.4. Revenue (US$ Mn) Comparison, By Fuel Type
10. Europe VVT & Start-Stop Systems Market Analysis and Forecast, By Country, 2012-2022
10.1. Germany VVT & Start-Stop Systems Market Size and Forecast, 2012-2022
10.1.1. Revenue (US$ Mn) Comparison, By Product Type
10.1.2. Revenue (US$ Mn) Comparison, By Technology Type
10.1.3. Revenue (US$ Mn) Comparison, By Application
10.1.4. Revenue (US$ Mn) Comparison, By Fuel Type
10.2. UK VVT & Start-Stop Systems Market Size and Forecast, 2012-2022
10.2.1. Revenue (US$ Mn) Comparison, By Product Type
10.2.2. Revenue (US$ Mn) Comparison, By Technology Type
10.2.3. Revenue (US$ Mn) Comparison, By Application
10.2.4. Revenue (US$ Mn) Comparison, By Fuel Type
10.3. France VVT & Start-Stop Systems Market Size and Forecast, 2012-2022
10.3.1. Revenue (US$ Mn) Comparison, By Product Type
10.3.2. Revenue (US$ Mn) Comparison, By Technology Type
10.3.3. Revenue (US$ Mn) Comparison, By Application
10.3.4. Revenue (US$ Mn) Comparison, By Fuel Type
10.4. Spain VVT & Start-Stop Systems Market Size and Forecast, 2012-2022
10.4.1. Revenue (US$ Mn) Comparison, By Product Type
10.4.2. Revenue (US$ Mn) Comparison, By Technology Type
10.4.3. Revenue (US$ Mn) Comparison, By Application
10.4.4. Revenue (US$ Mn) Comparison, By Fuel Type
10.5. Italy VVT & Start-Stop Systems Market Size and Forecast, 2012-2022
10.5.1. Revenue (US$ Mn) Comparison, By Product Type
10.5.2. Revenue (US$ Mn) Comparison, By Technology Type
10.5.3. Revenue (US$ Mn) Comparison, By Application
10.5.4. Revenue (US$ Mn) Comparison, By Fuel Type
10.6. Nordic VVT & Start-Stop Systems Market Size and Forecast, 2012-2022
10.6.1. Revenue (US$ Mn) Comparison, By Product Type
10.6.2. Revenue (US$ Mn) Comparison, By Technology Type
10.6.3. Revenue (US$ Mn) Comparison, By Application
10.6.4. Revenue (US$ Mn) Comparison, By Fuel Type
11. Japan VVT & Start-Stop Systems Market Analysis and Forecast, By Country, 2012-2022
11.1. Japan VVT & Start-Stop Systems Market Size and Forecast, 2012-2022
11.1.1. Revenue (US$ Mn) Comparison, By Product Type
11.1.2. Revenue (US$ Mn) Comparison, By Technology Type
11.1.3. Revenue (US$ Mn) Comparison, By Application
11.1.4. Revenue (US$ Mn) Comparison, By Fuel Type
12. APEJ VVT & Start-Stop Systems Market Analysis and Forecast, By Country, 2012-2022
12.1. China VVT & Start-Stop Systems Market Size and Forecast, 2012-2022
12.1.1. Revenue (US$ Mn) Comparison, By Product Type
12.1.2. Revenue (US$ Mn) Comparison, By Technology Type
12.1.3. Revenue (US$ Mn) Comparison, By Application
12.1.4. Revenue (US$ Mn) Comparison, By Fuel Type
12.2. India VVT & Start-Stop Systems Market Size and Forecast, 2012-2022
12.2.1. Revenue (US$ Mn) Comparison, By Product Type
12.2.2. Revenue (US$ Mn) Comparison, By Technology Type
12.2.3. Revenue (US$ Mn) Comparison, By Application
12.2.4. Revenue (US$ Mn) Comparison, By Fuel Type
12.3. Malaysia VVT & Start-Stop Systems Market Size and Forecast, 2012-2022
12.3.1. Revenue (US$ Mn) Comparison, By Product Type
12.3.2. Revenue (US$ Mn) Comparison, By Technology Type
12.3.3. Revenue (US$ Mn) Comparison, By Application
12.3.4. Revenue (US$ Mn) Comparison, By Fuel Type
12.4. Thailand VVT & Start-Stop Systems Market Size and Forecast, 2012-2022
12.4.1. Revenue (US$ Mn) Comparison, By Product Type
12.4.2. Revenue (US$ Mn) Comparison, By Technology Type
12.4.3. Revenue (US$ Mn) Comparison, By Application
12.4.4. Revenue (US$ Mn) Comparison, By Fuel Type
12.5. Singapore VVT & Start-Stop Systems Market Size and Forecast, 2012-2022
12.5.1. Revenue (US$ Mn) Comparison, By Product Type
12.5.2. Revenue (US$ Mn) Comparison, By Technology Type
12.5.3. Revenue (US$ Mn) Comparison, By Application
12.5.4. Revenue (US$ Mn) Comparison, By Fuel Type
12.6. Australia VVT & Start-Stop Systems Market Size and Forecast, 2012-2022
12.6.1. Revenue (US$ Mn) Comparison, By Product Type
12.6.2. Revenue (US$ Mn) Comparison, By Technology Type
12.6.3. Revenue (US$ Mn) Comparison, By Application
12.6.4. Revenue (US$ Mn) Comparison, By Fuel Type
13. MEA VVT & Start-Stop Systems Market Analysis and Forecast, By Country, 2012-2022
13.1. GCC Countries VVT & Start-Stop Systems Market Size and Forecast, 2012-2022
13.1.1. Revenue (US$ Mn) Comparison, By Product Type
13.1.2. Revenue (US$ Mn) Comparison, By Technology Type
13.1.3. Revenue (US$ Mn) Comparison, By Application
13.1.4. Revenue (US$ Mn) Comparison, By Fuel Type
13.2. South Africa VVT & Start-Stop Systems Market Size and Forecast, 2012-2022
13.2.1. Revenue (US$ Mn) Comparison, By Product Type
13.2.2. Revenue (US$ Mn) Comparison, By Technology Type
13.2.3. Revenue (US$ Mn) Comparison, By Application
13.2.4. Revenue (US$ Mn) Comparison, By Fuel Type
13.3. Nigeria VVT & Start-Stop Systems Market Size and Forecast, 2012-2022
13.3.1. Revenue (US$ Mn) Comparison, By Product Type
13.3.2. Revenue (US$ Mn) Comparison, By Technology Type
13.3.3. Revenue (US$ Mn) Comparison, By Application
13.3.4. Revenue (US$ Mn) Comparison, By Fuel Type
13.4. Israel VVT & Start-Stop Systems Market Size and Forecast, 2012-2022
13.4.1. Revenue (US$ Mn) Comparison, By Product Type
13.4.2. Revenue (US$ Mn) Comparison, By Technology Type
13.4.3. Revenue (US$ Mn) Comparison, By Application
13.4.4. Revenue (US$ Mn) Comparison, By Fuel Type
14. Global VVT & Start-Stop Systems Market Company Share, Competition Landscape and Company Profiles
14.1. Company Share Analysis
14.2. Competition Landscape
14.3. Company Profiles
14.3.1. Mitsubishi Electric Corporation
14.3.2. Robert Bosch GmbH
14.3.3. Continental AG
14.3.4. Delphi Automotive PLC
14.3.5. Hitachi Ltd.
14.3.6. Johnson Controls, Inc
14.3.7. Denso Corporation
14.3.8. Aisin Seiki Co. Ltd.
14.3.9. Valeo S.A.
14.3.10. Schaeffler AG
15. Research Methodology
16. Secondary and Primary Sources
17. Assumptions and Acronyms
18. Disclaimer
List of Tables
TABLE 1 Global VVT & Start-Stop Systems Market Value (US$ Mn), 2012-2016
TABLE 2 Global VVT & Start-Stop Systems Market Value (US$ Mn), 2017-2022
TABLE 3 Global VVT & Start-Stop Systems Market Value (US$ Mn) and Y-o-Y, 2015-2022
TABLE 4 Global Dual Over Head Cam (DOHC) Segment Value (US$ Mn), By Region 2012-2016
TABLE 5 Global Dual Over Head Cam (DOHC) Segment Value (US$ Mn), By Region 2017-2022
TABLE 6 Global Dual Over Head Cam (DOHC) Segment Market Share, By Region 2012-2016
TABLE 7 Global Dual Over Head Cam (DOHC) Segment Market Share, By Region 2017-2022
TABLE 8 Global Dual Over Head Cam (DOHC) Segment Y-o-Y, By Region 2015-2022
TABLE 9 Global Single Over Head Cam (SOHC) Segment Value (US$ Mn), By Region 2012-2016
TABLE 10 Global Single Over Head Cam (SOHC) Segment Value (US$ Mn), By Region 2017-2022
TABLE 11 Global Single Over Head Cam (SOHC) Segment Market Share, By Region 2012-2016
TABLE 12 Global Single Over Head Cam (SOHC) Segment Market Share, By Region 2017-2022
TABLE 13 Global Single Over Head Cam (SOHC) Segment Y-o-Y, By Region 2015-2022
TABLE 14 Global Cam Phasing Segment Value (US$ Mn), By Region 2012-2016
TABLE 15 Global Cam Phasing Segment Value (US$ Mn), By Region 2017-2022
TABLE 16 Global Cam Phasing Segment Market Share, By Region 2012-2016
TABLE 17 Global Cam Phasing Segment Market Share, By Region 2017-2022
TABLE 18 Global Cam Phasing Segment Y-o-Y, By Region 2015-2022
TABLE 19 Global Cam phasing plus changing Segment Value (US$ Mn), By Region 2012-2016
TABLE 20 Global Cam phasing plus changing Segment Value (US$ Mn), By Region 2017-2022
TABLE 21 Global Cam phasing plus changing Segment Market Share, By Region 2012-2016
TABLE 22 Global Cam phasing plus changing Segment Market Share, By Region 2017-2022
TABLE 23 Global Cam phasing plus changing Segment Y-o-Y, By Region 2015-2022
TABLE 24 Global Belt-driven alternator starter Segment Value (US$ Mn), By Region 2012-2016
TABLE 25 Global Belt-driven alternator starter Segment Value (US$ Mn), By Region 2017-2022
TABLE 26 Global Belt-driven alternator starter Segment Market Share, By Region 2012-2016
TABLE 27 Global Belt-driven alternator starter Segment Market Share, By Region 2017-2022
TABLE 28 Global Belt-driven alternator starter Segment Y-o-Y, By Region 2015-2022
TABLE 29 Global Direct starter Segment Value (US$ Mn), By Region 2012-2016
TABLE 30 Global Direct starter Segment Value (US$ Mn), By Region 2017-2022
TABLE 31 Global Direct starter Segment Market Share, By Region 2012-2016
TABLE 32 Global Direct starter Segment Market Share, By Region 2017-2022
TABLE 33 Global Direct starter Segment Y-o-Y, By Region 2015-2022
TABLE 34 Global Enhanced starter Segment Value (US$ Mn), By Region 2012-2016
TABLE 35 Global Enhanced starter Segment Value (US$ Mn), By Region 2017-2022
TABLE 36 Global Enhanced starter Segment Market Share, By Region 2012-2016
TABLE 37 Global Enhanced starter Segment Market Share, By Region 2017-2022
TABLE 38 Global Enhanced starter Segment Y-o-Y, By Region 2015-2022
TABLE 39 Global Integrated starter generator Segment Value (US$ Mn), By Region 2012-2016
TABLE 40 Global Integrated starter generator Segment Value (US$ Mn), By Region 2017-2022
TABLE 41 Global Integrated starter generator Segment Market Share, By Region 2012-2016
TABLE 42 Global Integrated starter generator Segment Market Share, By Region 2017-2022
TABLE 43 Global Integrated starter generator Segment Y-o-Y, By Region 2015-2022
TABLE 44 Global Compact Passenger Cars Segment Value (US$ Mn), By Region 2012-2016
TABLE 45 Global Compact Passenger Cars Segment Value (US$ Mn), By Region 2017-2022
TABLE 46 Global Compact Passenger Cars Segment Market Share, By Region 2012-2016
TABLE 47 Global Compact Passenger Cars Segment Market Share, By Region 2017-2022
TABLE 48 Global Compact Passenger Cars Segment Y-o-Y, By Region 2015-2022
TABLE 49 Global Mid-sized Passenger Cars Segment Value (US$ Mn), By Region 2012-2016
TABLE 50 Global Mid-sized Passenger Cars Segment Value (US$ Mn), By Region 2017-2022
TABLE 51 Global Mid-sized Passenger Cars Segment Market Share, By Region 2012-2016
TABLE 52 Global Mid-sized Passenger Cars Segment Market Share, By Region 2017-2022
TABLE 53 Global Mid-sized Passenger Cars Segment Y-o-Y, By Region 2015-2022
TABLE 54 Global Premium Passenger Cars Segment Value (US$ Mn), By Region 2012-2016
TABLE 55 Global Premium Passenger Cars Segment Value (US$ Mn), By Region 2017-2022
TABLE 56 Global Premium Passenger Cars Segment Market Share, By Region 2012-2016
TABLE 57 Global Premium Passenger Cars Segment Market Share, By Region 2017-2022
TABLE 58 Global Premium Passenger Cars Segment Y-o-Y, By Region 2015-2022
TABLE 59 Global Luxury Passenger Cars Segment Value (US$ Mn), By Region 2012-2016
TABLE 60 Global Luxury Passenger Cars Segment Value (US$ Mn), By Region 2017-2022
TABLE 61 Global Luxury Passenger Cars Segment Market Share, By Region 2012-2016
TABLE 62 Global Luxury Passenger Cars Segment Market Share, By Region 2017-2022
TABLE 63 Global Luxury Passenger Cars Segment Y-o-Y, By Region 2015-2022
TABLE 64 Global Light Commercial Vehicles Segment Value (US$ Mn), By Region 2012-2016
TABLE 65 Global Light Commercial Vehicles Segment Value (US$ Mn), By Region 2017-2022
TABLE 66 Global Light Commercial Vehicles Segment Market Share, By Region 2012-2016
TABLE 67 Global Light Commercial Vehicles Segment Market Share, By Region 2017-2022
TABLE 68 Global Light Commercial Vehicles Segment Y-o-Y, By Region 2015-2022
TABLE 69 Global Heavy Commercial Vehicles Segment Value (US$ Mn), By Region 2012-2016
TABLE 70 Global Heavy Commercial Vehicles Segment Value (US$ Mn), By Region 2017-2022
TABLE 71 Global Heavy Commercial Vehicles Segment Market Share, By Region 2012-2016
TABLE 72 Global Heavy Commercial Vehicles Segment Market Share, By Region 2017-2022
TABLE 73 Global Heavy Commercial Vehicles Segment Y-o-Y, By Region 2015-2022
TABLE 74 Global Gasoline Segment Value (US$ Mn), By Region 2012-2016
TABLE 75 Global Gasoline Segment Value (US$ Mn), By Region 2017-2022
TABLE 76 Global Gasoline Segment Market Share, By Region 2012-2016
TABLE 77 Global Gasoline Segment Market Share, By Region 2017-2022
TABLE 78 Global Gasoline Segment Y-o-Y, By Region 2015-2022
TABLE 79 Global Diesel Segment Value (US$ Mn), By Region 2012-2016
TABLE 80 Global Diesel Segment Value (US$ Mn), By Region 2017-2022
TABLE 81 Global Diesel Segment Market Share, By Region 2012-2016
TABLE 82 Global Diesel Segment Market Share, By Region 2017-2022
TABLE 83 Global Diesel Segment Y-o-Y, By Region 2015-2022
TABLE 84 North America VVT & Start-Stop Systems Market Value (US$ Mn), By Product Type 2012-2016
TABLE 85 North America VVT & Start-Stop Systems Market Value (US$ Mn), By Product Type 2017-2022
TABLE 86 North America VVT & Start-Stop Systems Market Value (US$ Mn), By Technology Type 2012-2016
TABLE 87 North America VVT & Start-Stop Systems Market Value (US$ Mn), By Technology Type 2017-2022
TABLE 88 North America VVT & Start-Stop Systems Market Value (US$ Mn), By Application 2012-2016
TABLE 89 North America VVT & Start-Stop Systems Market Value (US$ Mn), By Application 2017-2022
TABLE 90 North America VVT & Start-Stop Systems Market Value (US$ Mn), By Fuel Type 2012-2016
TABLE 91 North America VVT & Start-Stop Systems Market Value (US$ Mn), By Fuel Type 2017-2022
TABLE 92 Latin America VVT & Start-Stop Systems Market Value (US$ Mn), By Product Type 2012-2016
TABLE 93 Latin America VVT & Start-Stop Systems Market Value (US$ Mn), By Product Type 2017-2022
TABLE 94 Latin America VVT & Start-Stop Systems Market Value (US$ Mn), By Technology Type 2012-2016
TABLE 95 Latin America VVT & Start-Stop Systems Market Value (US$ Mn), By Technology Type 2017-2022
TABLE 96 Latin America VVT & Start-Stop Systems Market Value (US$ Mn), By Application 2012-2016
TABLE 97 Latin America VVT & Start-Stop Systems Market Value (US$ Mn), By Application 2017-2022
TABLE 98 Latin America VVT & Start-Stop Systems Market Value (US$ Mn), By Fuel Type 2012-2016
TABLE 99 Latin America VVT & Start-Stop Systems Market Value (US$ Mn), By Fuel Type 2017-2022
TABLE 100 Europe VVT & Start-Stop Systems Market Value (US$ Mn), By Product Type 2012-2016
TABLE 101 Europe VVT & Start-Stop Systems Market Value (US$ Mn), By Product Type 2017-2022
TABLE 102 Europe VVT & Start-Stop Systems Market Value (US$ Mn), By Technology Type 2012-2016
TABLE 103 Europe VVT & Start-Stop Systems Market Value (US$ Mn), By Technology Type 2017-2022
TABLE 104 Europe VVT & Start-Stop Systems Market Value (US$ Mn), By Application 2012-2016
TABLE 105 Europe VVT & Start-Stop Systems Market Value (US$ Mn), By Application 2017-2022
TABLE 106 Europe VVT & Start-Stop Systems Market Value (US$ Mn), By Fuel Type 2012-2016
TABLE 107 Europe VVT & Start-Stop Systems Market Value (US$ Mn), By Fuel Type 2017-2022
TABLE 108 Japan VVT & Start-Stop Systems Market Value (US$ Mn), By Product Type 2012-2016
TABLE 109 Japan VVT & Start-Stop Systems Market Value (US$ Mn), By Product Type 2017-2022
TABLE 110 Japan VVT & Start-Stop Systems Market Value (US$ Mn), By Technology Type 2012-2016
TABLE 111 Japan VVT & Start-Stop Systems Market Value (US$ Mn), By Technology Type 2017-2022
TABLE 112 Japan VVT & Start-Stop Systems Market Value (US$ Mn), By Application 2012-2016
TABLE 113 Japan VVT & Start-Stop Systems Market Value (US$ Mn), By Application 2017-2022
TABLE 114 Japan VVT & Start-Stop Systems Market Value (US$ Mn), By Fuel Type 2012-2016
TABLE 115 Japan VVT & Start-Stop Systems Market Value (US$ Mn), By Fuel Type 2017-2022
TABLE 116 APEJ VVT & Start-Stop Systems Market Value (US$ Mn), By Product Type 2012-2016
TABLE 117 APEJ VVT & Start-Stop Systems Market Value (US$ Mn), By Product Type 2017-2022
TABLE 118 APEJ VVT & Start-Stop Systems Market Value (US$ Mn), By Technology Type 2012-2016
TABLE 119 APEJ VVT & Start-Stop Systems Market Value (US$ Mn), By Technology Type 2017-2022
TABLE 120 APEJ VVT & Start-Stop Systems Market Value (US$ Mn), By Application 2012-2016
TABLE 121 APEJ VVT & Start-Stop Systems Market Value (US$ Mn), By Application 2017-2022
TABLE 122 APEJ VVT & Start-Stop Systems Market Value (US$ Mn), By Fuel Type 2012-2016
TABLE 123 APEJ VVT & Start-Stop Systems Market Value (US$ Mn), By Fuel Type 2017-2022
TABLE 124 MEA VVT & Start-Stop Systems Market Value (US$ Mn), By Product Type 2012-2016
TABLE 125 MEA VVT & Start-Stop Systems Market Value (US$ Mn), By Product Type 2017-2022
TABLE 126 MEA VVT & Start-Stop Systems Market Value (US$ Mn), By Technology Type 2012-2016
TABLE 127 MEA VVT & Start-Stop Systems Market Value (US$ Mn), By Technology Type 2017-2022
TABLE 128 MEA VVT & Start-Stop Systems Market Value (US$ Mn), By Application 2012-2016
TABLE 129 MEA VVT & Start-Stop Systems Market Value (US$ Mn), By Application 2017-2022
TABLE 130 MEA VVT & Start-Stop Systems Market Value (US$ Mn), By Fuel Type 2012-2016
TABLE 131 MEA VVT & Start-Stop Systems Market Value (US$ Mn), By Fuel Type 2017-2022
TABLE 132 US VVT & Start-Stop Systems Market Value (US$ Mn), By Product Type 2012-2016
TABLE 133 US VVT & Start-Stop Systems Market Value (US$ Mn), By Product Type 2017-2022
TABLE 134 US VVT & Start-Stop Systems Market Value (US$ Mn), By Technology Type 2012-2016
TABLE 135 US VVT & Start-Stop Systems Market Value (US$ Mn), By Technology Type 2017-2022
TABLE 136 US VVT & Start-Stop Systems Market Value (US$ Mn), By Application 2012-2016
TABLE 137 US VVT & Start-Stop Systems Market Value (US$ Mn), By Application 2017-2022
TABLE 138 US VVT & Start-Stop Systems Market Value (US$ Mn), By Fuel Type 2012-2016
TABLE 139 US VVT & Start-Stop Systems Market Value (US$ Mn), By Fuel Type 2017-2022
TABLE 140 Canada VVT & Start-Stop Systems Market Value (US$ Mn), By Product Type 2012-2016
TABLE 141 Canada VVT & Start-Stop Systems Market Value (US$ Mn), By Product Type 2017-2022
TABLE 142 Canada VVT & Start-Stop Systems Market Value (US$ Mn), By Technology Type 2012-2016
TABLE 143 Canada VVT & Start-Stop Systems Market Value (US$ Mn), By Technology Type 2017-2022
TABLE 144 Canada VVT & Start-Stop Systems Market Value (US$ Mn), By Application 2012-2016
TABLE 145 Canada VVT & Start-Stop Systems Market Value (US$ Mn), By Application 2017-2022
TABLE 146 Canada VVT & Start-Stop Systems Market Value (US$ Mn), By Fuel Type 2012-2016
TABLE 147 Canada VVT & Start-Stop Systems Market Value (US$ Mn), By Fuel Type 2017-2022
TABLE 148 Brazil VVT & Start-Stop Systems Market Value (US$ Mn), By Product Type 2012-2016
TABLE 149 Brazil VVT & Start-Stop Systems Market Value (US$ Mn), By Product Type 2017-2022
TABLE 150 Brazil VVT & Start-Stop Systems Market Value (US$ Mn), By Technology Type 2012-2016
TABLE 151 Brazil VVT & Start-Stop Systems Market Value (US$ Mn), By Technology Type 2017-2022
TABLE 152 Brazil VVT & Start-Stop Systems Market Value (US$ Mn), By Application 2012-2016
TABLE 153 Brazil VVT & Start-Stop Systems Market Value (US$ Mn), By Application 2017-2022
TABLE 154 Brazil VVT & Start-Stop Systems Market Value (US$ Mn), By Fuel Type 2012-2016
TABLE 155 Brazil VVT & Start-Stop Systems Market Value (US$ Mn), By Fuel Type 2017-2022
TABLE 156 Mexico VVT & Start-Stop Systems Market Value (US$ Mn), By Product Type 2012-2016
TABLE 157 Mexico VVT & Start-Stop Systems Market Value (US$ Mn), By Product Type 2017-2022
TABLE 158 Mexico VVT & Start-Stop Systems Market Value (US$ Mn), By Technology Type 2012-2016
TABLE 159 Mexico VVT & Start-Stop Systems Market Value (US$ Mn), By Technology Type 2017-2022
TABLE 160 Mexico VVT & Start-Stop Systems Market Value (US$ Mn), By Application 2012-2016
TABLE 161 Mexico VVT & Start-Stop Systems Market Value (US$ Mn), By Application 2017-2022
TABLE 162 Mexico VVT & Start-Stop Systems Market Value (US$ Mn), By Fuel Type 2012-2016
TABLE 163 Mexico VVT & Start-Stop Systems Market Value (US$ Mn), By Fuel Type 2017-2022
TABLE 164 Argentina VVT & Start-Stop Systems Market Value (US$ Mn), By Product Type 2012-2016
TABLE 165 Argentina VVT & Start-Stop Systems Market Value (US$ Mn), By Product Type 2017-2022
TABLE 166 Argentina VVT & Start-Stop Systems Market Value (US$ Mn), By Technology Type 2012-2016
TABLE 167 Argentina VVT & Start-Stop Systems Market Value (US$ Mn), By Technology Type 2017-2022
TABLE 168 Argentina VVT & Start-Stop Systems Market Value (US$ Mn), By Application 2012-2016
TABLE 169 Argentina VVT & Start-Stop Systems Market Value (US$ Mn), By Application 2017-2022
TABLE 170 Argentina VVT & Start-Stop Systems Market Value (US$ Mn), By Fuel Type 2012-2016
TABLE 171 Argentina VVT & Start-Stop Systems Market Value (US$ Mn), By Fuel Type 2017-2022
TABLE 172 Germany VVT & Start-Stop Systems Market Value (US$ Mn), By Product Type 2012-2016
TABLE 173 Germany VVT & Start-Stop Systems Market Value (US$ Mn), By Product Type 2017-2022
TABLE 174 Germany VVT & Start-Stop Systems Market Value (US$ Mn), By Technology Type 2012-2016
TABLE 175 Germany VVT & Start-Stop Systems Market Value (US$ Mn), By Technology Type 2017-2022
TABLE 176 Germany VVT & Start-Stop Systems Market Value (US$ Mn), By Application 2012-2016
TABLE 177 Germany VVT & Start-Stop Systems Market Value (US$ Mn), By Application 2017-2022
TABLE 178 Germany VVT & Start-Stop Systems Market Value (US$ Mn), By Fuel Type 2012-2016
TABLE 179 Germany VVT & Start-Stop Systems Market Value (US$ Mn), By Fuel Type 2017-2022
TABLE 180 UK VVT & Start-Stop Systems Market Value (US$ Mn), By Product Type 2012-2016
TABLE 181 UK VVT & Start-Stop Systems Market Value (US$ Mn), By Product Type 2017-2022
TABLE 182 UK VVT & Start-Stop Systems Market Value (US$ Mn), By Technology Type 2012-2016
TABLE 183 UK VVT & Start-Stop Systems Market Value (US$ Mn), By Technology Type 2017-2022
TABLE 184 UK VVT & Start-Stop Systems Market Value (US$ Mn), By Application 2012-2016
TABLE 185 UK VVT & Start-Stop Systems Market Value (US$ Mn), By Application 2017-2022
TABLE 186 UK VVT & Start-Stop Systems Market Value (US$ Mn), By Fuel Type 2012-2016
TABLE 187 UK VVT & Start-Stop Systems Market Value (US$ Mn), By Fuel Type 2017-2022
TABLE 188 France VVT & Start-Stop Systems Market Value (US$ Mn), By Product Type 2012-2016
TABLE 189 France VVT & Start-Stop Systems Market Value (US$ Mn), By Product Type 2017-2022
TABLE 190 France VVT & Start-Stop Systems Market Value (US$ Mn), By Technology Type 2012-2016
TABLE 191 France VVT & Start-Stop Systems Market Value (US$ Mn), By Technology Type 2017-2022
TABLE 192 France VVT & Start-Stop Systems Market Value (US$ Mn), By Application 2012-2016
TABLE 193 France VVT & Start-Stop Systems Market Value (US$ Mn), By Application 2017-2022
TABLE 194 France VVT & Start-Stop Systems Market Value (US$ Mn), By Fuel Type 2012-2016
TABLE 195 France VVT & Start-Stop Systems Market Value (US$ Mn), By Fuel Type 2017-2022
TABLE 196 Spain VVT & Start-Stop Systems Market Value (US$ Mn), By Product Type 2012-2016
TABLE 197 Spain VVT & Start-Stop Systems Market Value (US$ Mn), By Product Type 2017-2022
TABLE 198 Spain VVT & Start-Stop Systems Market Value (US$ Mn), By Technology Type 2012-2016
TABLE 199 Spain VVT & Start-Stop Systems Market Value (US$ Mn), By Technology Type 2017-2022
TABLE 200 Spain VVT & Start-Stop Systems Market Value (US$ Mn), By Application 2012-2016
TABLE 201 Spain VVT & Start-Stop Systems Market Value (US$ Mn), By Application 2017-2022
TABLE 202 Spain VVT & Start-Stop Systems Market Value (US$ Mn), By Fuel Type 2012-2016
TABLE 203 Spain VVT & Start-Stop Systems Market Value (US$ Mn), By Fuel Type 2017-2022
TABLE 204 Italy VVT & Start-Stop Systems Market Value (US$ Mn), By Product Type 2012-2016
TABLE 205 Italy VVT & Start-Stop Systems Market Value (US$ Mn), By Product Type 2017-2022
TABLE 206 Italy VVT & Start-Stop Systems Market Value (US$ Mn), By Technology Type 2012-2016
TABLE 207 Italy VVT & Start-Stop Systems Market Value (US$ Mn), By Technology Type 2017-2022
TABLE 208 Italy VVT & Start-Stop Systems Market Value (US$ Mn), By Application 2012-2016
TABLE 209 Italy VVT & Start-Stop Systems Market Value (US$ Mn), By Application 2017-2022
TABLE 210 Italy VVT & Start-Stop Systems Market Value (US$ Mn), By Fuel Type 2012-2016
TABLE 211 Italy VVT & Start-Stop Systems Market Value (US$ Mn), By Fuel Type 2017-2022
TABLE 212 Nordic VVT & Start-Stop Systems Market Value (US$ Mn), By Product Type 2012-2016
TABLE 213 Nordic VVT & Start-Stop Systems Market Value (US$ Mn), By Product Type 2017-2022
TABLE 214 Nordic VVT & Start-Stop Systems Market Value (US$ Mn), By Technology Type 2012-2016
TABLE 215 Nordic VVT & Start-Stop Systems Market Value (US$ Mn), By Technology Type 2017-2022
TABLE 216 Nordic VVT & Start-Stop Systems Market Value (US$ Mn), By Application 2012-2016
TABLE 217 Nordic VVT & Start-Stop Systems Market Value (US$ Mn), By Application 2017-2022
TABLE 218 Nordic VVT & Start-Stop Systems Market Value (US$ Mn), By Fuel Type 2012-2016
TABLE 219 Nordic VVT & Start-Stop Systems Market Value (US$ Mn), By Fuel Type 2017-2022
TABLE 220 Japan VVT & Start-Stop Systems Market Value (US$ Mn), By Product Type 2012-2016
TABLE 221 Japan VVT & Start-Stop Systems Market Value (US$ Mn), By Product Type 2017-2022
TABLE 222 Japan VVT & Start-Stop Systems Market Value (US$ Mn), By Technology Type 2012-2016
TABLE 223 Japan VVT & Start-Stop Systems Market Value (US$ Mn), By Technology Type 2017-2022
TABLE 224 Japan VVT & Start-Stop Systems Market Value (US$ Mn), By Application 2012-2016
TABLE 225 Japan VVT & Start-Stop Systems Market Value (US$ Mn), By Application 2017-2022
TABLE 226 Japan VVT & Start-Stop Systems Market Value (US$ Mn), By Fuel Type 2012-2016
TABLE 227 Japan VVT & Start-Stop Systems Market Value (US$ Mn), By Fuel Type 2017-2022
TABLE 228 China VVT & Start-Stop Systems Market Value (US$ Mn), By Product Type 2012-2016
TABLE 229 China VVT & Start-Stop Systems Market Value (US$ Mn), By Product Type 2017-2022
TABLE 230 China VVT & Start-Stop Systems Market Value (US$ Mn), By Technology Type 2012-2016
TABLE 231 China VVT & Start-Stop Systems Market Value (US$ Mn), By Technology Type 2017-2022
TABLE 232 China VVT & Start-Stop Systems Market Value (US$ Mn), By Application 2012-2016
TABLE 233 China VVT & Start-Stop Systems Market Value (US$ Mn), By Application 2017-2022
TABLE 234 China VVT & Start-Stop Systems Market Value (US$ Mn), By Fuel Type 2012-2016
TABLE 235 China VVT & Start-Stop Systems Market Value (US$ Mn), By Fuel Type 2017-2022
TABLE 236 India VVT & Start-Stop Systems Market Value (US$ Mn), By Product Type 2012-2016
TABLE 237 India VVT & Start-Stop Systems Market Value (US$ Mn), By Product Type 2017-2022
TABLE 238 India VVT & Start-Stop Systems Market Value (US$ Mn), By Technology Type 2012-2016
TABLE 239 India VVT & Start-Stop Systems Market Value (US$ Mn), By Technology Type 2017-2022
TABLE 240 India VVT & Start-Stop Systems Market Value (US$ Mn), By Application 2012-2016
TABLE 241 India VVT & Start-Stop Systems Market Value (US$ Mn), By Application 2017-2022
TABLE 242 India VVT & Start-Stop Systems Market Value (US$ Mn), By Fuel Type 2012-2016
TABLE 243 India VVT & Start-Stop Systems Market Value (US$ Mn), By Fuel Type 2017-2022
TABLE 244 Malaysia VVT & Start-Stop Systems Market Value (US$ Mn), By Product Type 2012-2016
TABLE 245 Malaysia VVT & Start-Stop Systems Market Value (US$ Mn), By Product Type 2017-2022
TABLE 246 Malaysia VVT & Start-Stop Systems Market Value (US$ Mn), By Technology Type 2012-2016
TABLE 247 Malaysia VVT & Start-Stop Systems Market Value (US$ Mn), By Technology Type 2017-2022
TABLE 248 Malaysia VVT & Start-Stop Systems Market Value (US$ Mn), By Application 2012-2016
TABLE 249 Malaysia VVT & Start-Stop Systems Market Value (US$ Mn), By Application 2017-2022
TABLE 250 Malaysia VVT & Start-Stop Systems Market Value (US$ Mn), By Fuel Type 2012-2016
TABLE 251 Malaysia VVT & Start-Stop Systems Market Value (US$ Mn), By Fuel Type 2017-2022
TABLE 252 Thailand VVT & Start-Stop Systems Market Value (US$ Mn), By Product Type 2012-2016
TABLE 253 Thailand VVT & Start-Stop Systems Market Value (US$ Mn), By Product Type 2017-2022
TABLE 254 Thailand VVT & Start-Stop Systems Market Value (US$ Mn), By Technology Type 2012-2016
TABLE 255 Thailand VVT & Start-Stop Systems Market Value (US$ Mn), By Technology Type 2017-2022
TABLE 256 Thailand VVT & Start-Stop Systems Market Value (US$ Mn), By Application 2012-2016
TABLE 257 Thailand VVT & Start-Stop Systems Market Value (US$ Mn), By Application 2017-2022
TABLE 258 Thailand VVT & Start-Stop Systems Market Value (US$ Mn), By Fuel Type 2012-2016
TABLE 259 Thailand VVT & Start-Stop Systems Market Value (US$ Mn), By Fuel Type 2017-2022
TABLE 260 Singapore VVT & Start-Stop Systems Market Value (US$ Mn), By Product Type 2012-2016
TABLE 261 Singapore VVT & Start-Stop Systems Market Value (US$ Mn), By Product Type 2017-2022
TABLE 262 Singapore VVT & Start-Stop Systems Market Value (US$ Mn), By Technology Type 2012-2016
TABLE 263 Singapore VVT & Start-Stop Systems Market Value (US$ Mn), By Technology Type 2017-2022
TABLE 264 Singapore VVT & Start-Stop Systems Market Value (US$ Mn), By Application 2012-2016
TABLE 265 Singapore VVT & Start-Stop Systems Market Value (US$ Mn), By Application 2017-2022
TABLE 266 Singapore VVT & Start-Stop Systems Market Value (US$ Mn), By Fuel Type 2012-2016
TABLE 267 Singapore VVT & Start-Stop Systems Market Value (US$ Mn), By Fuel Type 2017-2022
TABLE 268 Australia VVT & Start-Stop Systems Market Value (US$ Mn), By Product Type 2012-2016
TABLE 269 Australia VVT & Start-Stop Systems Market Value (US$ Mn), By Product Type 2017-2022
TABLE 270 Australia VVT & Start-Stop Systems Market Value (US$ Mn), By Technology Type 2012-2016
TABLE 271 Australia VVT & Start-Stop Systems Market Value (US$ Mn), By Technology Type 2017-2022
TABLE 272 Australia VVT & Start-Stop Systems Market Value (US$ Mn), By Application 2012-2016
TABLE 273 Australia VVT & Start-Stop Systems Market Value (US$ Mn), By Application 2017-2022
TABLE 274 Australia VVT & Start-Stop Systems Market Value (US$ Mn), By Fuel Type 2012-2016
TABLE 275 Australia VVT & Start-Stop Systems Market Value (US$ Mn), By Fuel Type 2017-2022
TABLE 276 GCC Countries VVT & Start-Stop Systems Market Value (US$ Mn), By Product Type 2012-2016
TABLE 277 GCC Countries VVT & Start-Stop Systems Market Value (US$ Mn), By Product Type 2017-2022
TABLE 278 GCC Countries VVT & Start-Stop Systems Market Value (US$ Mn), By Technology Type 2012-2016
TABLE 279 GCC Countries VVT & Start-Stop Systems Market Value (US$ Mn), By Technology Type 2017-2022
TABLE 280 GCC Countries VVT & Start-Stop Systems Market Value (US$ Mn), By Application 2012-2016
TABLE 281 GCC Countries VVT & Start-Stop Systems Market Value (US$ Mn), By Application 2017-2022
TABLE 282 GCC Countries VVT & Start-Stop Systems Market Value (US$ Mn), By Fuel Type 2012-2016
TABLE 283 GCC Countries VVT & Start-Stop Systems Market Value (US$ Mn), By Fuel Type 2017-2022
TABLE 284 South Africa VVT & Start-Stop Systems Market Value (US$ Mn), By Product Type 2012-2016
TABLE 285 South Africa VVT & Start-Stop Systems Market Value (US$ Mn), By Product Type 2017-2022
TABLE 286 South Africa VVT & Start-Stop Systems Market Value (US$ Mn), By Technology Type 2012-2016
TABLE 287 South Africa VVT & Start-Stop Systems Market Value (US$ Mn), By Technology Type 2017-2022
TABLE 288 South Africa VVT & Start-Stop Systems Market Value (US$ Mn), By Application 2012-2016
TABLE 289 South Africa VVT & Start-Stop Systems Market Value (US$ Mn), By Application 2017-2022
TABLE 290 South Africa VVT & Start-Stop Systems Market Value (US$ Mn), By Fuel Type 2012-2016
TABLE 291 South Africa VVT & Start-Stop Systems Market Value (US$ Mn), By Fuel Type 2017-2022
TABLE 292 Nigeria VVT & Start-Stop Systems Market Value (US$ Mn), By Product Type 2012-2016
TABLE 293 Nigeria VVT & Start-Stop Systems Market Value (US$ Mn), By Product Type 2017-2022
TABLE 294 Nigeria VVT & Start-Stop Systems Market Value (US$ Mn), By Technology Type 2012-2016
TABLE 295 Nigeria VVT & Start-Stop Systems Market Value (US$ Mn), By Technology Type 2017-2022
TABLE 296 Nigeria VVT & Start-Stop Systems Market Value (US$ Mn), By Application 2012-2016
TABLE 297 Nigeria VVT & Start-Stop Systems Market Value (US$ Mn), By Application 2017-2022
TABLE 298 Nigeria VVT & Start-Stop Systems Market Value (US$ Mn), By Fuel Type 2012-2016
TABLE 299 Nigeria VVT & Start-Stop Systems Market Value (US$ Mn), By Fuel Type 2017-2022
TABLE 300 Israel VVT & Start-Stop Systems Market Value (US$ Mn), By Product Type 2012-2016
TABLE 301 Israel VVT & Start-Stop Systems Market Value (US$ Mn), By Product Type 2017-2022
TABLE 302 Israel VVT & Start-Stop Systems Market Value (US$ Mn), By Technology Type 2012-2016
TABLE 303 Israel VVT & Start-Stop Systems Market Value (US$ Mn), By Technology Type 2017-2022
TABLE 304 Israel VVT & Start-Stop Systems Market Value (US$ Mn), By Application 2012-2016
TABLE 305 Israel VVT & Start-Stop Systems Market Value (US$ Mn), By Application 2017-2022
TABLE 306 Israel VVT & Start-Stop Systems Market Value (US$ Mn), By Fuel Type 2012-2016
TABLE 307 Israel VVT & Start-Stop Systems Market Value (US$ Mn), By Fuel Type 2017-2022
List of Figures
FIG. 1 Global VVT & Start-Stop Systems Market Value (US$ Mn), 2012-2016
FIG. 2 Global VVT & Start-Stop Systems Market Value (US$ Mn) Forecast, 2017-2022
FIG. 3 Global VVT & Start-Stop Systems Market Value (US$ Mn) and Y-o-Y, 2015-2022
FIG. 4 Global Dual Over Head Cam (DOHC) Segment Market Value (US$ Mn) By Region, 2012-2016
FIG. 5 Global Dual Over Head Cam (DOHC) Segment Market Value (US$ Mn) By Region, 2017-2022
FIG. 6 Global Dual Over Head Cam (DOHC) Segment Y-o-Y Growth Rate, By Region, 2015-2022
FIG. 7 Global Single Over Head Cam (SOHC) Segment Market Value (US$ Mn) By Region, 2012-2016
FIG. 8 Global Single Over Head Cam (SOHC) Segment Market Value (US$ Mn) By Region, 2017-2022
FIG. 9 Global Single Over Head Cam (SOHC) Segment Y-o-Y Growth Rate, By Region, 2015-2022
FIG. 10 Global Cam Phasing Segment Market Value (US$ Mn) By Region, 2012-2016
FIG. 11 Global Cam Phasing Segment Market Value (US$ Mn) By Region, 2017-2022
FIG. 12 Global Cam Phasing Segment Y-o-Y Growth Rate, By Region, 2015-2022
FIG. 13 Global Cam phasing plus changing Segment Market Value (US$ Mn) By Region, 2012-2016
FIG. 14 Global Cam phasing plus changing Segment Market Value (US$ Mn) By Region, 2017-2022
FIG. 15 Global Cam phasing plus changing Segment Y-o-Y Growth Rate, By Region, 2015-2022
FIG. 16 Global Belt-driven alternator starter Segment Market Value (US$ Mn) By Region, 2012-2016
FIG. 17 Global Belt-driven alternator starter Segment Market Value (US$ Mn) By Region, 2017-2022
FIG. 18 Global Belt-driven alternator starter Segment Y-o-Y Growth Rate, By Region, 2015-2022
FIG. 19 Global Direct starter Segment Market Value (US$ Mn) By Region, 2012-2016
FIG. 20 Global Direct starter Segment Market Value (US$ Mn) By Region, 2017-2022
FIG. 21 Global Direct starter Segment Y-o-Y Growth Rate, By Region, 2015-2022
FIG. 22 Global Enhanced starter Segment Market Value (US$ Mn) By Region, 2012-2016
FIG. 23 Global Enhanced starter Segment Market Value (US$ Mn) By Region, 2017-2022
FIG. 24 Global Enhanced starter Segment Y-o-Y Growth Rate, By Region, 2015-2022
FIG. 25 Global Integrated starter generator Segment Market Value (US$ Mn) By Region, 2012-2016
FIG. 26 Global Integrated starter generator Segment Market Value (US$ Mn) By Region, 2017-2022
FIG. 27 Global Integrated starter generator Segment Y-o-Y Growth Rate, By Region, 2015-2022
FIG. 28 Global Compact Passenger Cars Segment Market Value (US$ Mn) By Region, 2012-2016
FIG. 29 Global Compact Passenger Cars Segment Market Value (US$ Mn) By Region, 2017-2022
FIG. 30 Global Compact Passenger Cars Segment Y-o-Y Growth Rate, By Region, 2015-2022
FIG. 31 Global Mid-sized Passenger Cars Segment Market Value (US$ Mn) By Region, 2012-2016
FIG. 32 Global Mid-sized Passenger Cars Segment Market Value (US$ Mn) By Region, 2017-2022
FIG. 33 Global Mid-sized Passenger Cars Segment Y-o-Y Growth Rate, By Region, 2015-2022
FIG. 34 Global Premium Passenger Cars Segment Market Value (US$ Mn) By Region, 2012-2016
FIG. 35 Global Premium Passenger Cars Segment Market Value (US$ Mn) By Region, 2017-2022
FIG. 36 Global Premium Passenger Cars Segment Y-o-Y Growth Rate, By Region, 2015-2022
FIG. 37 Global Luxury Passenger Cars Segment Market Value (US$ Mn) By Region, 2012-2016
FIG. 38 Global Luxury Passenger Cars Segment Market Value (US$ Mn) By Region, 2017-2022
FIG. 39 Global Luxury Passenger Cars Segment Y-o-Y Growth Rate, By Region, 2015-2022
FIG. 40 Global Light Commercial Vehicles Segment Market Value (US$ Mn) By Region, 2012-2016
FIG. 41 Global Light Commercial Vehicles Segment Market Value (US$ Mn) By Region, 2017-2022
FIG. 42 Global Light Commercial Vehicles Segment Y-o-Y Growth Rate, By Region, 2015-2022
FIG. 43 Global Heavy Commercial Vehicles Segment Market Value (US$ Mn) By Region, 2012-2016
FIG. 44 Global Heavy Commercial Vehicles Segment Market Value (US$ Mn) By Region, 2017-2022
FIG. 45 Global Heavy Commercial Vehicles Segment Y-o-Y Growth Rate, By Region, 2015-2022
FIG. 46 Global Gasoline Segment Market Value (US$ Mn) By Region, 2012-2016
FIG. 47 Global Gasoline Segment Market Value (US$ Mn) By Region, 2017-2022
FIG. 48 Global Gasoline Segment Y-o-Y Growth Rate, By Region, 2015-2022
FIG. 49 Global Diesel Segment Market Value (US$ Mn) By Region, 2012-2016
FIG. 50 Global Diesel Segment Market Value (US$ Mn) By Region, 2017-2022
FIG. 51 Global Diesel Segment Y-o-Y Growth Rate, By Region, 2015-2022
FIG. 52 North America VVT & Start-Stop Systems Market Value (US$ Mn), By Product Type 2012-2016
FIG. 53 North America VVT & Start-Stop Systems Market Value (US$ Mn), By Product Type 2017-2022
FIG. 54 North America VVT & Start-Stop Systems Market Value (US$ Mn), By Technology Type 2012-2016
FIG. 55 North America VVT & Start-Stop Systems Market Value (US$ Mn), By Technology Type 2017-2022
FIG. 56 North America VVT & Start-Stop Systems Market Value (US$ Mn), By Application 2012-2016
FIG. 57 North America VVT & Start-Stop Systems Market Value (US$ Mn), By Application 2017-2022
FIG. 58 North America VVT & Start-Stop Systems Market Value (US$ Mn), By Fuel Type 2012-2016
FIG. 59 North America VVT & Start-Stop Systems Market Value (US$ Mn), By Fuel Type 2017-2022
FIG. 60 Latin America VVT & Start-Stop Systems Market Value (US$ Mn), By Product Type 2012-2016
FIG. 61 Latin America VVT & Start-Stop Systems Market Value (US$ Mn), By Product Type 2017-2022
FIG. 62 Latin America VVT & Start-Stop Systems Market Value (US$ Mn), By Technology Type 2012-2016
FIG. 63 Latin America VVT & Start-Stop Systems Market Value (US$ Mn), By Technology Type 2017-2022
FIG. 64 Latin America VVT & Start-Stop Systems Market Value (US$ Mn), By Application 2012-2016
FIG. 65 Latin America VVT & Start-Stop Systems Market Value (US$ Mn), By Application 2017-2022
FIG. 66 Latin America VVT & Start-Stop Systems Market Value (US$ Mn), By Fuel Type 2012-2016
FIG. 67 Latin America VVT & Start-Stop Systems Market Value (US$ Mn), By Fuel Type 2017-2022
FIG. 68 Europe VVT & Start-Stop Systems Market Value (US$ Mn), By Product Type 2012-2016
FIG. 69 Europe VVT & Start-Stop Systems Market Value (US$ Mn), By Product Type 2017-2022
FIG. 70 Europe VVT & Start-Stop Systems Market Value (US$ Mn), By Technology Type 2012-2016
FIG. 71 Europe VVT & Start-Stop Systems Market Value (US$ Mn), By Technology Type 2017-2022
FIG. 72 Europe VVT & Start-Stop Systems Market Value (US$ Mn), By Application 2012-2016
FIG. 73 Europe VVT & Start-Stop Systems Market Value (US$ Mn), By Application 2017-2022
FIG. 74 Europe VVT & Start-Stop Systems Market Value (US$ Mn), By Fuel Type 2012-2016
FIG. 75 Europe VVT & Start-Stop Systems Market Value (US$ Mn), By Fuel Type 2017-2022
FIG. 76 Japan VVT & Start-Stop Systems Market Value (US$ Mn), By Product Type 2012-2016
FIG. 77 Japan VVT & Start-Stop Systems Market Value (US$ Mn), By Product Type 2017-2022
FIG. 78 Japan VVT & Start-Stop Systems Market Value (US$ Mn), By Technology Type 2012-2016
FIG. 79 Japan VVT & Start-Stop Systems Market Value (US$ Mn), By Technology Type 2017-2022
FIG. 80 Japan VVT & Start-Stop Systems Market Value (US$ Mn), By Application 2012-2016
FIG. 81 Japan VVT & Start-Stop Systems Market Value (US$ Mn), By Application 2017-2022
FIG. 82 Japan VVT & Start-Stop Systems Market Value (US$ Mn), By Fuel Type 2012-2016
FIG. 83 Japan VVT & Start-Stop Systems Market Value (US$ Mn), By Fuel Type 2017-2022
FIG. 84 APEJ VVT & Start-Stop Systems Market Value (US$ Mn), By Product Type 2012-2016
FIG. 85 APEJ VVT & Start-Stop Systems Market Value (US$ Mn), By Product Type 2017-2022
FIG. 86 APEJ VVT & Start-Stop Systems Market Value (US$ Mn), By Technology Type 2012-2016
FIG. 87 APEJ VVT & Start-Stop Systems Market Value (US$ Mn), By Technology Type 2017-2022
FIG. 88 APEJ VVT & Start-Stop Systems Market Value (US$ Mn), By Application 2012-2016
FIG. 89 APEJ VVT & Start-Stop Systems Market Value (US$ Mn), By Application 2017-2022
FIG. 90 APEJ VVT & Start-Stop Systems Market Value (US$ Mn), By Fuel Type 2012-2016
FIG. 91 APEJ VVT & Start-Stop Systems Market Value (US$ Mn), By Fuel Type 2017-2022
FIG. 92 MEA VVT & Start-Stop Systems Market Value (US$ Mn), By Product Type 2012-2016
FIG. 93 MEA VVT & Start-Stop Systems Market Value (US$ Mn), By Product Type 2017-2022
FIG. 94 MEA VVT & Start-Stop Systems Market Value (US$ Mn), By Technology Type 2012-2016
FIG. 95 MEA VVT & Start-Stop Systems Market Value (US$ Mn), By Technology Type 2017-2022
FIG. 96 MEA VVT & Start-Stop Systems Market Value (US$ Mn), By Application 2012-2016
FIG. 97 MEA VVT & Start-Stop Systems Market Value (US$ Mn), By Application 2017-2022
FIG. 98 MEA VVT & Start-Stop Systems Market Value (US$ Mn), By Fuel Type 2012-2016
FIG. 99 MEA VVT & Start-Stop Systems Market Value (US$ Mn), By Fuel Type 2017-2022
Copyright © Transparency Market Research, Inc. All Rights reserved
Trust Online

VVT & Start-Stop Systems Market