
Reports
Reports
A Virtual Private Server (VPS) is a virtual machine (VM) that runs its specific copy of an operating system (OS) placed in a computer. It is traded as a service by different internet hosting service providers. It operates autonomously from other virtual spaces that are on the same machine. VPS hosting is mostly preferred by enterprises that wish to upgrade from shared hosting due to the need for more resources and control over the website. VPS is also used in data centers as it eliminates power consumption, cooling, and availability concerns.
The virtual private server market is driven by the increasing emphasis of enterprises on secured hosting. Growing security concerns of enterprises against cybersecurity breaches is expected to drive the market growth during the forecast period. Furthermore, evolution of virtualization is boosting the growth of the virtual private server market.The global virtual private server market is expected to grow prominently during the forecast period due to the rapidly growing demand for VPS due to its benefits such as shared cost of services and complete OS access. VPS helps in meeting varying business requirements, VPS can be scaled up and down easily by adding and reducing the resources. As per requirement, the enterprise can vary RAM, CPU, bandwidth, and storage resources to meet particular requirements.
However, limited availability of physical resources is affecting the large-scale adoption of virtual private servers. Furthermore, in unmanaged VPS hosting, the user needs to have strong technical expertise in terms of server security, maintenance, and software updates. Thus, the lack of technical expertise and unavailability of physical resources is limiting the growth of the market.
A key opportunity boosting market growth is the increasing deployment of Windows based servers. VPS is attracting a large customer base due to its cost-effectiveness, flexibility, scalability, and massive processing power. Furthermore, varying hosting processes are also changing the way virtual private servers are being used.
The virtual private server market is segmented on the basis of operating system, enterprise size, and end-use industry. Based on operating system, the market has been segmented into Linux and Windows. In terms of enterprise size, the market has been segmented into small & medium enterprises, and large enterprises. Based on end-use industry, the market is segmented into IT & telecommunication, BFSI, retail, medical & healthcare, manufacturing, government, and others. IT & telecom industry segment is expected to grow significantly during the forecast period. This is due to the advent of Big Data which requires secured hosting in order to avoid data loss
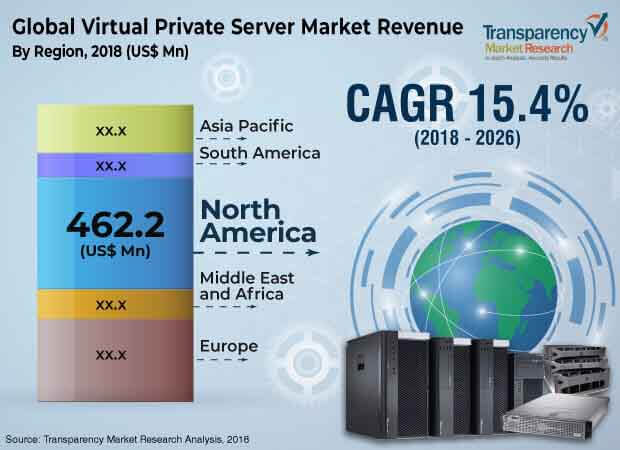
From a regional point of view, North America is estimated to hold a major share in the virtual private server market. Growth in this region is credited to robust adoption and penetration of virtual private servers, as well as considerable application of virtual private serversin diverse end-user industry segments. Asia Pacific is anticipated to observe lucrative growth due to growingadoption of virtual private servers by developers in countries such as China, Japan, and India thatare emphasizing on development of strong internet infrastructure and digital technology which is offering huge opportunities to vendors in the market. Furthermore, the markets in South America and Middle East &Africa (MEA) are also likely to grow significantly during the forecast period. Growing awareness and adoption of virtual private servers across Middle East & Africa and South America is offering new opportunities for key players operating in the global virtual private server market.
Majorvendors are spending huge amounts in virtual private server tools since the market is growing rapidly. Furthermore, technological developments and rising trend of secured web hosting is boosting the adoption of a wide-ranging variety of virtual private servers. Moreover, predominant software vendors are enhancing their sales and distribution networks in order to reach the most distant clients. Key players profiled in the virtual private server market report include Amazon Web Services, Inc., DreamHost, LLC, Endurance Group, GoDaddy Operating Company, LLC, Kamatera, Inc., OVH, Rackspace US, Inc., Savari Technologies Pvt. Ltd (MediaStroke), TekTonic, and United Internet AG.
The virtual private server market has been segmented as below:
Market Segmentation: Global Virtual Private Server Market
By Operating System
By Enterprise Size
By End-users
In addition, the report provides analysis of the virtual private server market with respect to the following geographic segments:
1. Preface
1.1. Market Scope
1.2. Market Segmentation
1.3. Key Research Objectives
1.4. Research Highlights
2. Assumptions and Research Methodology
2.1. Market Taxonomy - Segment Definitions
2.2. Research Methodology
2.2.1. List of Primary and Secondary Sources
2.3. Key Assumptions for Data Modeling
3. Executive Summary: Global Virtual Private Servers Market
4. Market Overview
4.1. Introduction
4.2. Global Market – Macro Economic Factors Overview
4.2.1. World GDP Indicator – For Top 20 Economies
4.2.2. Global ICT Spending (US$ Mn), 2012, 2018, 2026
4.3. Technology/Product Roadmap
4.4. Market Factor Analysis
4.4.1. Porter’s Five Forces Analysis
4.4.2. PESTEL Analysis
4.4.3. Value Chain Analysis
4.4.4. Market Dynamics (Growth Influencers)
4.4.4.1. Drivers
4.4.4.2. Restraints
4.4.4.3. Opportunities
4.5. Analysis of Server Type
4.6. Global Virtual Private Servers Market Analysis and Forecast, 2018 - 2026
4.6.1. Market Revenue Analysis (US$ Mn)
4.6.1.1. Historic growth trends, 2012-2017
4.6.1.2. Forecast trends, 2018-2026
4.7. Global Market Attractiveness Analysis
4.7.1. By Region/ Country
4.7.2. By Operating System
4.7.3. By Enterprise Size
4.7.4. By End-users
4.8. Competitive Scenario and Trends
4.8.1. Virtual Private Servers Market Concentration Rate
4.8.1.1. List of New Entrants
4.8.2. Mergers & Acquisitions, Expansions
4.9. Market Outlook
5. Global Virtual Private Servers Market Analysis and Forecast, by Operating System
5.1. Overview and Definitions
5.2. Key Segment Analysis
5.3. Virtual Private Servers Market Size (US$ Mn) Forecast, by Operating System, 2016 - 2026
5.3.1. Linux
5.3.2. Windows
6. Global Virtual Private Servers Market Analysis and Forecast, by Enterprise Size
6.1. Overview and Definitions
6.2. Key Segment Analysis
6.3. Virtual Private Servers Market Size (US$ Mn) Forecast, by Enterprise Size, 2016 - 2026
6.3.1. Small & Medium Enterprises
6.3.2. Large Enterprises
7. Global Virtual Private Servers Market Analysis and Forecast, by End-users
7.1. Overview and Definitions
7.2. Key Segment Analysis
7.3. Virtual Private Servers Market Size (US$ Mn) Forecast, by End-users, 2016 - 2026
7.3.1. IT & Telecommunication
7.3.2. BFSI
7.3.3. Retail
7.3.4. Medical & Healthcare
7.3.5. Manufacturing
7.3.6. Government
7.3.7. Others (Transportation, Hospitality)
8. Global Virtual Private Servers Market Analysis and Forecast, by Region
8.1. Overview
8.2. Key Segment Analysis
8.3. Virtual Private Servers Market Size (US$ Mn) Forecast, by Region, 2016 -2026
8.3.1. North America
8.3.2. Europe
8.3.3. Asia Pacific
8.3.4. Middle East & Africa
8.3.5. South America
9. North America Virtual Private Servers Market Analysis and Forecast
9.1. Key Findings
9.2. Impact Analysis of Drivers & Restraints
9.3. Virtual Private Servers Market Size (US$ Mn) Forecast, by Operating System, 2016 - 2026
9.3.1. Linux
9.3.2. Windows
9.4. Virtual Private Servers Market Size (US$ Mn) Forecast, by Enterprise Size, 2016 - 2026
9.4.1. Small & Medium Enterprises
9.4.2. Large Enterprises
9.5. Virtual Private Servers Market Size (US$ Mn) Forecast, by End-users, 2016 - 2026
9.5.1. IT & Telecommunication
9.5.2. BFSI
9.5.3. Retail
9.5.4. Medical & Healthcare
9.5.5. Manufacturing
9.5.6. Government
9.5.7. Others (Transportation, Hospitality)
9.6. Virtual Private Servers Market Size (US$ Mn) Forecast, by Country & Sub-region, 2016 - 2026
9.6.1. The U.S.
9.6.2. Canada
9.6.3. Rest of North America
10. Europe Virtual Private Servers Market Analysis and Forecast
10.1. Key Findings
10.2. Impact Analysis of Drivers & Restraints
10.3. Virtual Private Servers Market Size (US$ Mn) Forecast, by Operating System, 2016 - 2026
10.3.1. Linux
10.3.2. Windows
10.4. Virtual Private Servers Market Size (US$ Mn) Forecast, by Enterprise Size, 2016 - 2026
10.4.1. Small & Medium Enterprises
10.4.2. Large Enterprises
10.5. Virtual Private Servers Market Size (US$ Mn) Forecast, by End-users, 2016 - 2026
10.5.1. IT & Telecommunication
10.5.2. BFSI
10.5.3. Retail
10.5.4. Medical & Healthcare
10.5.5. Manufacturing
10.5.6. Government
10.5.7. Others (Transportation, Hospitality)
10.6. Virtual Private Servers Market Size (US$ Mn) Forecast, by Country & Sub-region, 2016 - 2026
10.6.1. Germany
10.6.2. The U.K.
10.6.3. France
10.6.4. Rest of Europe
11. Asia Pacific Virtual Private Servers Market Analysis and Forecast
11.1. Key Findings
11.2. Impact Analysis of Drivers & Restraints
11.3. Virtual Private Servers Market Size (US$ Mn) Forecast, by Operating System, 2016 - 2026
11.3.1. Linux
11.3.2. Windows
11.4. Virtual Private Servers Market Size (US$ Mn) Forecast, by Enterprise Size, 2016 - 2026
11.4.1. Small & Medium Enterprises
11.4.2. Large Enterprises
11.5. Virtual Private Servers Market Size (US$ Mn) Forecast, by End-users, 2016 - 2026
11.5.1. IT & Telecommunication
11.5.2. BFSI
11.5.3. Retail
11.5.4. Medical & Healthcare
11.5.5. Manufacturing
11.5.6. Government
11.5.7. Others (Transportation, Hospitality)
11.6. Virtual Private Servers Market Size (US$ Mn) Forecast, by Country & Sub-region, 2016 - 2026
11.6.1. China
11.6.2. Japan
11.6.3. India
11.6.4. Australia
11.6.5. Rest of Asia Pacific
12. Middle East & Africa (MEA) Virtual Private Servers Market Analysis and Forecast
12.1. Key Findings
12.2. Impact Analysis of Drivers & Restraints
12.3. Virtual Private Servers Market Size (US$ Mn) Forecast, by Operating System, 2016 - 2026
12.3.1. Linux
12.3.2. Windows
12.4. Virtual Private Servers Market Size (US$ Mn) Forecast, by Enterprise Size, 2016 - 2026
12.4.1. Small & Medium Enterprises
12.4.2. Large Enterprises
12.5. Virtual Private Servers Market Size (US$ Mn) Forecast, by End-users, 2016 - 2026
12.5.1. IT & Telecommunication
12.5.2. BFSI
12.5.3. Retail
12.5.4. Medical & Healthcare
12.5.5. Manufacturing
12.5.6. Government
12.5.7. Others (Transportation, Hospitality)
12.6. Virtual Private Servers Market Size (US$ Mn) Forecast, by Country & Sub-region, 2016 - 2026
12.6.1. GCC Countries
12.6.2. South Africa
12.6.3. Rest of MEA
13. South America Virtual Private Servers Market Analysis and Forecast
13.1. Key Findings
13.2. Impact Analysis of Drivers & Restraints
13.3. Virtual Private Servers Market Size (US$ Mn) Forecast, by Operating System, 2016 - 2026
13.3.1. Linux
13.3.2. Windows
13.4. Virtual Private Servers Market Size (US$ Mn) Forecast, by Enterprise Size, 2016 - 2026
13.4.1. Small & Medium Enterprises
13.4.2. Large Enterprises
13.5. Virtual Private Servers Market Size (US$ Mn) Forecast, by End-users, 2016 - 2026
13.5.1. IT & Telecommunication
13.5.2. BFSI
13.5.3. Retail
13.5.4. Medical & Healthcare
13.5.5. Manufacturing
13.5.6. Government
13.5.7. Others (Transportation, Hospitality)
13.6. Virtual Private Servers Market Size (US$ Mn) Forecast, by Country & Sub-region, 2016 - 2026
13.6.1. Brazil
13.6.2. Rest of South America
14. Competition Landscape
14.1. Market Player – Competition Matrix
14.2. Market Revenue Share Analysis (%), By Company (2017)
15. Company Profiles (Details – Business Overview, Sales Area/Geographical Presence, Key Developments, Revenue and Strategy)
15.1. Amazon Web Services, Inc.
15.2. DreamHost, LLC.
15.3. Endurance Group
15.4. GoDaddy Operating Company, LLC
15.5. Kamatera, Inc.,
15.6. OVH
15.7. Rackspace US, Inc.
15.8. Savari Technologies Pvt. Ltd (MediaStroke)
15.9. TekTonic
15.10. United Internet AG
16. Key Takeaways
List of Tables
Table 1: Acronyms Used
Table 2: North America ICT Spending (US$ Mn)
Table 3: Europe ICT Spending (US$ Mn)
Table 4: Asia Pacific ICT Spending (US$ Mn)
Table 5: MEA ICT Spending (US$ Mn)
Table 6: South America ICT Spending (US$ Mn)
Table 7: Global Virtual Private Server Market Revenue (US$ Mn) Forecast, by Operating System, 2016 - 2026
Table 8: Global Virtual Private Server Market Revenue (US$ Mn) Forecast, by Enterprise Size, 2016 - 2026
Table 9: Global Virtual Private Server Market Revenue (US$ Mn) Forecast, by End-users, 2016 - 2026
Table 10: Global Virtual Private Server Market Revenue (US$ Mn) Forecast, by Region, 2016 - 2026
Table 11: North America Virtual Private Server Market Revenue (US$ Mn) Forecast, by Operating System, 2016 - 2026
Table 12: North America Virtual Private Server Market Revenue (US$ Mn) Forecast, by Enterprise Size, 2016 - 2026
Table 13: North America Virtual Private Server Market Revenue (US$ Mn) Forecast, by End-users, 2016 - 2026
Table 14: North America Virtual Private Server Market Revenue (US$ Mn) Forecast, by Country, 2016 - 2026
Table 15: Europe Virtual Private Server Market Revenue (US$ Mn) Forecast, by Operating System, 2016 - 2026
Table 16: Europe Virtual Private Server Market Revenue (US$ Mn) Forecast, by Enterprise Size, 2016 - 2026
Table 17: Europe Virtual Private Server Market Revenue (US$ Mn) Forecast, by End-users, 2016 - 2026
Table 18: Europe Virtual Private Server Market Revenue (US$ Mn) Forecast, by Country, 2016 - 2026
Table 19: Asia Pacific Virtual Private Server Market Revenue (US$ Mn) Forecast, by Operating System, 2016 - 2026
Table 20: Asia Pacific Virtual Private Server Market Revenue (US$ Mn) Forecast, by Enterprise Size, 2016 - 2026
Table 21: Asia Pacific Virtual Private Server Market Revenue (US$ Mn) Forecast, by End-users, 2016 - 2026
Table 22: Asia Pacific Virtual Private Server Market Revenue (US$ Mn) Forecast, by Country, 2016 - 2026
Table 23: Middle East and Africa Virtual Private Server Market Revenue (US$ Mn) Forecast, by Operating System, 2016 - 2026
Table 24: Middle East &Africa Virtual Private Server Market Revenue (US$ Mn) Forecast, by Enterprise Size, 2016 - 2026
Table 25: Middle East &Africa Virtual Private Server Market Revenue (US$ Mn) Forecast, by End-users, 2016 - 2026
Table 26: Middle East &Africa Virtual Private Server Market Revenue (US$ Mn) Forecast, by Country, 2016 - 2026
Table 27: South America Virtual Private Server Market Revenue (US$ Mn) Forecast, by Operating System, 2016 - 2026
Table 28: South America Virtual Private Server Market Revenue (US$ Mn) Forecast, by Enterprise Size, 2016 - 2026
Table 29: South America Virtual Private Server Market Revenue (US$ Mn) Forecast, by End-users, 2016 - 2026
Table 30: South America Virtual Private Server Market Revenue (US$ Mn) Forecast, by Country, 2016 - 2026
List of Figures
Figure 1: Global Virtual Private Server Market Size (US$ Mn) Forecast, 2016–2026
Figure 2: Global Top 5 Countries – CAGR (2018-2026) Analysis
Figure 3: Global Top 3 Regions, Market Share Analysis, 2018 & 2026 (%)
Figure 4: Global Virtual Private Server Market Size (US$ Mn)
Figure 5: GDP (US$ Bn), Top Economies (2012-2017)
Figure 6: Top Economies GDP Landscape
Figure 7: Gross Domestic Product (GDP) per Capita; Analysis (1/2) (US$ Tn), by Major Countries, 2012-2017
Figure 8: Ecosystem Analysis
Figure 9: Global Virtual Private Server Market Size (US$ Mn) Forecast, 2016 – 2026
Figure 10: Global Virtual Private Server Market Y-o-Y Growth (Value %) Forecast, 2017 – 2026
Figure 11: Historic Growth Trends and Y-o-Y Growth, 2012-2017
Figure 12: Forecast Trends and Y-o-Y Growth, 2018-2026
Figure 13: Global Virtual Private Server Market Attractiveness Analysis, by Operating System
Figure 14: Global Virtual Private Server Market Parameter for Attractiveness Analysis, by Operating System
Figure 15: Global Virtual Private Server Market Attractiveness Analysis, by Enterprise Size
Figure 16: Global Virtual Private Server Market Parameter for Attractiveness Analysis, by Enterprise Size
Figure 17: Global Virtual Private Server Market Attractiveness Analysis, by End-users
Figure 18: Global Virtual Private Server Market Attractiveness Analysis, by End-users
Figure 19: Global Virtual Private Server Market Attractiveness Analysis, by Region
Figure 20: Global Virtual Private Server Market Attractiveness Analysis, by Region
Figure 21: Global Virtual Private Server Market Opportunity by Enterprise Size (%) (2018 – 2026)
Figure 22: Global Virtual Private Server Market Opportunity by Operating System (%) (2018 – 2026)
Figure 23: Global Virtual Private Server Market Opportunity by End-users (%) (2018 – 2026)
Figure 24: Global Virtual Private Server Market Opportunity by Region (%) (2018 – 2026)
Figure 25: Global Virtual Private Server Market Share Analysis, by Operating System (2018)
Figure 26: Global Virtual Private Server Market Share Analysis, by Operating System (2026)
Figure 27: Global Virtual Private Server Market Share Analysis, by Enterprise Size (2018)
Figure 28: Global Virtual Private Server Market Share Analysis, by Enterprise Size (2026)
Figure 29: Global Virtual Private Server Market Share Analysis, by End-users (2018)
Figure 30: Global Virtual Private Server Market Share Analysis, by End-users (2026)
Figure 31: Global Virtual Private Server Market Share Analysis, by Region (2018)
Figure 32: Global Virtual Private Server Market Share Analysis, by Region (2026)
Figure 33: North America Virtual Private Server Market Size (US$ Mn) Forecast, 2016 – 2026
Figure 34: North America Virtual Private Server Market Y-o-Y Growth (%) Forecast, 2017 – 2026
Figure 35: North America Virtual Private Server Market Share Analysis, by Operating System (2018)
Figure 36: North America Virtual Private Server Market Share Analysis, by Operating System (2026)
Figure 37: North America Virtual Private Server Market Share Analysis, by Enterprise Size (2018)
Figure 38: North America Virtual Private Server Market Share Analysis, by Enterprise Size (2026)
Figure 39: North America Virtual Private Server Market Share Analysis, by End-users (2018)
Figure 40: North America Virtual Private Server Market Share Analysis, by End-users (2026)
Figure 41: North America Virtual Private Server Market Share Analysis, by Country (2018)
Figure 42: North America Virtual Private Server Market Share Analysis, by Country (2026)
Figure 43: North America Virtual Private Server Market Attractiveness Analysis, by Operating System (2018)
Figure 44: North America Virtual Private Server Market Attractiveness Analysis, by Enterprise Size (2018)
Figure 45: North America Virtual Private Server Market Attractiveness Analysis, by End-users (2018)
Figure 46: North America Virtual Private Server Market Attractiveness Analysis, by Country (2018)
Figure 47: Europe Virtual Private Server Market Size (US$ Mn) Forecast, 2016 – 2026
Figure 48: Europe Virtual Private Server Market Y-o-Y Growth (%) Forecast, 2017 – 2026
Figure 49: Europe Virtual Private Server Market Share Analysis, by Operating System (2018)
Figure 50: Europe Virtual Private Server Market Share Analysis, by Operating System (2026)
Figure 51: Europe Virtual Private Server Market Share Analysis, by Enterprise Size (2018)
Figure 52: Europe Virtual Private Server Market Share Analysis, by Enterprise Size (2026)
Figure 53: Europe Virtual Private Server Market Share Analysis, by End-users (2018)
Figure 54: Europe Virtual Private Server Market Share Analysis, by End-users (2026)
Figure 55: Europe Virtual Private Server Market Share Analysis, by Country (2018)
Figure 56: Europe Virtual Private Server Market Share Analysis, by Country (2026)
Figure 57: Europe Virtual Private Server Market Attractiveness Analysis, by Operating System (2018)
Figure 58: Europe Virtual Private Server Market Attractiveness Analysis, by Enterprise Size (2018)
Figure 59: Europe Virtual Private Server Market Attractiveness Analysis, by End-users (2018)
Figure 60: Europe Virtual Private Server Market Attractiveness Analysis, by Country (2018)
Figure 61: Asia Pacific Virtual Private Server Market Size (US$ Mn) Forecast, 2016 – 2026
Figure 62: Asia Pacific Virtual Private Server Market Y-o-Y Growth (%) Forecast, 2017 – 2026
Figure 63: Asia Pacific Virtual Private Server Market Share Analysis, by Operating System (2018)
Figure 64: Asia Pacific Virtual Private Server Market Share Analysis, by Operating System (2026)
Figure 65: Asia Pacific Virtual Private Server Market Share Analysis, by Enterprise Size (2018)
Figure 66: Asia Pacific Virtual Private Server Market Share Analysis, by Enterprise Size (2026)
Figure 67: Asia Pacific Virtual Private Server Market Share Analysis, by End-users (2018)
Figure 68: Asia Pacific Virtual Private Server Market Share Analysis, by End-users (2026)
Figure 69: Asia Pacific Virtual Private Server Market Share Analysis, by Country (2018)
Figure 70: Asia Pacific Virtual Private Server Market Share Analysis, by Country (2026)
Figure 71: Asia Pacific Virtual Private Server Market Attractiveness Analysis, by Operating System (2018)
Figure 72: Asia Pacific Virtual Private Server Market Attractiveness Analysis, by Enterprise Size (2018)
Figure 73: Asia Pacific Virtual Private Server Market Attractiveness Analysis, by End-users (2018)
Figure 74: Asia Pacific Virtual Private Server Market Attractiveness Analysis, by Country (2018)
Figure 75: Middle East & Africa Virtual Private Server Market Size (US$ Mn) Forecast, 2016 – 2026
Figure 76: Middle East & Africa Virtual Private Server Market Y-o-Y Growth (%) Forecast, 2017 – 2026
Figure 77: Middle East & Africa Virtual Private Server Market Share Analysis, by Operating System (2018)
Figure 78: Middle East & Africa Virtual Private Server Market Share Analysis, by Operating System (2026)
Figure 79: Middle East & Africa Virtual Private Server Market Share Analysis, by Enterprise Size (2018)
Figure 80: Middle East & Africa Virtual Private Server Market Share Analysis, by Enterprise Size (2026)
Figure 81: Middle East & Africa Virtual Private Server Market Share Analysis, by End-users (2018)
Figure 82: Middle East & Africa Virtual Private Server Market Share Analysis, by End-users (2026)
Figure 83: Middle East & Africa Virtual Private Server Market Share Analysis, by Country (2018)
Figure 84: Middle East & Africa Virtual Private Server Market Share Analysis, by Country (2026)
Figure 85: Middle East & Africa Virtual Private Server Market Attractiveness Analysis, by Operating System (2018)
Figure 86: Middle East & Africa Virtual Private Server Market Attractiveness Analysis, by Enterprise Size (2018)
Figure 87: Middle East & Africa Virtual Private Server Market Attractiveness Analysis, by End-users (2018)
Figure 88: Middle East & Africa Virtual Private Server Market Attractiveness Analysis, by Country (2018)
Figure 89: South America Virtual Private Server Market Size (US$ Mn) Forecast, 2016 – 2026
Figure 90: South America Virtual Private Server Market Y-o-Y Growth (%) Forecast, 2017 – 2026
Figure 91: South America Virtual Private Server Market Share Analysis, by Operating System (2018)
Figure 92: South America Virtual Private Server Market Share Analysis, by Operating System (2026)
Figure 93: South America Virtual Private Server Market Share Analysis, by Enterprise Size (2018)
Figure 94: South America Virtual Private Server Market Share Analysis, by Enterprise Size (2026)
Figure 95: South America Virtual Private Server Market Share Analysis, by End-users (2018)
Figure 96: South America Virtual Private Server Market Share Analysis, by End-users (2026)
Figure 97: South America Virtual Private Server Market Share Analysis, by Country (2018)
Figure 98: South America Virtual Private Server Market Share Analysis, by Country (2026)
Figure 99: South America Virtual Private Server Market Attractiveness Analysis, by Operating System (2018)
Figure 100: South America Virtual Private Server Market Attractiveness Analysis, by Enterprise Size (2018)
Figure 101: South America Virtual Private Server Market Attractiveness Analysis, by End-users (2018)
Figure 102: South America Virtual Private Server Market Attractiveness Analysis, by Country (2018)
Figure 103: Virtual Private Server Market Share Analysis, 2017 (Value %)
Figure 104: Revenue (US$ Mn) & Y-o-Y Growth (%), 2015–2017, Amazon Web Services, Inc.
Figure 105: Breakdown of Net Sales, by Geography, 2017, Amazon Web Services, Inc.
Figure 106: Revenue (US$ Mn) & Y-o-Y Growth (%), 2015–2017, Endurance International Group
Figure 107: Breakdown of Net Sales, by Geography, 2017, Endurance International Group
Figure 108: Revenue (US$ Mn) & Y-o-Y Growth (%), 2015–2017, GoDaddy Operating Company, LLC
Figure 109: Breakdown of Net Sales, by Geography, 2017, GoDaddy Operating Company, LLC.
Figure 110: Revenue (US$ Mn) & Y-o-Y Growth (%), 2015–2017, United Internet AG
Figure 111: Breakdown of Net Sales, by Geography, 2017, United Internet AG
Copyright © Transparency Market Research, Inc. All Rights reserved
Trust Online

Virtual Private Server Market