
Reports
Reports
Manufacturers of process instrumentation and measurement solutions are struggling financially to meet the demands of clients during the COVID-19 (coronavirus) pandemic. They are increasing efforts to continuously monitor and follow recommendations of global and local health authorities. Companies in the variable area flowmeters market are increasing efforts to adopt contingency plans and meet mission critical applications of clients.
Companies in the variable area flowmeters market are focusing on essential industries, such as F&B, power, and oil & gas industries to keep economies running during the COVID-19 era. In order to abide by social distancing norms, companies are remotely available to serve their clients via email and mobile devices. The potential COVID-19 vaccines are predicted to revive market growth and meet the demand for products.
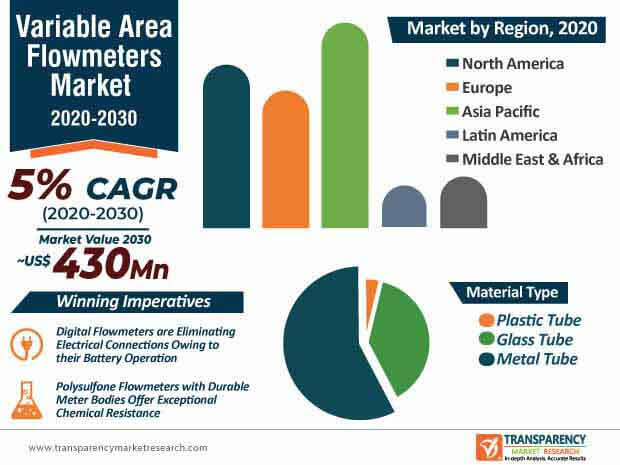
The variable area flowmeters market is expected to surge at a CAGR of 5% during the forecast period. However, there is lack of products that comply with challenging applications of oxidizing and reducing agents. Thus, Titan Enterprises’ OG series flowmeters are gaining increased popularity for their reliable design and Hastelloy C choice of material to withstand corrosive fluid handling and other harsh environments.
Electromagnetic flowmeters are gaining popularity in pharmaceutical, mining, and water management industries, among others, in the variable area flowmeters market. ISOIL Industria— a provider of systems and instrumentation for the measurement, is expanding its business with electromagnetic flowmeters that are suitable for measurement of abrasive liquids, sand mixtures, suspended solids, and the likes.
Manufacturers in the variable area flowmeters market are increasing efforts to develop products that are high performance and deploy low cost of operation. For instance, Badger Meter— a manufacturer of metering products using flow measurement and control technologies, is increasing its marketing capabilities to acquire visibility for its variable area flowmeters that are designed for easy installation and require minimum maintenance.
The quick visual flow indication on an easy to read linear scale is being highly preferred by end users. Hence, manufacturers are developing systems with meters that are suitable to monitor a wide range of liquids, fluids, and emulsions. This indicates why the variable area flowmeters market is projected to surpass the valuation of US$ 430 Mn by the end of 2030.
Different styles of flowmeters for inline, panel mount, and closed pipe installations are being incorporated in systems by manufacturers in the variable area flowmeters market. Blue-White Industries— a manufacturer of chemical metering pumps and flowmeters, is increasing its product portfolio in acrylic variable area flowmeters that are available for different installation styles and with a broad range of flow rates.
Companies in the variable area flowmeters market are boosting their output capacities in polysulfone flowmeters made with durable meter bodies that offer unmatched heat and chemical resistance. They are manufacturing products that are suitable for phosphate esters, compressed gases, and water-based liquids.
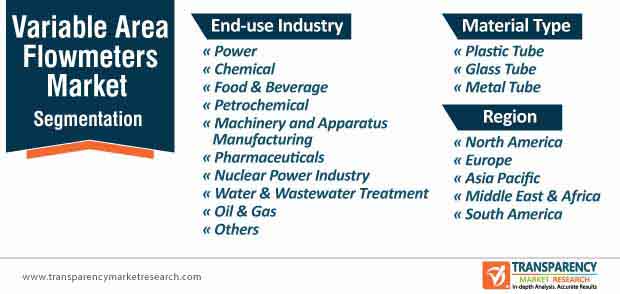
Manufacturers in the variable area flowmeters market are establishing stable revenue streams in power and chemical applications. They are increasing efforts to unlock revenue opportunities in petrochemical, aerospace, and military applications to broaden the income sources. High-quality and reliable flow instrumentation is being preferred by clients in the pulp & paper and water & wastewater treatment industries.
Suppliers are stocking products from different companies such as Dwyer, Kytola, and KROHNE in order to gain recognition as representatives of authorized distributors and manufacturers. As such, digital variable area flowmeters are being highly publicized for their advantageous high sensitive magnetic field detection sensor technology. Digital flowmeters are eliminating the need of electrical connections since they operate on battery.
Analysts’ Viewpoint
Supply shortfalls are predicted during the ongoing COVID-19 outbreak, as production activities have been affected in different countries. The sensor technology is growing popular in variable area flowmeters in order to withstand high temperatures and pressures in hazardous areas. However, there is lack of R&D to develop products resistant to oxidizing and reducing agents. Thus, manufacturers in the variable area flowmeters market should offset these disadvantages by offering high quality flowmeters at low cost of operation and continue to gain strong research base in reliable designs for systems. They should manufacture electromagnetic flowmeters integrated with alkaline batteries to deploy flow measurement in steam, chemical, and mineral oil applications.
1. Global Variable Area Flowmeters Market - Executive Summary
1.1. Global Variable Area Flowmeters Market Country Analysis
1.2. Vertical Specific Market Penetration
1.3. Application – Product Mapping
1.4. Competition Blueprint
1.5. Technology Time Line Mapping
1.6. TMR Analysis and Recommendations
2. Market Overview
2.1. Market Introduction
2.2. Market Definition
2.3. Market Taxonomy
3. Market Dynamics
3.1. Macro-economic Factors
3.2. Drivers
3.2.1. Economic Drivers
3.2.2. Supply Side Drivers
3.2.3. Demand Side Drivers
3.3. Market Restraints
3.4. Market Trends
3.5. Trend Analysis- Impact on Time Line (2020-2030)
3.6. Key Regulations By Regions
4. Associated Industry and Key Indicator Assessment
4.1. Parent Industry Overview
4.2. Supply Chain Analysis
4.2.1. Profitability and Gross Margin Analysis, by Competition
4.2.2. List of Active Participants- By Region
4.2.2.1. Raw Material Suppliers
4.2.2.2. Key Manufacturers
4.2.2.3. Integrators
4.2.2.4. Key Distributor/Retailers
4.3. Technology Roadmap Analysis
4.4. Porter Five Forces Analysis
5. Global Variable Area Flowmeters Market Analysis and Forecast
5.1. Market Size Analysis (2018-2019) and Forecast (2020-2030)
5.1.1. Market Value (US$ Mn) and Volume (Thousand Units) and Y-o-Y Growth
5.2. Global Variable Area Flowmeters Market Scenario Forecast (Optimistic, Likely and Conservative Market Conditions)
5.2.1. Forecast Factors and Relevance of Impact
5.2.2. Regional Variable Area Flowmeters Market Business Performance Summary
6. Global Variable Area Flowmeters Market Analysis, by Material Type
6.1. Introduction
6.1.1. Y-o-Y Growth Comparison, by Material Type
6.2. Variable Area Flowmeters Market Size (US$ Mn and Thousand Units) Analysis & Forecast, by Material Type, 2018-2030
6.2.1. Plastic Tube
6.2.2. Glass Tube
6.2.3. Metal Tube
6.3. Market Attractiveness Analysis, by Material Type
7. Global Variable Area Flowmeters Market Analysis, by End-use Industry
7.1. Introduction
7.1.1. Y-o-Y Growth Comparison, by End-use Industry
7.2. Variable Area Flowmeters Market Size (US$ Mn) Analysis & Forecast, by End-use Industry, 2018-2030
7.2.1. Chemical
7.2.2. Petrochemical
7.2.3. Oil & Gas
7.2.4. Machinery and Apparatus Manufacturing
7.2.5. Pharmaceutical
7.2.6. Food and Beverage
7.2.7. Water and Wastewater
7.2.8. Nuclear Power Industry
7.2.9. Power Generation
7.2.10. Others
7.3. Market Attractiveness Analysis, by End-use Industry
8. Global Variable Area Flowmeters Market Analysis and Forecast, by Region
8.1. Introduction
8.1.1. Basis Point Share (BPS) Analysis, by Region
8.2. Variable Area Flowmeters Market Size (US$ Mn and Thousand Units) Analysis & Forecast, by Region, 2018-2030
8.2.1. North America
8.2.2. Europe
8.2.3. Asia Pacific
8.2.4. Middle East & Africa
8.2.5. South America
8.3. Market Attractiveness Analysis, by Region
9. North America Variable Area Flowmeters Market Analysis and Forecast
9.1. Introduction
9.2. Drivers and Restraints: Impact Analysis
9.3. Variable Area Flowmeters Market Size (US$ Mn and Thousand Units) Analysis & Forecast, by Material Type, 2018-2030
9.3.1. Plastic Tube
9.3.2. Glass Tube
9.3.3. Metal Tube
9.4. Variable Area Flowmeters Market Size (US$ Mn) Analysis & Forecast, by End-use Industry, 2018-2030
9.4.1. Chemical
9.4.2. Petrochemical
9.4.3. Oil & Gas
9.4.4. Machinery and Apparatus Manufacturing
9.4.5. Pharmaceutical
9.4.6. Food and Beverage
9.4.7. Water and Wastewater
9.4.8. Nuclear Power Industry
9.4.9. Power Generation
9.4.10. Others
9.5. Variable Area Flowmeters Market Size (US$ Mn and Thousand Units) Analysis & Forecast, by Country, 2018-2030
9.5.1. U.S.
9.5.2. Canada
9.5.3. Mexico
9.6. Market Attractiveness Analysis
9.6.1. Material Type
9.6.2. End-use Industry
9.6.3. Country
10. Europe Variable Area Flowmeters Market Analysis and Forecast
10.1. Introduction
10.2. Drivers and Restraints: Impact Analysis
10.3. Variable Area Flowmeters Market Size (US$ Mn and Thousand Units) Analysis & Forecast, by Material Type, 2018-2030
10.3.1. Plastic Tube
10.3.2. Glass Tube
10.3.3. Metal Tube
10.4. Variable Area Flowmeters Market Size (US$ Mn) Analysis & Forecast, by End-use Industry, 2018-2030
10.4.1. Chemical
10.4.2. Petrochemical
10.4.3. Oil & Gas
10.4.4. Machinery and Apparatus Manufacturing
10.4.5. Pharmaceutical
10.4.6. Food and Beverage
10.4.7. Water and Wastewater
10.4.8. Nuclear Power Industry
10.4.9. Power Generation
10.4.10. Others
10.5. Variable Area Flowmeters Market Size (US$ Mn and Thousand Units) Analysis & Forecast, by Country and Sub-region, 2018-2030
10.5.1. U.K.
10.5.2. Germany
10.5.3. France
10.5.4. Italy
10.5.5. Russia
10.5.6. Rest of Europe
10.6. Market Attractiveness Analysis
10.6.1. Material Type
10.6.2. End-use Industry
10.6.3. Country and Sub-region
11. Asia Pacific Variable Area Flowmeters Market Analysis and Forecast
11.1. Introduction
11.2. Drivers and Restraints: Impact Analysis
11.3. Variable Area Flowmeters Market Size (US$ Mn and Thousand Units) Analysis & Forecast, by Material Type, 2018-2030
11.3.1. Plastic Tube
11.3.2. Glass Tube
11.3.3. Metal Tube
11.4. Variable Area Flowmeters Market Size (US$ Mn) Analysis & Forecast, by End-use Industry, 2018-2030
11.4.1. Chemical
11.4.2. Petrochemical
11.4.3. Oil & Gas
11.4.4. Machinery and Apparatus Manufacturing
11.4.5. Pharmaceutical
11.4.6. Food and Beverage
11.4.7. Water and Wastewater
11.4.8. Nuclear Power Industry
11.4.9. Power Generation
11.4.10. Others
11.5. Variable Area Flowmeters Market Size (US$ Mn and Thousand Units) Analysis & Forecast, by Country and Sub-region, 2018-2030
11.5.1. China
11.5.2. India
11.5.3. Japan
11.5.4. South Korea
11.5.5. ASEAN
11.5.6. Rest of Asia Pacific
11.6. Market Attractiveness Analysis
11.6.1. Material Type
11.6.2. End-use Industry
11.6.3. Country and Sub-region
12. Middle East & Africa (MEA) Variable Area Flowmeters Market Analysis and Forecast
12.1. Introduction
12.2. Drivers and Restraints: Impact Analysis
12.3. Variable Area Flowmeters Market Size (US$ Mn and Thousand Units) Analysis & Forecast, by Material Type, 2018-2030
12.3.1. Plastic Tube
12.3.2. Glass Tube
12.3.3. Metal Tube
12.4. Variable Area Flowmeters Market Size (US$ Mn) Analysis & Forecast, by End-use Industry, 2018-2030
12.4.1. Chemical
12.4.2. Petrochemical
12.4.3. Oil & Gas
12.4.4. Machinery and Apparatus Manufacturing
12.4.5. Pharmaceutical
12.4.6. Food and Beverage
12.4.7. Water and Wastewater
12.4.8. Nuclear Power Industry
12.4.9. Power Generation
12.4.10. Others
12.5. Variable Area Flowmeters Market Size (US$ Mn and Thousand Units) Analysis & Forecast, by Country and Sub-region, 2018-2030
12.5.1. GCC
12.5.2. South Africa
12.5.3. North Africa
12.5.4. Rest of Middle East & Africa
12.6. Market Attractiveness Analysis
12.6.1. Material Type
12.6.2. End-use Industry
12.6.3. Country and Sub-region
13. South America Variable Area Flowmeters Market Analysis and Forecast
13.1. Introduction
13.2. Drivers and Restraints: Impact Analysis
13.3. Variable Area Flowmeters Market Size (US$ Mn and Thousand Units) Analysis & Forecast, by Material Type, 2018-2030
13.3.1. Plastic Tube
13.3.2. Glass Tube
13.3.3. Metal Tube
13.4. Variable Area Flowmeters Market Size (US$ Mn) Analysis & Forecast, by End-use Industry, 2018-2030
13.4.1. Chemical
13.4.2. Petrochemical
13.4.3. Oil & Gas
13.4.4. Machinery and Apparatus Manufacturing
13.4.5. Pharmaceutical
13.4.6. Food and Beverage
13.4.7. Water and Wastewater
13.4.8. Nuclear Power Industry
13.4.9. Power Generation
13.4.10. Others
13.5. Variable Area Flowmeters Market Size (US$ Mn and Thousand Units) Analysis & Forecast, by Country and Sub-region, 2018-2030
13.5.1. Brazil
13.5.2. Argentina
13.5.3. Rest of South America
13.6. Market Attractiveness Analysis
13.6.1. Material Type
13.6.2. End-use Industry
13.6.3. Country and Sub-region
14. Competition Assessment
14.1. Global Variable Area Flowmeters Market Competition - a Dashboard View
14.2. Global Variable Area Flowmeters Market Structure Analysis
14.3. Global Variable Area Flowmeters Market Company Share Analysis, by Value and Volume (2019)
14.4. Key Participants Market Presence (Intensity Mapping) by Region
15. Competition Deep-dive (Manufacturers/Suppliers)
15.1. ABB Ltd.
15.1.1. Overview
15.1.2. Product Portfolio
15.1.3. Sales Footprint
15.1.4. Channel Footprint
15.1.4.1. Distributors List
15.1.5. Strategy Overview
15.1.5.1. Marketing Strategy
15.1.5.2. Culture Strategy
15.1.5.3. Channel Strategy
15.1.6. SWOT Analysis
15.1.7. Financial Analysis
15.1.8. Revenue Share
15.1.8.1. By Region
15.1.9. Key Clients
15.1.10. Analyst Comments
15.2. AW-Lake
15.2.1. Overview
15.2.2. Product Portfolio
15.2.3. Sales Footprint
15.2.4. Channel Footprint
15.2.4.1. Distributors List
15.2.5. Strategy Overview
15.2.5.1. Marketing Strategy
15.2.5.2. Culture Strategy
15.2.5.3. Channel Strategy
15.2.6. SWOT Analysis
15.2.7. Financial Analysis
15.2.8. Revenue Share
15.2.8.1. By Region
15.2.9. Key Clients
15.2.10. Analyst Comments
15.3. Brooks Instruments
15.3.1. Overview
15.3.2. Product Portfolio
15.3.3. Sales Footprint
15.3.4. Channel Footprint
15.3.4.1. Distributors List
15.3.5. Strategy Overview
15.3.5.1. Marketing Strategy
15.3.5.2. Culture Strategy
15.3.5.3. Channel Strategy
15.3.6. SWOT Analysis
15.3.7. Financial Analysis
15.3.8. Revenue Share
15.3.8.1. By Region
15.3.9. Key Clients
15.3.10. Analyst Comments
15.4. Elettrotec Srl
15.4.1. Overview
15.4.2. Product Portfolio
15.4.3. Sales Footprint
15.4.4. Channel Footprint
15.4.4.1. Distributors List
15.4.5. Strategy Overview
15.4.5.1. Marketing Strategy
15.4.5.2. Culture Strategy
15.4.5.3. Channel Strategy
15.4.6. SWOT Analysis
15.4.7. Financial Analysis
15.4.8. Revenue Share
15.4.8.1. By Region
15.4.9. Key Clients
15.4.10. Analyst Comments
15.5. Emerson Electric Co.
15.5.1. Overview
15.5.2. Product Portfolio
15.5.3. Sales Footprint
15.5.4. Channel Footprint
15.5.4.1. Distributors List
15.5.5. Strategy Overview
15.5.5.1. Marketing Strategy
15.5.5.2. Culture Strategy
15.5.5.3. Channel Strategy
15.5.6. SWOT Analysis
15.5.7. Financial Analysis
15.5.8. Revenue Share
15.5.8.1. By Region
15.5.9. Key Clients
15.5.10. Analyst Comments
15.6. KOBOLD Instr. Pvt. Ltd.
15.6.1. Overview
15.6.2. Product Portfolio
15.6.3. Sales Footprint
15.6.4. Channel Footprint
15.6.4.1. Distributors List
15.6.5. Strategy Overview
15.6.5.1. Marketing Strategy
15.6.5.2. Culture Strategy
15.6.5.3. Channel Strategy
15.6.6. SWOT Analysis
15.6.7. Financial Analysis
15.6.8. Revenue Share
15.6.8.1. By Region
15.6.9. Key Clients
15.6.10. Analyst Comments
15.7. KROHNE Messtechnik GmbH
15.7.1. Overview
15.7.2. Product Portfolio
15.7.3. Sales Footprint
15.7.4. Channel Footprint
15.7.4.1. Distributors List
15.7.5. Strategy Overview
15.7.5.1. Marketing Strategy
15.7.5.2. Culture Strategy
15.7.5.3. Channel Strategy
15.7.6. SWOT Analysis
15.7.7. Financial Analysis
15.7.8. Revenue Share
15.7.8.1. By Region
15.7.9. Key Clients
15.7.10. Analyst Comments
15.8. Omega Engineering Inc.
15.8.1. Overview
15.8.2. Product Portfolio
15.8.3. Sales Footprint
15.8.4. Channel Footprint
15.8.4.1. Distributors List
15.8.5. Strategy Overview
15.8.5.1. Marketing Strategy
15.8.5.2. Culture Strategy
15.8.5.3. Channel Strategy
15.8.6. SWOT Analysis
15.8.7. Financial Analysis
15.8.8. Revenue Share
15.8.8.1. By Region
15.8.9. Key Clients
15.8.10. Analyst Comments
15.9. RIELS INSTRUMENTS S.r.l.
15.9.1. Overview
15.9.2. Product Portfolio
15.9.3. Sales Footprint
15.9.4. Channel Footprint
15.9.4.1. Distributors List
15.9.5. Strategy Overview
15.9.5.1. Marketing Strategy
15.9.5.2. Culture Strategy
15.9.5.3. Channel Strategy
15.9.6. SWOT Analysis
15.9.7. Financial Analysis
15.9.8. Revenue Share
15.9.8.1. By Region
15.9.9. Key Clients
15.9.10. Analyst Comments
15.10. Siemens AG
15.10.1. Overview
15.10.2. Product Portfolio
15.10.3. Sales Footprint
15.10.4. Channel Footprint
15.10.4.1. Distributors List
15.10.5. Strategy Overview
15.10.5.1. Marketing Strategy
15.10.5.2. Culture Strategy
15.10.5.3. Channel Strategy
15.10.6. SWOT Analysis
15.10.7. Financial Analysis
15.10.8. Revenue Share
15.10.8.1. By Region
15.10.9. Key Clients
15.10.10. Analyst Comments
15.11. TECFLUID
15.11.1. Overview
15.11.2. Product Portfolio
15.11.3. Sales Footprint
15.11.4. Channel Footprint
15.11.4..1. Distributors List
15.11.5. Strategy Overview
15.11.5.1. Marketing Strategy
15.11.5.2. Culture Strategy
15.11.5.3. Channel Strategy
15.11.6. SWOT Analysis
15.11.7. Financial Analysis
15.11.8. Revenue Share
15.11.8.1. By Region
15.11.9. Key Clients
15.11.10. Analyst Comments
15.12. Yokogawa Electric Corp
15.12.1. Overview
15.12.2. Product Portfolio
15.12.3. Sales Footprint
15.12.4. Channel Footprint
15.12.4.1. Distributors List
15.12.5. Strategy Overview
15.12.5.1. Marketing Strategy
15.12.5.2. Culture Strategy
15.12.5.3. Channel Strategy
15.12.6. SWOT Analysis
15.12.7. Financial Analysis
15.12.8. Revenue Share
15.12.8.1. By Region
15.12.9. Key Clients
15.12.10. Analyst Comments
15.13. Others (On additional request)
16. Recommendation- Critical Success Factors
17. Research Methodology
18. Assumptions & Acronyms Used
List of Tables
Table 1: Global Variable Area Flowmeters Market Revenue (US$ Mn), by Material Type, 2018–2030
Table 2: Global Variable Area Flowmeters Market Volume (Thousand Units), by Material Type, 2018–2030
Table 3: Global Variable Area Flowmeters Market Revenue (US$ Mn), by End-use Industry, 2018–2030
Table 4: Global Variable Area Flowmeters Market Revenue (US$ Mn), by Region, 2018–2030
Table 5: Global Variable Area Flowmeters Market Volume (Thousand Units), by Region, 2018–2030
Table 6: North America Variable Area Flowmeters Market Revenue (US$ Mn), By Material Type, 2018–2030
Table 7: North America Variable Area Flowmeters Market Volume (Thousand Units), by Material Type, 2018–2030
Table 8: North America Variable Area Flowmeters Market Revenue (US$ Mn), by End-use Industry, 2018–2030
Table 9: North America Variable Area Flowmeters Market Revenue (US$ Mn), by Country, 2018–2030
Table 10: North America Variable Area Flowmeters Market Volume (Thousand Units), by Country, 2018–2030
Table 11: Europe Variable Area Flowmeters Market Revenue (US$ Mn), by Material Type, 2018–2030
Table 12: Europe Variable Area Flowmeters Market Volume (Thousand Units), by Material Type, 2018–2030
Table 13: Europe Variable Area Flowmeters Market Revenue (US$ Mn), by End-use Industry, 2018–2030
Table 14: Europe Variable Area Flowmeters Market Revenue (US$ Mn), by Country and Sub-region, 2018–2030
Table 15: Europe Variable Area Flowmeters Market Volume (Thousand Units), by Country and Sub-region, 2018–2030
Table 16: Asia Pacific Variable Area Flowmeters Market Revenue (US$ Mn), by Material Type, 2018–2030
Table 17: Asia Pacific Variable Area Flowmeters Market Volume (Thousand Units), by Material Type, 2018–2030
Table 18: Asia Pacific Variable Area Flowmeters Market Revenue (US$ Mn), by End-use Industry, 2018–2030
Table 19: Asia Pacific Variable Area Flowmeters Market Revenue (US$ Mn), by Country and Sub-region, 2018–2030
Table 20: Asia Pacific Variable Area Flowmeters Market Volume (Thousand Units), by Country and Sub-region, 2018–2030
Table 21: Middle East & Africa Variable Area Flowmeters Market Revenue (US$ Mn), by Material Type, 2018–2030
Table 22: Middle East & Africa Variable Area Flowmeters Market Volume (Thousand Units), by Material Type, 2018–2030
Table 23: Middle East & Africa Variable Area Flowmeters Market Revenue (US$ Mn), by End-use Industry, 2018–2030
Table 24: Middle East & Africa Variable Area Flowmeters Market Revenue (US$ Mn), by Country and Sub-region, 2018–2030
Table 25: Middle East & Africa Variable Area Flowmeters Market Volume (Thousand Units), by Country and Sub-region, 2018–2030
Table 26: South America Variable Area Flowmeters Market Revenue (US$ Mn), by Material Type, 2018–2030
Table 27: South America Variable Area Flowmeters Market Volume (Thousand Units), by Material Type, 2018–2030
Table 28: South America Variable Area Flowmeters Market Revenue (US$ Mn), by End-use Industry, 2018–2030
Table 29: South America Variable Area Flowmeters Market Revenue (US$ Mn), by Country and Sub-region, 2018–2030
Table 30: South America Variable Area Flowmeters Market Volume (Thousand Units), by Country and Sub-region, 2018–2030
List of Figures
Figure 1: Global Variable Area Flowmeters Market Value (USD Mn) Forecast, 2020–2030
Figure 2: Global Variable Area Flowmeters Market Revenue Projection and Y-o-Y Growth, 2018–2030 (US$ Mn and %)
Figure 3: Global Variable Area Flowmeters Market Revenue Projection and Y-o-Y Growth, 2018–2030 (Thousand Units and %)
Figure 4: Global Variable Area Flowmeters Market, by Plastic Tube
Figure 5: Global Variable Area Flowmeters Market, by Glass Tube
Figure 6: Global Variable Area Flowmeters Market, by Metal Tube
Figure 7: Global Variable Area Flowmeters Market Comparison Matrix, by Material Type
Figure 8: Global Variable Area Flowmeters Market Attractiveness Analysis, by Material Type
Figure 9: Global Variable Area Flowmeters Market, by Power Generation
Figure 10: Global Variable Area Flowmeters Market, by Chemical
Figure 11: Global Variable Area Flowmeters Market, by Food & Beverage
Figure 12: Global Variable Area Flowmeters Market, by Petrochemical
Figure 13: Global Variable Area Flowmeters Market, by Pharmaceutical
Figure 14: Global Variable Area Flowmeters Market, by Nuclear Power Industry
Figure 15: Global Variable Area Flowmeters Market, by Water and Wastewater
Figure 16: Global Variable Area Flowmeters Market, by Oil & Gas
Figure 17: Global Variable Area Flowmeters Market, by Machinery and Apparatus Manufacturing
Figure 18: Global Variable Area Flowmeters Market, by Others
Figure 19: Global Variable Area Flowmeters Market Comparison Matrix, by End-use Industry
Figure 20: Global Variable Area Flowmeters Market Attractiveness Analysis, by End-use Industry
Figure 21: Global Variable Area Flowmeters Market Value Share Analysis, by Region (2020E)
Figure 22: Global Variable Area Flowmeters Market Value Share Analysis, by Region (2030F)
Figure 23: Global Variable Area Flowmeters Market Attractiveness Analysis, by Region
Figure 24: North America Variable Area Flowmeters Market Revenue Projection and Y-o-Y Growth, 2018–2030 (US$ Mn and %)
Figure 25: North America Variable Area Flowmeters Market Volume Projection and Y-o-Y Growth, 2018–2030 (Thousand Units)
Figure 26: North America Variable Area Flowmeters Market Value Share Analysis, by Material Type (2020)
Figure 27: North America Variable Area Flowmeters Market Value Share Analysis, by Material Type (2030)
Figure 28: North America Variable Area Flowmeters Market Value Share Analysis, by End-use Industry (2020)
Figure 29: North America Variable Area Flowmeters Market Value Share Analysis, by End-use Industry (2030)
Figure 30: North America Variable Area Flowmeters Market Value Share Analysis, by Country (2020)
Figure 31: North America Variable Area Flowmeters Market Value Share Analysis, by Country (2030)
Figure 32: North America Variable Area Flowmeters Market Attractiveness Analysis, by Material Type
Figure 33: North America Variable Area Flowmeters Market Attractiveness Analysis, by Country
Figure 34: North America Variable Area Flowmeters Market Attractiveness Analysis, by End-use Industry
Figure 35: Europe Variable Area Flowmeters Market Revenue Projection and Y-o-Y Growth, 2018–2030 (US$ Mn and %)
Figure 36: Europe Variable Area Flowmeters Market Volume Projection and Y-o-Y Growth, 2018–2030 (Thousand Units)
Figure 37: Europe Variable Area Flowmeters Market Value Share Analysis, by Material Type (2020)
Figure :38 Europe Variable Area Flowmeters Market Value Share Analysis, by Material Type (2030)
Figure 39: Europe Variable Area Flowmeters Market Value Share Analysis, by End-use Industry (2020)
Figure 40: Europe Variable Area Flowmeters Market Value Share Analysis, by End-use Industry (2030)
Figure 41: Europe Variable Area Flowmeters Market Value Share Analysis, by Country and Sub-region (2020)
Figure 42: Europe Variable Area Flowmeters Market Value Share Analysis, by Country and Sub-region (2030)
Figure 43: Europe Variable Area Flowmeters Market Attractiveness Analysis, by Material Type
Figure 44: Europe Variable Area Flowmeters Market Attractiveness Analysis, by Country
Figure 45: Europe Variable Area Flowmeters Market Attractiveness Analysis, by End-use Industry
Figure 46: Asia Pacific Variable Area Flowmeters Market Revenue Projection and Y-o-Y Growth, 2018–2030 (US$ Mn and %)
Figure 47: Asia Pacific Variable Area Flowmeters Market Volume Projection and Y-o-Y Growth, 2018–2030 (Thousand Units)
Figure 48: Asia Pacific Variable Area Flowmeters Market Value Share Analysis, by Material Type (2020)
Figure 49: Asia Pacific Variable Area Flowmeters Market Value Share Analysis, by Material Type (2030)
Figure 50: Asia Pacific Variable Area Flowmeters Market Value Share Analysis, by End-use Industry (2020)
Figure 51: Asia Pacific Variable Area Flowmeters Market Value Share Analysis, by End-use Industry (2030)
Figure 52: Asia Pacific Variable Area Flowmeters Market Value Share Analysis, by Country and Sub-region (2020)
Figure 53: Asia Pacific Variable Area Flowmeters Market Value Share Analysis, by Country and Sub-region (2030)
Figure 54: Asia Pacific Variable Area Flowmeters Market Attractiveness Analysis, by Material Type
Figure 55: Asia Pacific Variable Area Flowmeters Market Attractiveness Analysis, by Country and Sub-region
Figure 56: Asia Pacific ariable Area Flowmeters Market Attractiveness Analysis, by End-use Industry
Figure 57: Middle East & Africa Variable Area Flowmeters Market Revenue Projection and Y-o-Y Growth, 2018–2030 (US$ Mn and %)
Figure 58: Middle East & Africa Variable Area Flowmeters Market Volume Projection and Y-o-Y Growth, 2018–2030 (Thousand Units)
Figure 59: Middle East & Africa Variable Area Flowmeters Market Value Share Analysis, by Material Type (2020)
Figure 60: Middle East & Africa Variable Area Flowmeters Market Value Share Analysis, by Material Type (2030)
Figure 61: Middle East & Africa Variable Area Flowmeters Market Value Share Analysis, by End-use Industry (2020)
Figure 62: Middle East & Africa Variable Area Flowmeters Market Value Share Analysis, by End-use Industry (2030)
Figure 63: Middle East & Africa Variable Area Flowmeters Market Value Share Analysis, by Country and Sub-region (2020)
Figure 64: Middle East & Africa Variable Area Flowmeters Market Value Share Analysis, by Country and Sub-region (2030)
Figure 65: Middle East & Africa Variable Area Flowmeters Market Attractiveness Analysis, by Material Type
Figure 66: Middle East & Africa Variable Area Flowmeters Market Attractiveness Analysis, by Country and Sub-region
Figure 67: Middle East & Africa Variable Area Flowmeters Market Attractiveness Analysis, by End-use Industry
Figure 68: South America Variable Area Flowmeters Market Revenue Projection and Y-o-Y Growth, 2018–2030 (US$ Mn and %)
Figure 69: South America Variable Area Flowmeters Market Volume Projection and Y-o-Y Growth, 2018–2030 (Thousand Units)
Figure 70: South America Variable Area Flowmeters Market Value Share Analysis, by Material Type (2020)
Figure 71: South America Variable Area Flowmeters Market Value Share Analysis, by Material Type (2030)
Figure 72: South America Variable Area Flowmeters Market Value Share Analysis, by End-use Industry (2020)
Figure 73: South America Variable Area Flowmeters Market Value Share Analysis, by End-use Industry (2030)
Figure 74: South America Variable Area Flowmeters Market Value Share Analysis, by Country and Sub-region (2020)
Figure 75: South America Variable Area Flowmeters Market Value Share Analysis, by Country and Sub-region (2030)
Figure 76: South America Variable Area Flowmeters Market Attractiveness Analysis, by Material Type
Figure 77: South America Variable Area Flowmeters Market Attractiveness Analysis, by Country and Sub-region
Figure 78: South America Variable Area Flowmeters Market Attractiveness Analysis, by End-use Industry
Figure 79: Global Variable Area Flowmeters Market Company Share Analysis, by Value
Figure 80: Global Variable Area Flowmeters Market Company Share Analysis, by Volume
Copyright © Transparency Market Research, Inc. All Rights reserved
Trust Online

Variable Area Flowmeters Market