
Reports
Reports
Of late, the global unmanned underwater vehicles market has been observing a tremendous growth in their valuation. With the significant rise in the oil and gas industry, the deep-water offshore activities for the production of oil and gas and the number of offshore constructions have increased substantially, which is influencing the uptake rate of unmanned underwater vehicles across the world. In addition, the surging threats over maritime security is expected to boost the demand for these vehicles over the next few years, reflecting positively on this market.
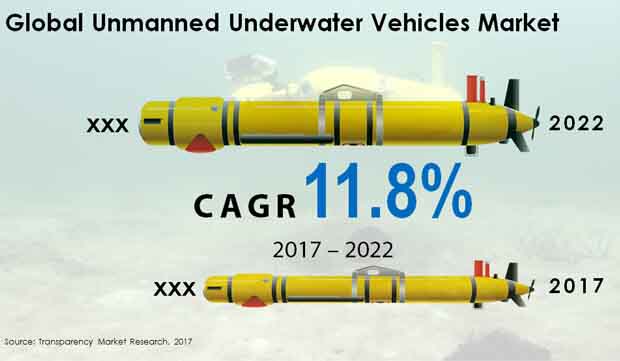
By 2017, the global market for unmanned underwater vehicles is anticipated to reach a value of US$2.4 bn. The opportunity in this market is anticipated further rise at a healthy CAGR of 11.80% over the period from 2017 to 2022 and increase to US$4.26 bn by the end of 2022.
The defense sector, scientific research, and commercial exploration are the key application areas for unmanned underwater vehicles across the world. Currently, the demand for these vehicles is relatively greater in the commercial exploration segment and the trend is projected to continue over the forthcoming years on the grounds of the considerable rise in various activities related to commercial exploration, such as seabed mapping, surveys, pipeline inspection, and offshore drilling.
Autonomous underwater vehicles (AUVs) and remotely operated vehicles (ROVs) have gained a reputation as the key unmanned underwater vehicles across the world. Among the two, ROVs have been the leading contributors to this market and are anticipated to remain so in the near future due to their increasing demand for ultra-deep water drilling. Mechanical systems, electrical systems, and hybrid systems are the most preferred propulsion systems utilized in unmanned underwater vehicles.
In terms of the geography, the worldwide market for unmanned underwater vehicles reports its reach across Asia Pacific excluding Japan (APEJ), North America, Europe, the Middle East and Africa (MEA), Latin America, and Japan. With early adoption of technology, North America has been leading the overall market for the last few years. This regional market is estimated to proliferate at a CAGR of 11.40% between 2017 and 2022, maintaining its dominance over the global market in the near future. The continual increase in the oil and gas exploration activities is likely to boost the North America market for unmanned underwater vehicles substantially over the next few years.
Europe and Asia Pacific excluding Japan are also witnessing significant growth in their respective markets for unmanned underwater vehicles, thanks to the increasing exploration activities in these regions. However, it is the Middle East and Africa that is expected to offer the most promising opportunities for the growth of the overall market in the near future. The ongoing expansion in the oil and gas industry and the increase in the activities related to the discovery of new oil and gas exploration fields between the Gulf of Mexico and Africa are expected to propel the Middle East and Africa market for unmanned underwater vehicles in the years to come.
The global market for unmanned underwater vehicles demonstrates a highly competitive business landscape. Some of the key vendors of unmanned underwater vehicles across the world are Subsea 7, Thales SA, Teledyne Gavia ehf, Boeing Co., Kongsberg Maritime AS, Oceaneering International Inc., General Dynamics Corp., Saab AB, Atlas Elektronik GMBH, and Lockheed Martin Corp.
The global unmanned underwater vehicles market is estimated to be driven by growing demand for maritime security and the rising trend of updation and modernization of underwater inspection. An unmanned underwater vehicle is a robot vehicle capable of operating underwater sans the occupancy of human being. As such, unmanned underwater vehicles are self-propelled. It is usually utilized in military operations and industries. These vehicles are designed in such a way that it operates for periods ranging from short to long time periods.
The global unmanned underwater vehicles market is likely to gather momentum from the increased integration of technological innovations. These vehicles are empowered with sensors and instruments that are needed for the certain tasks. These devices could be explosive devices, sonar, chemical injector, and camera. Unmanned underwater vehicles are utilized for subsea applications as they constantly help through high end computer systems. They make an offering of safe option for underwater exploration and activities, which is likely to pave way for rapid development of the global unmanned underwater vehicles market in the near future.
The offshore industry comprises oil and gas plants. The demand for energy has tripled in the last 50 years due to many technological innovations in emerging countries. With the constant depletion of traditional onshore reserves, offshore resources have been playing an important role in catering to the rising demand for energy. This factor has resulted in shifting the production facilities of oil and gas to subsea regions. These factors are estimated to pave way for rapid growth of the global unmanned underwater vehicles market in the forthcoming years.
Unmanned underwater vehicles have come up as a cost effective alternative for deep water drilling operations as they are able to operate autonomously and do away with the need of surface vessels. The utilization small and portable unmanned underwater vehicles are estimated to drive the demand for these vehicles in the forthcoming years.
1. Global Unmanned Underwater Vehicles Market - Executive Summary
2. Global Unmanned Underwater Vehicles Market Overview
2.1. Introduction
2.1.1. Global Unmanned Underwater Vehicles Market Taxonomy
2.1.2. Global Unmanned Underwater Vehicles Market Definition
2.2. Global Unmanned Underwater Vehicles Market Size (US$ Mn) and Forecast, 2012-2022
2.2.1. Global Unmanned Underwater Vehicles Market Y-o-Y Growth
2.3. Global Unmanned Underwater Vehicles Market Dynamics
2.4. Supply Chain
2.5. Cost Structure
2.6. Pricing Analysis
2.7. Raw Material Sourcing Strategy and Analysis
2.8. List of Distributors
2.9. Key Participants Market Presence (Intensity Map) By Region
3. Global Unmanned Underwater Vehicles Market Analysis and Forecast By Product
3.1. Global Unmanned Underwater Vehicles Market Size and Forecast By Product, 2012-2022
3.1.1. AUV Unmanned Underwater Vehicles Market Size and Forecast, 2012-2022
3.1.1.1. Revenue (US$ Mn) Comparison, By Region
3.1.1.2. Market Share Comparison, By Region
3.1.1.3. Y-o-Y growth Comparison, By Region
3.1.2. ROV Unmanned Underwater Vehicles Market Size and Forecast, 2012-2022
3.1.2.1. Revenue (US$ Mn) Comparison, By Region
3.1.2.2. Market Share Comparison, By Region
3.1.2.3. Y-o-Y growth Comparison, By Region
4. Global Unmanned Underwater Vehicles Market Analysis and Forecast By Propulsion System
4.1. Global Unmanned Underwater Vehicles Market Size and Forecast By Propulsion System, 2012-2022
4.1.1. Electrical Systems Unmanned Underwater Vehicles Market Size and Forecast, 2012-2022
4.1.1.1. Revenue (US$ Mn) Comparison, By Region
4.1.1.2. Market Share Comparison, By Region
4.1.1.3. Y-o-Y growth Comparison, By Region
4.1.2. Mechanical Systems Unmanned Underwater Vehicles Market Size and Forecast, 2012-2022
4.1.2.1. Revenue (US$ Mn) Comparison, By Region
4.1.2.2. Market Share Comparison, By Region
4.1.2.3. Y-o-Y growth Comparison, By Region
4.1.3. Hybrid Systems Unmanned Underwater Vehicles Market Size and Forecast, 2012-2022
4.1.3.1. Revenue (US$ Mn) Comparison, By Region
4.1.3.2. Market Share Comparison, By Region
4.1.3.3. Y-o-Y growth Comparison, By Region
5. Global Unmanned Underwater Vehicles Market Analysis and Forecast By Application
5.1. Global Unmanned Underwater Vehicles Market Size and Forecast By Application, 2012-2022
5.1.1. Commercial Exploration Unmanned Underwater Vehicles Market Size and Forecast, 2012-2022
5.1.1.1. Revenue (US$ Mn) Comparison, By Region
5.1.1.2. Market Share Comparison, By Region
5.1.1.3. Y-o-Y growth Comparison, By Region
5.1.2. Defense Unmanned Underwater Vehicles Market Size and Forecast, 2012-2022
5.1.2.1. Revenue (US$ Mn) Comparison, By Region
5.1.2.2. Market Share Comparison, By Region
5.1.2.3. Y-o-Y growth Comparison, By Region
5.1.3. Scientific Research Unmanned Underwater Vehicles Market Size and Forecast, 2012-2022
5.1.3.1. Revenue (US$ Mn) Comparison, By Region
5.1.3.2. Market Share Comparison, By Region
5.1.3.3. Y-o-Y growth Comparison, By Region
5.1.4. Others Unmanned Underwater Vehicles Market Size and Forecast, 2012-2022
5.1.4.1. Revenue (US$ Mn) Comparison, By Region
5.1.4.2. Market Share Comparison, By Region
5.1.4.3. Y-o-Y growth Comparison, By Region
6. Global Unmanned Underwater Vehicles Market Analysis and Forecast By Region
6.1. Global Unmanned Underwater Vehicles Market Size and Forecast, 2012-2022
6.1.1. North America Unmanned Underwater Vehicles Market Size and Forecast, 2012-2022
6.1.1.1. Revenue (US$ Mn) Comparison, By Product
6.1.1.2. Revenue (US$ Mn) Comparison, By Propulsion System
6.1.1.3. Revenue (US$ Mn) Comparison, By Application
6.1.2. Latin America Unmanned Underwater Vehicles Market Size and Forecast, 2012-2022
6.1.2.1. Revenue (US$ Mn) Comparison, By Product
6.1.2.2. Revenue (US$ Mn) Comparison, By Propulsion System
6.1.2.3. Revenue (US$ Mn) Comparison, By Application
6.1.3. Europe Unmanned Underwater Vehicles Market Size and Forecast, 2012-2022
6.1.3.1. Revenue (US$ Mn) Comparison, By Product
6.1.3.2. Revenue (US$ Mn) Comparison, By Propulsion System
6.1.3.3. Revenue (US$ Mn) Comparison, By Application
6.1.4. Japan Unmanned Underwater Vehicles Market Size and Forecast, 2012-2022
6.1.4.1. Revenue (US$ Mn) Comparison, By Product
6.1.4.2. Revenue (US$ Mn) Comparison, By Propulsion System
6.1.4.3. Revenue (US$ Mn) Comparison, By Application
6.1.5. APEJ Unmanned Underwater Vehicles Market Size and Forecast, 2012-2022
6.1.5.1. Revenue (US$ Mn) Comparison, By Product
6.1.5.2. Revenue (US$ Mn) Comparison, By Propulsion System
6.1.5.3. Revenue (US$ Mn) Comparison, By Application
6.1.6. MEA Unmanned Underwater Vehicles Market Size and Forecast, 2012-2022
6.1.6.1. Revenue (US$ Mn) Comparison, By Product
6.1.6.2. Revenue (US$ Mn) Comparison, By Propulsion System
6.1.6.3. Revenue (US$ Mn) Comparison, By Application
7. North America Unmanned Underwater Vehicles Market Analysis and Forecast, By Country, 2012-2022
7.1. US Unmanned Underwater Vehicles Market Size and Forecast, 2012-2022
7.1.1. Revenue (US$ Mn) Comparison, By Product
7.1.2. Revenue (US$ Mn) Comparison, By Propulsion System
7.1.3. Revenue (US$ Mn) Comparison, By Application
7.2. Canada Unmanned Underwater Vehicles Market Size and Forecast, 2012-2022
7.2.1. Revenue (US$ Mn) Comparison, By Product
7.2.2. Revenue (US$ Mn) Comparison, By Propulsion System
7.2.3. Revenue (US$ Mn) Comparison, By Application
8. Latin America Unmanned Underwater Vehicles Market Analysis and Forecast, By Country, 2012-2022
8.1. Brazil Unmanned Underwater Vehicles Market Size and Forecast, 2012-2022
8.1.1. Revenue (US$ Mn) Comparison, By Product
8.1.2. Revenue (US$ Mn) Comparison, By Propulsion System
8.1.3. Revenue (US$ Mn) Comparison, By Application
8.2. Mexico Unmanned Underwater Vehicles Market Size and Forecast, 2012-2022
8.2.1. Revenue (US$ Mn) Comparison, By Product
8.2.2. Revenue (US$ Mn) Comparison, By Propulsion System
8.2.3. Revenue (US$ Mn) Comparison, By Application
8.3. Argentina Unmanned Underwater Vehicles Market Size and Forecast, 2012-2022
8.3.1. Revenue (US$ Mn) Comparison, By Product
8.3.2. Revenue (US$ Mn) Comparison, By Propulsion System
8.3.3. Revenue (US$ Mn) Comparison, By Application
9. Europe Unmanned Underwater Vehicles Market Analysis and Forecast, By Country, 2012-2022
9.1. Germany Unmanned Underwater Vehicles Market Size and Forecast, 2012-2022
9.1.1. Revenue (US$ Mn) Comparison, By Product
9.1.2. Revenue (US$ Mn) Comparison, By Propulsion System
9.1.3. Revenue (US$ Mn) Comparison, By Application
9.2. UK Unmanned Underwater Vehicles Market Size and Forecast, 2012-2022
9.2.1. Revenue (US$ Mn) Comparison, By Product
9.2.2. Revenue (US$ Mn) Comparison, By Propulsion System
9.2.3. Revenue (US$ Mn) Comparison, By Application
9.3. France Unmanned Underwater Vehicles Market Size and Forecast, 2012-2022
9.3.1. Revenue (US$ Mn) Comparison, By Product
9.3.2. Revenue (US$ Mn) Comparison, By Propulsion System
9.3.3. Revenue (US$ Mn) Comparison, By Application
9.4. Spain Unmanned Underwater Vehicles Market Size and Forecast, 2012-2022
9.4.1. Revenue (US$ Mn) Comparison, By Product
9.4.2. Revenue (US$ Mn) Comparison, By Propulsion System
9.4.3. Revenue (US$ Mn) Comparison, By Application
9.5. Italy Unmanned Underwater Vehicles Market Size and Forecast, 2012-2022
9.5.1. Revenue (US$ Mn) Comparison, By Product
9.5.2. Revenue (US$ Mn) Comparison, By Propulsion System
9.5.3. Revenue (US$ Mn) Comparison, By Application
9.6. Nordic Unmanned Underwater Vehicles Market Size and Forecast, 2012-2022
9.6.1. Revenue (US$ Mn) Comparison, By Product
9.6.2. Revenue (US$ Mn) Comparison, By Propulsion System
9.6.3. Revenue (US$ Mn) Comparison, By Application
10. Japan Unmanned Underwater Vehicles Market Analysis and Forecast, By Country, 2012-2022
10.1. Japan Unmanned Underwater Vehicles Market Size and Forecast, 2012-2022
10.1.1. Revenue (US$ Mn) Comparison, By Product
10.1.2. Revenue (US$ Mn) Comparison, By Propulsion System
10.1.3. Revenue (US$ Mn) Comparison, By Application
11. APEJ Unmanned Underwater Vehicles Market Analysis and Forecast, By Country, 2012-2022
11.1. China Unmanned Underwater Vehicles Market Size and Forecast, 2012-2022
11.1.1. Revenue (US$ Mn) Comparison, By Product
11.1.2. Revenue (US$ Mn) Comparison, By Propulsion System
11.1.3. Revenue (US$ Mn) Comparison, By Application
11.2. India Unmanned Underwater Vehicles Market Size and Forecast, 2012-2022
11.2.1. Revenue (US$ Mn) Comparison, By Product
11.2.2. Revenue (US$ Mn) Comparison, By Propulsion System
11.2.3. Revenue (US$ Mn) Comparison, By Application
11.3. South Korea Unmanned Underwater Vehicles Market Size and Forecast, 2012-2022
11.3.1. Revenue (US$ Mn) Comparison, By Product
11.3.2. Revenue (US$ Mn) Comparison, By Propulsion System
11.3.3. Revenue (US$ Mn) Comparison, By Application
11.4. Indonesia Unmanned Underwater Vehicles Market Size and Forecast, 2012-2022
11.4.1. Revenue (US$ Mn) Comparison, By Product
11.4.2. Revenue (US$ Mn) Comparison, By Propulsion System
11.4.3. Revenue (US$ Mn) Comparison, By Application
11.5. Singapore Unmanned Underwater Vehicles Market Size and Forecast, 2012-2022
11.5.1. Revenue (US$ Mn) Comparison, By Product
11.5.2. Revenue (US$ Mn) Comparison, By Propulsion System
11.5.3. Revenue (US$ Mn) Comparison, By Application
11.6. Australia Unmanned Underwater Vehicles Market Size and Forecast, 2012-2022
11.6.1. Revenue (US$ Mn) Comparison, By Product
11.6.2. Revenue (US$ Mn) Comparison, By Propulsion System
11.6.3. Revenue (US$ Mn) Comparison, By Application
12. MEA Unmanned Underwater Vehicles Market Analysis and Forecast, By Country, 2012-2022
12.1. GCC Countries Unmanned Underwater Vehicles Market Size and Forecast, 2012-2022
12.1.1. Revenue (US$ Mn) Comparison, By Product
12.1.2. Revenue (US$ Mn) Comparison, By Propulsion System
12.1.3. Revenue (US$ Mn) Comparison, By Application
12.2. South Africa Unmanned Underwater Vehicles Market Size and Forecast, 2012-2022
12.2.1. Revenue (US$ Mn) Comparison, By Product
12.2.2. Revenue (US$ Mn) Comparison, By Propulsion System
12.2.3. Revenue (US$ Mn) Comparison, By Application
12.3. Turkey Unmanned Underwater Vehicles Market Size and Forecast, 2012-2022
12.3.1. Revenue (US$ Mn) Comparison, By Product
12.3.2. Revenue (US$ Mn) Comparison, By Propulsion System
12.3.3. Revenue (US$ Mn) Comparison, By Application
12.4. Israel Unmanned Underwater Vehicles Market Size and Forecast, 2012-2022
12.4.1. Revenue (US$ Mn) Comparison, By Product
12.4.2. Revenue (US$ Mn) Comparison, By Propulsion System
12.4.3. Revenue (US$ Mn) Comparison, By Application
13. Global Unmanned Underwater Vehicles Market Company Share, Competition Landscape and Company Profiles
13.1. Company Share Analysis
13.2. Competition Landscape
13.3. Company Profiles
13.3.1. Atlas Elektronik GMBH
13.3.2. Teledyne Gavia ehf
13.3.3. Saab AB
13.3.4. Lockheed Martin Corporation
13.3.5. Kongsberg Maritime AS
13.3.6. Thales SA
13.3.7. General Dynamics Corporation
13.3.8. Oceaneering International Inc.
13.3.9. Boeing Company
13.3.10. Subsea 7
14. Research Methodology
15. Secondary and Primary Sources
16. Assumptions and Acronyms
17. Disclaimer
List of Tables
TABLE 1 Global Unmanned Underwater Vehicles Market Value (US$ Mn), 2012-2016
TABLE 2 Global Unmanned Underwater Vehicles Market Value (US$ Mn), 2017-2022
TABLE 3 Global Unmanned Underwater Vehicles Market Value (US$ Mn) and Y-o-Y, 2015-2022
TABLE 4 Global AUV Segment Value (US$ Mn), By Region 2012-2016
TABLE 5 Global AUV Segment Value (US$ Mn), By Region 2017-2022
TABLE 6 Global AUV Segment Market Share, By Region 2012-2016
TABLE 7 Global AUV Segment Market Share, By Region 2017-2022
TABLE 8 Global AUV Segment Y-o-Y, By Region 2015-2022
TABLE 9 Global ROV Segment Value (US$ Mn), By Region 2012-2016
TABLE 10 Global ROV Segment Value (US$ Mn), By Region 2017-2022
TABLE 11 Global ROV Segment Market Share, By Region 2012-2016
TABLE 12 Global ROV Segment Market Share, By Region 2017-2022
TABLE 13 Global ROV Segment Y-o-Y, By Region 2015-2022
TABLE 14 Global Electrical Systems Segment Value (US$ Mn), By Region 2012-2016
TABLE 15 Global Electrical Systems Segment Value (US$ Mn), By Region 2017-2022
TABLE 16 Global Electrical Systems Segment Market Share, By Region 2012-2016
TABLE 17 Global Electrical Systems Segment Market Share, By Region 2017-2022
TABLE 18 Global Electrical Systems Segment Y-o-Y, By Region 2015-2022
TABLE 19 Global Mechanical Systems Segment Value (US$ Mn), By Region 2012-2016
TABLE 20 Global Mechanical Systems Segment Value (US$ Mn), By Region 2017-2022
TABLE 21 Global Mechanical Systems Segment Market Share, By Region 2012-2016
TABLE 22 Global Mechanical Systems Segment Market Share, By Region 2017-2022
TABLE 23 Global Mechanical Systems Segment Y-o-Y, By Region 2015-2022
TABLE 24 Global Hybrid Systems Segment Value (US$ Mn), By Region 2012-2016
TABLE 25 Global Hybrid Systems Segment Value (US$ Mn), By Region 2017-2022
TABLE 26 Global Hybrid Systems Segment Market Share, By Region 2012-2016
TABLE 27 Global Hybrid Systems Segment Market Share, By Region 2017-2022
TABLE 28 Global Hybrid Systems Segment Y-o-Y, By Region 2015-2022
TABLE 29 Global Commercial Exploration Segment Value (US$ Mn), By Region 2012-2016
TABLE 30 Global Commercial Exploration Segment Value (US$ Mn), By Region 2017-2022
TABLE 31 Global Commercial Exploration Segment Market Share, By Region 2012-2016
TABLE 32 Global Commercial Exploration Segment Market Share, By Region 2017-2022
TABLE 33 Global Commercial Exploration Segment Y-o-Y, By Region 2015-2022
TABLE 34 Global Defense Segment Value (US$ Mn), By Region 2012-2016
TABLE 35 Global Defense Segment Value (US$ Mn), By Region 2017-2022
TABLE 36 Global Defense Segment Market Share, By Region 2012-2016
TABLE 37 Global Defense Segment Market Share, By Region 2017-2022
TABLE 38 Global Defense Segment Y-o-Y, By Region 2015-2022
TABLE 39 Global Scientific Research Segment Value (US$ Mn), By Region 2012-2016
TABLE 40 Global Scientific Research Segment Value (US$ Mn), By Region 2017-2022
TABLE 41 Global Scientific Research Segment Market Share, By Region 2012-2016
TABLE 42 Global Scientific Research Segment Market Share, By Region 2017-2022
TABLE 43 Global Scientific Research Segment Y-o-Y, By Region 2015-2022
TABLE 44 Global Others Segment Value (US$ Mn), By Region 2012-2016
TABLE 45 Global Others Segment Value (US$ Mn), By Region 2017-2022
TABLE 46 Global Others Segment Market Share, By Region 2012-2016
TABLE 47 Global Others Segment Market Share, By Region 2017-2022
TABLE 48 Global Others Segment Y-o-Y, By Region 2015-2022
TABLE 49 North America Unmanned Underwater Vehicles Market Value (US$ Mn), By Product 2012-2016
TABLE 50 North America Unmanned Underwater Vehicles Market Value (US$ Mn), By Product 2017-2022
TABLE 51 North America Unmanned Underwater Vehicles Market Value (US$ Mn), By Propulsion System 2012-2016
TABLE 52 North America Unmanned Underwater Vehicles Market Value (US$ Mn), By Propulsion System 2017-2022
TABLE 53 North America Unmanned Underwater Vehicles Market Value (US$ Mn), By Application 2012-2016
TABLE 54 North America Unmanned Underwater Vehicles Market Value (US$ Mn), By Application 2017-2022
TABLE 55 Latin America Unmanned Underwater Vehicles Market Value (US$ Mn), By Product 2012-2016
TABLE 56 Latin America Unmanned Underwater Vehicles Market Value (US$ Mn), By Product 2017-2022
TABLE 57 Latin America Unmanned Underwater Vehicles Market Value (US$ Mn), By Propulsion System 2012-2016
TABLE 58 Latin America Unmanned Underwater Vehicles Market Value (US$ Mn), By Propulsion System 2017-2022
TABLE 59 Latin America Unmanned Underwater Vehicles Market Value (US$ Mn), By Application 2012-2016
TABLE 60 Latin America Unmanned Underwater Vehicles Market Value (US$ Mn), By Application 2017-2022
TABLE 61 Europe Unmanned Underwater Vehicles Market Value (US$ Mn), By Product 2012-2016
TABLE 62 Europe Unmanned Underwater Vehicles Market Value (US$ Mn), By Product 2017-2022
TABLE 63 Europe Unmanned Underwater Vehicles Market Value (US$ Mn), By Propulsion System 2012-2016
TABLE 64 Europe Unmanned Underwater Vehicles Market Value (US$ Mn), By Propulsion System 2017-2022
TABLE 65 Europe Unmanned Underwater Vehicles Market Value (US$ Mn), By Application 2012-2016
TABLE 66 Europe Unmanned Underwater Vehicles Market Value (US$ Mn), By Application 2017-2022
TABLE 67 Japan Unmanned Underwater Vehicles Market Value (US$ Mn), By Product 2012-2016
TABLE 68 Japan Unmanned Underwater Vehicles Market Value (US$ Mn), By Product 2017-2022
TABLE 69 Japan Unmanned Underwater Vehicles Market Value (US$ Mn), By Propulsion System 2012-2016
TABLE 70 Japan Unmanned Underwater Vehicles Market Value (US$ Mn), By Propulsion System 2017-2022
TABLE 71 Japan Unmanned Underwater Vehicles Market Value (US$ Mn), By Application 2012-2016
TABLE 72 Japan Unmanned Underwater Vehicles Market Value (US$ Mn), By Application 2017-2022
TABLE 73 APEJ Unmanned Underwater Vehicles Market Value (US$ Mn), By Product 2012-2016
TABLE 74 APEJ Unmanned Underwater Vehicles Market Value (US$ Mn), By Product 2017-2022
TABLE 75 APEJ Unmanned Underwater Vehicles Market Value (US$ Mn), By Propulsion System 2012-2016
TABLE 76 APEJ Unmanned Underwater Vehicles Market Value (US$ Mn), By Propulsion System 2017-2022
TABLE 77 APEJ Unmanned Underwater Vehicles Market Value (US$ Mn), By Application 2012-2016
TABLE 78 APEJ Unmanned Underwater Vehicles Market Value (US$ Mn), By Application 2017-2022
TABLE 79 MEA Unmanned Underwater Vehicles Market Value (US$ Mn), By Product 2012-2016
TABLE 80 MEA Unmanned Underwater Vehicles Market Value (US$ Mn), By Product 2017-2022
TABLE 81 MEA Unmanned Underwater Vehicles Market Value (US$ Mn), By Propulsion System 2012-2016
TABLE 82 MEA Unmanned Underwater Vehicles Market Value (US$ Mn), By Propulsion System 2017-2022
TABLE 83 MEA Unmanned Underwater Vehicles Market Value (US$ Mn), By Application 2012-2016
TABLE 84 MEA Unmanned Underwater Vehicles Market Value (US$ Mn), By Application 2017-2022
TABLE 85 US Unmanned Underwater Vehicles Market Value (US$ Mn), By Product 2012-2016
TABLE 86 US Unmanned Underwater Vehicles Market Value (US$ Mn), By Product 2017-2022
TABLE 87 US Unmanned Underwater Vehicles Market Value (US$ Mn), By Propulsion System 2012-2016
TABLE 88 US Unmanned Underwater Vehicles Market Value (US$ Mn), By Propulsion System 2017-2022
TABLE 89 US Unmanned Underwater Vehicles Market Value (US$ Mn), By Application 2012-2016
TABLE 90 US Unmanned Underwater Vehicles Market Value (US$ Mn), By Application 2017-2022
TABLE 91 Canada Unmanned Underwater Vehicles Market Value (US$ Mn), By Product 2012-2016
TABLE 92 Canada Unmanned Underwater Vehicles Market Value (US$ Mn), By Product 2017-2022
TABLE 93 Canada Unmanned Underwater Vehicles Market Value (US$ Mn), By Propulsion System 2012-2016
TABLE 94 Canada Unmanned Underwater Vehicles Market Value (US$ Mn), By Propulsion System 2017-2022
TABLE 95 Canada Unmanned Underwater Vehicles Market Value (US$ Mn), By Application 2012-2016
TABLE 96 Canada Unmanned Underwater Vehicles Market Value (US$ Mn), By Application 2017-2022
TABLE 97 Brazil Unmanned Underwater Vehicles Market Value (US$ Mn), By Product 2012-2016
TABLE 98 Brazil Unmanned Underwater Vehicles Market Value (US$ Mn), By Product 2017-2022
TABLE 99 Brazil Unmanned Underwater Vehicles Market Value (US$ Mn), By Propulsion System 2012-2016
TABLE 100 Brazil Unmanned Underwater Vehicles Market Value (US$ Mn), By Propulsion System 2017-2022
TABLE 101 Brazil Unmanned Underwater Vehicles Market Value (US$ Mn), By Application 2012-2016
TABLE 102 Brazil Unmanned Underwater Vehicles Market Value (US$ Mn), By Application 2017-2022
TABLE 103 Mexico Unmanned Underwater Vehicles Market Value (US$ Mn), By Product 2012-2016
TABLE 104 Mexico Unmanned Underwater Vehicles Market Value (US$ Mn), By Product 2017-2022
TABLE 105 Mexico Unmanned Underwater Vehicles Market Value (US$ Mn), By Propulsion System 2012-2016
TABLE 106 Mexico Unmanned Underwater Vehicles Market Value (US$ Mn), By Propulsion System 2017-2022
TABLE 107 Mexico Unmanned Underwater Vehicles Market Value (US$ Mn), By Application 2012-2016
TABLE 108 Mexico Unmanned Underwater Vehicles Market Value (US$ Mn), By Application 2017-2022
TABLE 109 Argentina Unmanned Underwater Vehicles Market Value (US$ Mn), By Product 2012-2016
TABLE 110 Argentina Unmanned Underwater Vehicles Market Value (US$ Mn), By Product 2017-2022
TABLE 111 Argentina Unmanned Underwater Vehicles Market Value (US$ Mn), By Propulsion System 2012-2016
TABLE 112 Argentina Unmanned Underwater Vehicles Market Value (US$ Mn), By Propulsion System 2017-2022
TABLE 113 Argentina Unmanned Underwater Vehicles Market Value (US$ Mn), By Application 2012-2016
TABLE 114 Argentina Unmanned Underwater Vehicles Market Value (US$ Mn), By Application 2017-2022
TABLE 115 Germany Unmanned Underwater Vehicles Market Value (US$ Mn), By Product 2012-2016
TABLE 116 Germany Unmanned Underwater Vehicles Market Value (US$ Mn), By Product 2017-2022
TABLE 117 Germany Unmanned Underwater Vehicles Market Value (US$ Mn), By Propulsion System 2012-2016
TABLE 118 Germany Unmanned Underwater Vehicles Market Value (US$ Mn), By Propulsion System 2017-2022
TABLE 119 Germany Unmanned Underwater Vehicles Market Value (US$ Mn), By Application 2012-2016
TABLE 120 Germany Unmanned Underwater Vehicles Market Value (US$ Mn), By Application 2017-2022
TABLE 121 UK Unmanned Underwater Vehicles Market Value (US$ Mn), By Product 2012-2016
TABLE 122 UK Unmanned Underwater Vehicles Market Value (US$ Mn), By Product 2017-2022
TABLE 123 UK Unmanned Underwater Vehicles Market Value (US$ Mn), By Propulsion System 2012-2016
TABLE 124 UK Unmanned Underwater Vehicles Market Value (US$ Mn), By Propulsion System 2017-2022
TABLE 125 UK Unmanned Underwater Vehicles Market Value (US$ Mn), By Application 2012-2016
TABLE 126 UK Unmanned Underwater Vehicles Market Value (US$ Mn), By Application 2017-2022
TABLE 127 France Unmanned Underwater Vehicles Market Value (US$ Mn), By Product 2012-2016
TABLE 128 France Unmanned Underwater Vehicles Market Value (US$ Mn), By Product 2017-2022
TABLE 129 France Unmanned Underwater Vehicles Market Value (US$ Mn), By Propulsion System 2012-2016
TABLE 130 France Unmanned Underwater Vehicles Market Value (US$ Mn), By Propulsion System 2017-2022
TABLE 131 France Unmanned Underwater Vehicles Market Value (US$ Mn), By Application 2012-2016
TABLE 132 France Unmanned Underwater Vehicles Market Value (US$ Mn), By Application 2017-2022
TABLE 133 Spain Unmanned Underwater Vehicles Market Value (US$ Mn), By Product 2012-2016
TABLE 134 Spain Unmanned Underwater Vehicles Market Value (US$ Mn), By Product 2017-2022
TABLE 135 Spain Unmanned Underwater Vehicles Market Value (US$ Mn), By Propulsion System 2012-2016
TABLE 136 Spain Unmanned Underwater Vehicles Market Value (US$ Mn), By Propulsion System 2017-2022
TABLE 137 Spain Unmanned Underwater Vehicles Market Value (US$ Mn), By Application 2012-2016
TABLE 138 Spain Unmanned Underwater Vehicles Market Value (US$ Mn), By Application 2017-2022
TABLE 139 Italy Unmanned Underwater Vehicles Market Value (US$ Mn), By Product 2012-2016
TABLE 140 Italy Unmanned Underwater Vehicles Market Value (US$ Mn), By Product 2017-2022
TABLE 141 Italy Unmanned Underwater Vehicles Market Value (US$ Mn), By Propulsion System 2012-2016
TABLE 142 Italy Unmanned Underwater Vehicles Market Value (US$ Mn), By Propulsion System 2017-2022
TABLE 143 Italy Unmanned Underwater Vehicles Market Value (US$ Mn), By Application 2012-2016
TABLE 144 Italy Unmanned Underwater Vehicles Market Value (US$ Mn), By Application 2017-2022
TABLE 145 Nordic Unmanned Underwater Vehicles Market Value (US$ Mn), By Product 2012-2016
TABLE 146 Nordic Unmanned Underwater Vehicles Market Value (US$ Mn), By Product 2017-2022
TABLE 147 Nordic Unmanned Underwater Vehicles Market Value (US$ Mn), By Propulsion System 2012-2016
TABLE 148 Nordic Unmanned Underwater Vehicles Market Value (US$ Mn), By Propulsion System 2017-2022
TABLE 149 Nordic Unmanned Underwater Vehicles Market Value (US$ Mn), By Application 2012-2016
TABLE 150 Nordic Unmanned Underwater Vehicles Market Value (US$ Mn), By Application 2017-2022
TABLE 151 Japan Unmanned Underwater Vehicles Market Value (US$ Mn), By Product 2012-2016
TABLE 152 Japan Unmanned Underwater Vehicles Market Value (US$ Mn), By Product 2017-2022
TABLE 153 Japan Unmanned Underwater Vehicles Market Value (US$ Mn), By Propulsion System 2012-2016
TABLE 154 Japan Unmanned Underwater Vehicles Market Value (US$ Mn), By Propulsion System 2017-2022
TABLE 155 Japan Unmanned Underwater Vehicles Market Value (US$ Mn), By Application 2012-2016
TABLE 156 Japan Unmanned Underwater Vehicles Market Value (US$ Mn), By Application 2017-2022
TABLE 157 China Unmanned Underwater Vehicles Market Value (US$ Mn), By Product 2012-2016
TABLE 158 China Unmanned Underwater Vehicles Market Value (US$ Mn), By Product 2017-2022
TABLE 159 China Unmanned Underwater Vehicles Market Value (US$ Mn), By Propulsion System 2012-2016
TABLE 160 China Unmanned Underwater Vehicles Market Value (US$ Mn), By Propulsion System 2017-2022
TABLE 161 China Unmanned Underwater Vehicles Market Value (US$ Mn), By Application 2012-2016
TABLE 162 China Unmanned Underwater Vehicles Market Value (US$ Mn), By Application 2017-2022
TABLE 163 India Unmanned Underwater Vehicles Market Value (US$ Mn), By Product 2012-2016
TABLE 164 India Unmanned Underwater Vehicles Market Value (US$ Mn), By Product 2017-2022
TABLE 165 India Unmanned Underwater Vehicles Market Value (US$ Mn), By Propulsion System 2012-2016
TABLE 166 India Unmanned Underwater Vehicles Market Value (US$ Mn), By Propulsion System 2017-2022
TABLE 167 India Unmanned Underwater Vehicles Market Value (US$ Mn), By Application 2012-2016
TABLE 168 India Unmanned Underwater Vehicles Market Value (US$ Mn), By Application 2017-2022
TABLE 169 South Korea Unmanned Underwater Vehicles Market Value (US$ Mn), By Product 2012-2016
TABLE 170 South Korea Unmanned Underwater Vehicles Market Value (US$ Mn), By Product 2017-2022
TABLE 171 South Korea Unmanned Underwater Vehicles Market Value (US$ Mn), By Propulsion System 2012-2016
TABLE 172 South Korea Unmanned Underwater Vehicles Market Value (US$ Mn), By Propulsion System 2017-2022
TABLE 173 South Korea Unmanned Underwater Vehicles Market Value (US$ Mn), By Application 2012-2016
TABLE 174 South Korea Unmanned Underwater Vehicles Market Value (US$ Mn), By Application 2017-2022
TABLE 175 Indonesia Unmanned Underwater Vehicles Market Value (US$ Mn), By Product 2012-2016
TABLE 176 Indonesia Unmanned Underwater Vehicles Market Value (US$ Mn), By Product 2017-2022
TABLE 177 Indonesia Unmanned Underwater Vehicles Market Value (US$ Mn), By Propulsion System 2012-2016
TABLE 178 Indonesia Unmanned Underwater Vehicles Market Value (US$ Mn), By Propulsion System 2017-2022
TABLE 179 Indonesia Unmanned Underwater Vehicles Market Value (US$ Mn), By Application 2012-2016
TABLE 180 Indonesia Unmanned Underwater Vehicles Market Value (US$ Mn), By Application 2017-2022
TABLE 181 Singapore Unmanned Underwater Vehicles Market Value (US$ Mn), By Product 2012-2016
TABLE 182 Singapore Unmanned Underwater Vehicles Market Value (US$ Mn), By Product 2017-2022
TABLE 183 Singapore Unmanned Underwater Vehicles Market Value (US$ Mn), By Propulsion System 2012-2016
TABLE 184 Singapore Unmanned Underwater Vehicles Market Value (US$ Mn), By Propulsion System 2017-2022
TABLE 185 Singapore Unmanned Underwater Vehicles Market Value (US$ Mn), By Application 2012-2016
TABLE 186 Singapore Unmanned Underwater Vehicles Market Value (US$ Mn), By Application 2017-2022
TABLE 187 Australia Unmanned Underwater Vehicles Market Value (US$ Mn), By Product 2012-2016
TABLE 188 Australia Unmanned Underwater Vehicles Market Value (US$ Mn), By Product 2017-2022
TABLE 189 Australia Unmanned Underwater Vehicles Market Value (US$ Mn), By Propulsion System 2012-2016
TABLE 190 Australia Unmanned Underwater Vehicles Market Value (US$ Mn), By Propulsion System 2017-2022
TABLE 191 Australia Unmanned Underwater Vehicles Market Value (US$ Mn), By Application 2012-2016
TABLE 192 Australia Unmanned Underwater Vehicles Market Value (US$ Mn), By Application 2017-2022
TABLE 193 GCC Countries Unmanned Underwater Vehicles Market Value (US$ Mn), By Product 2012-2016
TABLE 194 GCC Countries Unmanned Underwater Vehicles Market Value (US$ Mn), By Product 2017-2022
TABLE 195 GCC Countries Unmanned Underwater Vehicles Market Value (US$ Mn), By Propulsion System 2012-2016
TABLE 196 GCC Countries Unmanned Underwater Vehicles Market Value (US$ Mn), By Propulsion System 2017-2022
TABLE 197 GCC Countries Unmanned Underwater Vehicles Market Value (US$ Mn), By Application 2012-2016
TABLE 198 GCC Countries Unmanned Underwater Vehicles Market Value (US$ Mn), By Application 2017-2022
TABLE 199 South Africa Unmanned Underwater Vehicles Market Value (US$ Mn), By Product 2012-2016
TABLE 200 South Africa Unmanned Underwater Vehicles Market Value (US$ Mn), By Product 2017-2022
TABLE 201 South Africa Unmanned Underwater Vehicles Market Value (US$ Mn), By Propulsion System 2012-2016
TABLE 202 South Africa Unmanned Underwater Vehicles Market Value (US$ Mn), By Propulsion System 2017-2022
TABLE 203 South Africa Unmanned Underwater Vehicles Market Value (US$ Mn), By Application 2012-2016
TABLE 204 South Africa Unmanned Underwater Vehicles Market Value (US$ Mn), By Application 2017-2022
TABLE 205 Turkey Unmanned Underwater Vehicles Market Value (US$ Mn), By Product 2012-2016
TABLE 206 Turkey Unmanned Underwater Vehicles Market Value (US$ Mn), By Product 2017-2022
TABLE 207 Turkey Unmanned Underwater Vehicles Market Value (US$ Mn), By Propulsion System 2012-2016
TABLE 208 Turkey Unmanned Underwater Vehicles Market Value (US$ Mn), By Propulsion System 2017-2022
TABLE 209 Turkey Unmanned Underwater Vehicles Market Value (US$ Mn), By Application 2012-2016
TABLE 210 Turkey Unmanned Underwater Vehicles Market Value (US$ Mn), By Application 2017-2022
TABLE 211 Israel Unmanned Underwater Vehicles Market Value (US$ Mn), By Product 2012-2016
TABLE 212 Israel Unmanned Underwater Vehicles Market Value (US$ Mn), By Product 2017-2022
TABLE 213 Israel Unmanned Underwater Vehicles Market Value (US$ Mn), By Propulsion System 2012-2016
TABLE 214 Israel Unmanned Underwater Vehicles Market Value (US$ Mn), By Propulsion System 2017-2022
TABLE 215 Israel Unmanned Underwater Vehicles Market Value (US$ Mn), By Application 2012-2016
TABLE 216 Israel Unmanned Underwater Vehicles Market Value (US$ Mn), By Application 2017-2022
List of Figures
FIG. 1 Global Unmanned Underwater Vehicles Market Value (US$ Mn), 2012-2016
FIG. 2 Global Unmanned Underwater Vehicles Market Value (US$ Mn) Forecast, 2017-2022
FIG. 3 Global Unmanned Underwater Vehicles Market Value (US$ Mn) and Y-o-Y, 2015-2022
FIG. 4 Global AUV Segment Market Value (US$ Mn) By Region, 2012-2016
FIG. 5 Global AUV Segment Market Value (US$ Mn) By Region, 2017-2022
FIG. 6 Global AUV Segment Y-o-Y Growth Rate, By Region, 2015-2022
FIG. 7 Global ROV Segment Market Value (US$ Mn) By Region, 2012-2016
FIG. 8 Global ROV Segment Market Value (US$ Mn) By Region, 2017-2022
FIG. 9 Global ROV Segment Y-o-Y Growth Rate, By Region, 2015-2022
FIG. 10 Global Electrical Systems Segment Market Value (US$ Mn) By Region, 2012-2016
FIG. 11 Global Electrical Systems Segment Market Value (US$ Mn) By Region, 2017-2022
FIG. 12 Global Electrical Systems Segment Y-o-Y Growth Rate, By Region, 2015-2022
FIG. 13 Global Mechanical Systems Segment Market Value (US$ Mn) By Region, 2012-2016
FIG. 14 Global Mechanical Systems Segment Market Value (US$ Mn) By Region, 2017-2022
FIG. 15 Global Mechanical Systems Segment Y-o-Y Growth Rate, By Region, 2015-2022
FIG. 16 Global Hybrid Systems Segment Market Value (US$ Mn) By Region, 2012-2016
FIG. 17 Global Hybrid Systems Segment Market Value (US$ Mn) By Region, 2017-2022
FIG. 18 Global Hybrid Systems Segment Y-o-Y Growth Rate, By Region, 2015-2022
FIG. 19 Global Commercial Exploration Segment Market Value (US$ Mn) By Region, 2012-2016
FIG. 20 Global Commercial Exploration Segment Market Value (US$ Mn) By Region, 2017-2022
FIG. 21 Global Commercial Exploration Segment Y-o-Y Growth Rate, By Region, 2015-2022
FIG. 22 Global Defense Segment Market Value (US$ Mn) By Region, 2012-2016
FIG. 23 Global Defense Segment Market Value (US$ Mn) By Region, 2017-2022
FIG. 24 Global Defense Segment Y-o-Y Growth Rate, By Region, 2015-2022
FIG. 25 Global Scientific Research Segment Market Value (US$ Mn) By Region, 2012-2016
FIG. 26 Global Scientific Research Segment Market Value (US$ Mn) By Region, 2017-2022
FIG. 27 Global Scientific Research Segment Y-o-Y Growth Rate, By Region, 2015-2022
FIG. 28 Global Others Segment Market Value (US$ Mn) By Region, 2012-2016
FIG. 29 Global Others Segment Market Value (US$ Mn) By Region, 2017-2022
FIG. 30 Global Others Segment Y-o-Y Growth Rate, By Region, 2015-2022
FIG. 31 North America Unmanned Underwater Vehicles Market Value (US$ Mn), By Product 2012-2016
FIG. 32 North America Unmanned Underwater Vehicles Market Value (US$ Mn), By Product 2017-2022
FIG. 33 North America Unmanned Underwater Vehicles Market Value (US$ Mn), By Propulsion System 2012-2016
FIG. 34 North America Unmanned Underwater Vehicles Market Value (US$ Mn), By Propulsion System 2017-2022
FIG. 35 North America Unmanned Underwater Vehicles Market Value (US$ Mn), By Application 2012-2016
FIG. 36 North America Unmanned Underwater Vehicles Market Value (US$ Mn), By Application 2017-2022
FIG. 37 Latin America Unmanned Underwater Vehicles Market Value (US$ Mn), By Product 2012-2016
FIG. 38 Latin America Unmanned Underwater Vehicles Market Value (US$ Mn), By Product 2017-2022
FIG. 39 Latin America Unmanned Underwater Vehicles Market Value (US$ Mn), By Propulsion System 2012-2016
FIG. 40 Latin America Unmanned Underwater Vehicles Market Value (US$ Mn), By Propulsion System 2017-2022
FIG. 41 Latin America Unmanned Underwater Vehicles Market Value (US$ Mn), By Application 2012-2016
FIG. 42 Latin America Unmanned Underwater Vehicles Market Value (US$ Mn), By Application 2017-2022
FIG. 43 Europe Unmanned Underwater Vehicles Market Value (US$ Mn), By Product 2012-2016
FIG. 44 Europe Unmanned Underwater Vehicles Market Value (US$ Mn), By Product 2017-2022
FIG. 45 Europe Unmanned Underwater Vehicles Market Value (US$ Mn), By Propulsion System 2012-2016
FIG. 46 Europe Unmanned Underwater Vehicles Market Value (US$ Mn), By Propulsion System 2017-2022
FIG. 47 Europe Unmanned Underwater Vehicles Market Value (US$ Mn), By Application 2012-2016
FIG. 48 Europe Unmanned Underwater Vehicles Market Value (US$ Mn), By Application 2017-2022
FIG. 49 Japan Unmanned Underwater Vehicles Market Value (US$ Mn), By Product 2012-2016
FIG. 50 Japan Unmanned Underwater Vehicles Market Value (US$ Mn), By Product 2017-2022
FIG. 51 Japan Unmanned Underwater Vehicles Market Value (US$ Mn), By Propulsion System 2012-2016
FIG. 52 Japan Unmanned Underwater Vehicles Market Value (US$ Mn), By Propulsion System 2017-2022
FIG. 53 Japan Unmanned Underwater Vehicles Market Value (US$ Mn), By Application 2012-2016
FIG. 54 Japan Unmanned Underwater Vehicles Market Value (US$ Mn), By Application 2017-2022
FIG. 55 APEJ Unmanned Underwater Vehicles Market Value (US$ Mn), By Product 2012-2016
FIG. 56 APEJ Unmanned Underwater Vehicles Market Value (US$ Mn), By Product 2017-2022
FIG. 57 APEJ Unmanned Underwater Vehicles Market Value (US$ Mn), By Propulsion System 2012-2016
FIG. 58 APEJ Unmanned Underwater Vehicles Market Value (US$ Mn), By Propulsion System 2017-2022
FIG. 59 APEJ Unmanned Underwater Vehicles Market Value (US$ Mn), By Application 2012-2016
FIG. 60 APEJ Unmanned Underwater Vehicles Market Value (US$ Mn), By Application 2017-2022
FIG. 61 MEA Unmanned Underwater Vehicles Market Value (US$ Mn), By Product 2012-2016
FIG. 62 MEA Unmanned Underwater Vehicles Market Value (US$ Mn), By Product 2017-2022
FIG. 63 MEA Unmanned Underwater Vehicles Market Value (US$ Mn), By Propulsion System 2012-2016
FIG. 64 MEA Unmanned Underwater Vehicles Market Value (US$ Mn), By Propulsion System 2017-2022
FIG. 65 MEA Unmanned Underwater Vehicles Market Value (US$ Mn), By Application 2012-2016
FIG. 66 MEA Unmanned Underwater Vehicles Market Value (US$ Mn), By Application 2017-2022
Copyright © Transparency Market Research, Inc. All Rights reserved
Trust Online

Unmanned Underwater Vehicles Market