
Reports
Reports
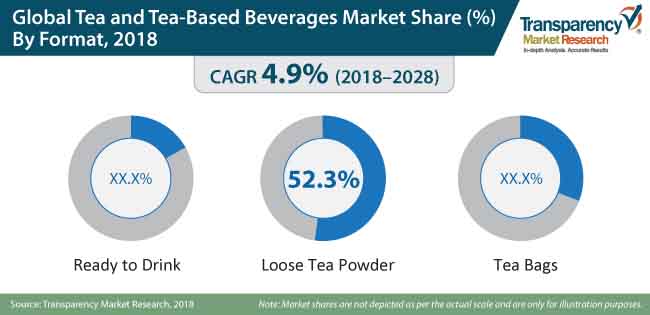
Tea and Tea-Based Beverages Market: Introduction
Tea and tea-based beverages are defined as aromatic beverages that are prepared by infusing the leaves of Camellia sinensis, or tea leaves, which is a native herb of Eastern Asia. Based on the method of preparation and processing procedure of Camellia sinensis leaves, various types of tea and tea-based beverages are formulated such as green tea, oolong tea, black tea, and others. Tea and tea-based beverages are available in various formats such as loose tea powder, tea bags, and ready-to-drink (RTD) tea, in a variety of flavors that are customized in accordance with consumer demand.
Tea and Tea-Based Beverages Market - Key Drivers
Growing Preference Towards Tea Infused with Aroma, Flavor, and Herbal Ingredients Resulting in the Increasing Consumption of Tea and Tea-Based Beverages
The allure of drinking tea and tea-based beverages has been witnessing growing popularity for many years now. In recent years, restaurants, hotels, and cafes, coupled with homegrown tea companies, have been offering a variety of tea and tea-based beverages other than regular English breakfast tea and earl grey tea that is served with bread. Consumers are paying greater attention to the actual origin of tea and tea-based beverages and their associated health benefits, and this factor is driving the market demand for various blends and types of tea and tea-based beverages.
Among the different varieties of tea and tea-based beverages, consumers are increasingly preferring green tea, as it is believed to offer several health benefits such as preventing type-2 diabetes, cardiovascular diseases, and cancer. Green tea is also consumed to reduce the intensity of obesity and high cholesterol. Tea and tea-based beverages are blended with other herbal ingredients to offer special health benefits and tempting aromas. Some of the most popular types of organic teas include black tea, green tea, and oolong tea. The consumption of black tea helps burn existing fat cells, and prevents the formation of new fat cells as well. Thus, the consumption of black tea is a good option to fight obesity. Due to increasing health consciousness, consumers show inclined interest towards various flavors and blends of tea and tea-based beverages.
Significant Growth of Online Retailing Resulting in the Increased Prominence of Tea and Tea-Based Beverages
Increasing product penetration of tea and tea-based beverages through web-based retailing channels is one of the central points that is expected to drive the development of tea and tea-based beverages all over the world during the forecast period. The expansion of the tea and tea-based beverages market through online business is additionally foreseen to observe huge increment over the forecast period. This is attributed to the increased use of smartphones and the Internet in different undiscovered markets across the globe. Moreover, Internet retailing is connected to the simple accessibility of a wide variety of tea and tea-based beverages in different formats, such as ready-to-drink (RTD) tea, loose tea powder, and tea bags, which is anticipated to drive the growth of the global tea and tea-based beverages market.
Increasing Consumption of Tea and Tea-based Beverages in Developing Economies
Tea and tea-based beverages are considered as close substitutes, and drinking tea is quite popular among consumers of all ages. Drinking tea and tea-based beverages does not have any negative impact on our health, and this is the most popular beverage after water in the world. The U.S., Turkey, and Ireland are some of the important countries in terms of per capita tea consumption. The consumption of tea and tea-based beverages such as black tea is very popular in the U.S., and tea consumption is expected to increase by 3% every year. India and China are a major part of the demand for tea, owing to their large population base. These factors have been driving the demand tea in recent years.
Green tea imports have dramatically increased in the U.S. This region has witnessed a robust increase in the imports of green tea from 3 percent in 1995 to 17 percent in 2010. The demand for specialty tea and tea-based beverages such as matcha and bubble tea has also witnessed considerable growth in recent years. Owing to the increasing consumption and escalating demand from consumers all over the world, it is anticipated that, the global tea and tea-based beverages market would witness robust growth during the forecast period.
The Popularity of Ready to Drink (RTD) as a Convenient Option in Retail Outlets
Tea and tea-based beverages are considered as the most convenient hot beverages, and can be consumed any time during the day. Ready-to-drink (RTD) tea has been the most popular format of flavored tea and tea-based beverages in recent years, owing to its easy availability and accessibility in all food retail formats. Ready-to-drink (RTD) tea is especially popular among consumers within the age group of 18–34 years. The increasing demand for on-the-go health drinks has been boosting the market prospects of the global tea and tea-based beverages market in recent years.
Some of the popular retail stores such as Starbucks and Dunkin Donuts incorporate customization in their products, thus boosting the demand for tea among consumers. Moreover, the booming growth of the e-Commerce industry is improving the distributional channels of the tea and tea-based beverages market all over the world.
1. Global Tea and Tea-Based Beverages Market - Executive Summary
1.1. Global Tea and Tea-Based Beverages Market Country Analysis
1.2. Vertical Specific Market Penetration
1.3. Application – Product Mapping
1.4. Competition Blueprint
1.5. Technology Time Line Mapping
1.6. TMR Analysis and Recommendations
2. Market Overview
2.1. Market Introduction
2.2. Market Definition
2.3. Market Taxonomy
3. Market Dynamics
3.1. Macro-economic Factors
3.1.1. Rise in Consumption of Tea across Globe
3.1.2. Global and Regional Per Capita Hot Beverage Consumption (kcal per capita per day)
3.1.3. Population of Key Countries
3.1.4. Organic Agriculture Worldwide Statistics, 2017 (Million Hectares)
3.1.4.1. Top 10 Countries with Largest Areas of Tea cultivation Land, 2016, Million Hectares
3.1.5. Food and Beverage Industry Overview
3.1.6. Global Modern Trade Penetration and Grocery Market by Key Countries
3.1.7. Change in Consumer Price Indexes (Percentage Change) 2018 (Forecast)
3.1.8. Global Retail Dynamics
3.2. Drivers
3.2.1. Economic Drivers
3.2.2. Supply Side Drivers
3.2.3. Demand Side Drivers
3.3. Market Restraints
3.3.1. Regulatory concerns
3.3.2. Supply chain issues
3.3.3. Others
3.4. Market Trends
3.5. Green Tea and Tea-Based Beverages Market- Overview
3.5.1. Demand Analysis
3.5.2. Key dynamics
3.5.2.1. Drivers
3.5.2.2. Restraints
3.5.2.3. Opportunities
3.5.2.4. Threats
3.5.3. Value Chain Analysis
3.5.4. Consumer preferences: Historical Scenario and Futuristic Approach
3.6. Trend Analysis- Impact on Time Line (2018-2024)
3.7. Forecast Factors – Relevance and Impact
3.8. Key Regulations By Regions
3.9. Technology Roadmap
4. Sentiment Analysis
4.1. Consumer Sentiment Analysis
4.1.1. Consumer Buying Pattern
4.1.2. Development of the Specification
4.1.3. Social & Economic Influencers – Factors
4.1.4. Consumer preferences: Historical Scenario and Futuristic Approach
4.1.5. Prime Tendencies
4.1.6. Factors Affecting Consumer Preferences
4.1.7. Impact of labelling, claims, and certifications
4.1.8. Others
4.2. Social Media Sentiment Analysis
4.2.1. Consumer perception for products on social media platforms- Positive and Negative Mentions
4.2.2. Trending Brands
4.2.3. Social Media Platform Mentions (% of total mentions)
4.2.4. Trending Subject Titles
4.2.5. Others
5. Associated Industry and Key Indicator Assessment
5.1. Parent Industry Overview
5.1.1. Market Size and Forecast
5.1.2. Market Size and Y-o-Y Growth
5.1.3. Absolute $ Opportunity
6. Supply Chain Analysis
6.1. Profitability and Gross Margin Analysis By Competition
6.2. List of Active Participants- By Region
6.2.1. Raw Material Suppliers
6.2.2. Key Manufacturers
6.2.3. Integrators
6.2.4. Key Distributor/Retailers
7. Global Tea and Tea-Based Beverages Market Pricing Analysis
7.1. Price Point Assessment by Type
7.2. Regional Average Pricing Analysis
7.2.1. North America
7.2.2. Latin America
7.2.3. Europe Research, All Rights Reserved 7
7.2.4. Asia Pacific
7.2.5. Middle East and Africa
7.3. Price Forecast till 2025
7.4. Factors Influencing Pricing
8. Global Tea and Tea-Based Beverages Market- Trade Analysis
8.1. Tea and Tea-Based Beverages Market- Exports to the World
8.1.1. List of Key Exporters
8.1.2. Key Exporting Countries/Regions- Market Share Analysis (2018E)
8.1.3. Value (US$ Mn) of Export
8.1.4. Volume (Units) of Export
8.2. Tea and Tea-Based Beverages Market- Imports to the World
8.2.1. List of Key Importers
8.2.2. Key importing Countries/Regions- Market Share Analysis (2018E)
8.2.3. Value (US$ Mn) of Import
8.2.4. Volume (Units) of Import
8.3. Global Tea and Tea-Based Beverages Market- Supply Demand Scenario (GlobalProduction, Sales, Import, Export)
9. Global Tea and Tea-Based Beverages Market Analysis and Forecast
9.1. Market Size Analysis (2013-2017) and Forecast (2018-2024)
9.1.1. Market Value (US$ Mn) and Volume (Tons) and Y-o-Y Growth
9.1.2. Absolute $ Opportunity
9.2. Global Tea and Tea-Based Beverages Market Scenario Forecast (Optimistic, Likely and Conservative Market Conditions)
9.2.1. Forecast Factors and Relevance of Impact
9.2.2. Regional Tea and Tea-Based Beverages Market Business Performance Summary
10. Global Tea and Tea-Based Beverages Market Analysis By Type
10.1. Introduction
10.1.1. Y-o-Y Growth Comparison By Type
10.1.2. Basis Point Share (BPS) Analysis By Type
10.2. Tea and Tea-Based Beverages Market Size (US$ Mn) and Volume (MT) Analysis (2013-2017) & Forecast (2018-2024) By Type
10.2.1. Green Tea and Tea-Based Beverages
10.2.2. Black Tea and Tea-Based Beverages
10.2.3. Oolong Tea and Tea-Based Beverages
10.2.4. Fruit/Herbal Tea and Tea-Based Beverages
10.2.5. Tea and Tea-Based Beverages Blends
10.2.6. Others (Bubble, Detox and Match Tea and Tea-Based Beverages)
10.3. Market Attractiveness Analysis By Type
11. Global Tea and Tea-Based Beverages Market Analysis By Packaging
11.1. Introduction
11.1.1. Y-o-Y Growth Comparison By Packaging
11.1.2. Basis Point Share (BPS) Analysis By Packaging
11.2. Tea and Tea-Based Beverages Market Size (US$ Mn) and Volume (MT) Analysis (2013-2017) & Forecast (2018-2024) By Packaging
11.2.1. Plastic Containers
11.2.2. Cartons
11.2.3. Aluminum Tin
11.2.4. Tea and Tea-Based Beverages Bags
11.3. Market Attractiveness Analysis By Packaging
12. Global Tea and Tea-Based Beverages Market Analysis By Sales Channel
12.1. Introduction
12.1.1. Y-o-Y Growth Comparison By Sales Channel
12.1.2. Basis Point Share (BPS) Analysis By Sales Channel
12.2. Tea and Tea-Based Beverages Market Size (US$ Mn) and Volume (MT) Analysis (2013-2017) & Forecast (2018-2024) By Sales Channel
12.2.1. Store Based Retailing
12.2.1.1. Modern Grocery Retailers
12.2.1.1.1.1. Convenience Stores
12.2.1.1.1.2. Forecourt Retailers
12.2.1.1.1.3. Hypermarkets/ Supermarkets
12.2.1.2. Traditional Grocery Retailers
12.2.1.2.1. Food Specialist
12.2.1.2.2. Independent Small Grocers
12.2.1.2.3. Other Grocery Retailers
12.2.1.3. Non-grocery Retailers
12.2.1.3.1. Mixed Retailers
12.2.1.3.2. Other Non-grocery Retailers
12.2.2. Online Retailing
12.2.3. Cafes
12.3. Market Attractiveness Analysis By Sales Channel
13. Global Tea and Tea-Based Beverages Market Analysis By Nature
13.1. Introduction
13.1.1. Y-o-Y Growth Comparison By Nature
13.1.2. Basis Point Share (BPS) Analysis By Nature
13.2. Tea and Tea-Based Beverages Market Size (US$ Mn) and Volume (MT) Analysis (2013-2017) & Forecast (2018-2024) By Nature
13.2.1. Organic
13.2.2. Conventional
13.3. Market Attractiveness Analysis By Nature
14. Global Tea and Tea-Based Beverages Market Analysis By Format
14.1. Introduction
14.1.1. Y-o-Y Growth Comparison By Format
14.1.2. Basis Point Share (BPS) Analysis By Format
14.2. Tea and Tea-Based Beverages Market Size (US$ Mn) and Volume (MT) Analysis (2013-2017) & Forecast (2018-2024) By Format
14.2.1. Ready to Drink
14.2.2. Loose Tea and Tea-Based Beverages Powderarket Research, All Rights Reserved 9
14.2.3. Tea and Tea-Based Beverages Bags
14.3. Market Attractiveness Analysis By Format
15. Global Tea and Tea-Based Beverages Market Analysis and Forecast, By Region
15.1. Introduction
15.1.1. Basis Point Share (BPS) Analysis By Region
15.1.2. Y-o-Y Growth Projections By Region
15.2. Tea and Tea-Based Beverages Market Size (US$ Mn) and Volume (MT) & Forecast (2018-2024) Analysis By Region
15.2.1. North America
15.2.2. Europe
15.2.3. APAC
15.2.4. Latin America
15.2.5. Middle East and Africa
15.3. Market Attractiveness Analysis By Region
16. North America Tea and Tea-Based Beverages Market Analysis and Forecast
16.1. Introduction
16.1.1. Basis Point Share (BPS) Analysis By Country
16.1.2. Y-o-Y Growth Projections By Country
16.2. Tea and Tea-Based Beverages Market Size (Value (US$) and Volume (MT) Analysis (2013-2018) and Forecast (2018-2024)
16.2.1. Market Attractiveness By Country
16.2.1.1. U.S.
16.2.1.2. Canada
16.2.2. By Type
16.2.3. By Packaging
16.2.4. By Sales Channel
16.2.5. By Nature
16.2.6. By Format
16.3. Market Attractiveness Analysis
16.3.1. By Country
16.3.2. By Type
16.3.3. By Packaging
16.3.4. By Sales Channel
16.3.5. By Nature
16.3.6. By Format
16.4. Drivers and Restraints: Impact Analysis
17. Latin America Tea and Tea-Based Beverages Market Analysis and Forecast
17.1. Introduction
17.1.1. Basis Point Share (BPS) Analysis By Country
17.1.2. Y-o-Y Growth Projections By Country
17.1.3. Key Regulations
17.2. Tea and Tea-Based Beverages Market Size (Value (US$) and Volume (MT) Analysis (2013-2018) and Forecast (2018-2024)
17.2.1. By Country
17.2.1.1. Brazil
17.2.1.2. Mexico
17.2.1.3. Chile
17.2.1.4. Peru
17.2.1.5. Argentina
17.2.1.6. Rest of Latin America
17.2.2. By Type
17.2.3. By Packaging
17.2.4. By Sales Channel
17.2.5. By Nature
17.2.6. By Format
17.3. Market Attractiveness Analysis
17.3.1. By Country
17.3.2. By Type
17.3.3. By Packaging
17.3.4. By Sales Channel
17.3.5. By Nature
17.3.6. By Format
17.4. Drivers and Restraints: Impact Analysis
18. Europe Tea and Tea-Based Beverages Market Analysis and Forecast
18.1. Introduction
18.1.1. Basis Point Share (BPS) Analysis By Country
18.1.2. Y-o-Y Growth Projections By Country
18.1.3. Key Regulations
18.2. Tea and Tea-Based Beverages Market Size (Value (US$) and Volume (MT) Analysis(2013-2018) and Forecast (2018-2024)
18.2.1. By Country
18.2.1.1. EU-4 (Germany, France, Italy, Spain)
18.2.1.2. U.K.
18.2.1.3. BENELUX
18.2.1.4. Nordic
18.2.1.5. Russia
18.2.1.6. Rest of Europe
18.2.2. By Type
18.2.3. By Packaging
18.2.4. By Sales Channel
18.2.5. By Nature
18.2.6. By Format
18.3. Market Attractiveness Analysis
18.3.1. By Country
18.3.2. By Type
18.3.3. By Packaging
18.3.4. By Sales Channel
18.3.5. By Nature
18.3.6. By Format
18.4. Drivers and Restraints: Impact Analysis
19. APAC Tea and Tea-Based Beverages Market Analysis and Forecast
19.1. Introduction
19.1.1. Basis Point Share (BPS) Analysis By Country
19.1.2. Y-o-Y Growth Projections By Country
19.1.3. Key Regulations
19.2. Tea and Tea-Based Beverages Market Size (Value (US$) and Volume (MT) Analysis(2013-2018) and Forecast (2018-2024)
19.2.1. By Country
19.2.1.1. China
19.2.1.2. India
19.2.1.3. Japan
19.2.1.4. Australia & New Zealand
19.2.1.5. ASEAN Countries
19.2.1.6. Rest of APAC
19.2.2. By Type
19.2.3. By Packaging
19.2.4. By Sales Channel
19.2.5. By Nature
19.2.6. By Format
19.3. Market Attractiveness Analysis
19.3.1. By Country
19.3.2. By Type
19.3.3. By Packaging
19.3.4. By Sales Channel
19.3.5. By Nature
19.3.6. By Format
19.4. Drivers and Restraints: Impact Analysis
20. Middle East and Africa (MEA) Tea and Tea-Based Beverages Market Analysis and Forecast
20.1. Introduction
20.1.1. Basis Point Share (BPS) Analysis By Country
20.1.2. Y-o-Y Growth Projections By Country
20.1.3. Key Regulations
20.2. Tea and Tea-Based Beverages Market Size (Value (US$) and Volume (MT) Analysis (2013-2018) and Forecast (2018-2024)
20.2.1. By Country
20.2.1.1. GCC Countries
20.2.1.2. Turkey
20.2.1.3. South Africa
20.2.1.4. Iran
20.2.1.5. Egypt
20.2.1.6. Rest of MEA
20.2.2. By Type
20.2.3. By Packaging
20.2.4. By Sales Channel
20.2.5. By Nature
20.2.6. By Format
20.3. Market Attractiveness Analysis
20.3.1. By Country
20.3.2. By Type
20.3.3. By Packaging
20.3.4. By Sales Channel
20.3.5. By Nature
20.3.6. By Format
20.4. Drivers and Restraints: Impact Analysis
21. Competition Assessment
21.1. Global Tea and Tea-Based Beverages Market Competition - a Dashboard View
21.2. Global Tea and Tea-Based Beverages Market Structure Analysis
21.3. Global Tea and Tea-Based Beverages Market Company Share Analysis
21.3.1. For Tier 1 Market Players, 2017
21.3.2. Company Market Share Analysis of Top 10 Players, By Region
21.4. Key Participants Market Presence (Intensity Mapping) by Region
22. Brand Assessment
22.1. Brand Identity (Brand as Product, Brand as Organization,Brand as Person, Brand as Symbol)
22.2. Tea and Tea-Based Beverages Audience and Positioning (Demographic Segmentation,Geographic Segmentation, Psychographic Segmentation,Situational Segmentation)
22.3. Brand Strategy
23. Competition Deep-dive (Manufacturers/Suppliers)
23.1. Tata Global Beverages
23.1.1. Overview
23.1.2. Product Portfolio
23.1.3. Sales Footprint
23.1.4. Channel Footprint
23.1.4.1. Distributors List
23.1.4.2. Sales Channel (Clients)
23.1.5. Strategy Overview
23.1.5.1. Marketing Strategy
23.1.5.2. Culture Strategy
23.1.5.3. Channel Strategy
23.1.6. SWOT Analysis
23.1.7. Financial Analysis
23.1.8. Revenue Share
23.1.8.1. By Type
23.1.8.2. By Region
23.1.9. Key Clients
23.1.10. Analyst Comments
23.2. Starbucks Corporation.
23.2.1. Overview
23.2.2. Product Portfolio
23.2.3. Sales Footprint
23.2.4. Channel Footprint
23.2.4.1. Distributors List
23.2.4.2. Sales Channel (Clients)
23.2.5. Strategy Overview
23.2.5.1. Marketing Strategy
23.2.5.2. Culture Strategy
23.2.5.3. Channel Strategy
23.2.6. SWOT Analysis
23.2.7. Financial Analysis
23.2.8. Revenue Share
23.2.8.1. By Type
23.2.8.2. By Region
23.2.9. Key Clients
23.2.10. Analyst Comments
23.3. The Hain Celestial Group Inc.
23.3.1. Overview
23.3.2. Product Portfolio
23.3.3. Sales Footprint
23.3.4. Channel Footprint
23.3.4.1. Distributors List
23.3.4.2. Sales Channel (Clients)
23.3.5. Strategy Overview
23.3.5.1. Marketing Strategy
23.3.5.2. Culture Strategy
23.3.5.3. Channel Strategy
23.3.6. SWOT Analysis
23.3.7. Financial Analysis
23.3.8. Revenue Share
23.3.8.1. By Type
23.3.8.2. By Region
23.3.9. Key Clients
23.3.10. Analyst Comments
23.4. Associated British Foods LLC
23.4.1. Overview
23.4.2. Product Portfolio
23.4.3. Sales Footprint
23.4.4. Channel Footprint
23.4.4.1. Distributors List
23.4.4.2. Sales Channel (Clients)
23.4.5. Strategy Overview
23.4.5.1. Marketing Strategy
23.4.5.2. Culture Strategy
23.4.5.3. Channel Strategy
23.4.6. SWOT Analysis
23.4.7. Financial Analysis
23.4.8. Revenue Share
23.4.8.1. By Type
23.4.8.2. By Region
23.4.9. Key Clients
23.4.10. Analyst Comments
23.5. Unilever Group
23.5.1. Overview
23.5.2. Product Portfolio
23.5.3. Sales Footprint
23.5.4. Channel Footprint
23.5.4.1. Distributors List
23.5.4.2. Sales Channel (Clients)
23.5.5. Strategy Overview
23.5.5.1. Marketing Strategy
23.5.5.2. Culture Strategy
23.5.5.3. Channel Strategy
23.5.6. SWOT Analysis
23.5.7. Financial Analysis
23.5.8. Revenue Share
23.5.8.1. By Type
23.5.8.2. By Region
23.5.9. Key Clients
23.5.10. Analyst Comments
23.6. AMORE Pacific Corp.
23.6.1. Overview
23.6.2. Product Portfolio
23.6.3. Sales Footprint
23.6.4. Channel Footprint
23.6.4.1. Distributors List
23.6.4.2. Sales Channel (Clients)
23.6.5. Strategy Overview
23.6.5.1. Marketing Strategy
23.6.5.2. Culture Strategy
23.6.5.3. Channel Strategy
23.6.6. SWOT Analysis
23.6.7. Financial Analysis
23.6.8. Revenue Share
23.6.8.1. By Type
23.6.8.2. By Region
23.6.9. Key Clients
23.6.10. Analyst Comments
23.7. Numi Organic Tea and Tea-Based Beverages
23.7.1. Overview
23.7.2. Product Portfolio
23.7.3. Sales Footprint
23.7.4. Channel Footprint
23.7.4.1. Distributors List
23.7.4.2. Sales Channel (Clients)
23.7.5. Strategy Overview
23.7.5.1. Marketing Strategy
23.7.5.2. Culture Strategy
23.7.5.3. Channel Strategy
23.7.6. SWOT Analysis
23.7.7. Financial Analysis
23.7.8. Revenue Share
23.7.8.1. By Type
23.7.8.2. By Region
23.7.9. Key Clients
23.7.10. Analyst Comments
23.8. Alkaloid AD Skopje
23.8.1. Overview
23.8.2. Product Portfolio
23.8.3. Sales Footprint
23.8.4. Channel Footprint
23.8.4.1. Distributors List
23.8.4.2. Sales Channel (Clients)
23.8.5. Strategy Overview
23.8.5.1. Marketing Strategy
23.8.5.2. Culture Strategy
23.8.5.3. Channel Strategy
23.8.6. SWOT Analysis
23.8.7. Financial Analysis
23.8.8. Revenue Share
23.8.8.1. By Type
23.8.8.2. By Region
23.8.9. Key Clients
23.8.10. Analyst Comments
23.9. R.Twining and Company Limited
23.9.1. Overview
23.9.2. Product Portfolio
23.9.3. Sales Footprint
23.9.4. Channel Footprint
23.9.4.1. Distributors List
23.9.4.2. Sales Channel (Clients)
23.9.5. Strategy Overview
23.9.5.1. Marketing Strategy
23.9.5.2. Culture Strategy
23.9.5.3. Channel Strategy
23.9.6. SWOT Analysis
23.9.7. Financial Analysis
23.9.8. Revenue Share
23.9.8.1. By Type
23.9.8.2. By Region
23.9.9. Key Clients
23.9.10. Analyst Comments
23.10. Organic India
23.10.1. Overview
23.10.2. Product Portfolio
23.10.3. Sales Footprint
23.10.4. Channel Footprint
23.10.4.1. Distributors List
23.10.4.2. Sales Channel (Clients)
23.10.5. Strategy Overview
23.10.5.1. Marketing Strategy
23.10.5.2. Culture Strategy
23.10.5.3. Channel Strategy
23.10.6. SWOT Analysis
23.10.7. Financial Analysis
23.10.8. Revenue Share
23.10.8.1. By Type
23.10.8.2. By Region
23.10.9. Key Clients
23.10.10. Analyst Comments
23.11. Ceylon Organics Limited
23.11.1. Overview
23.11.2. Product Portfolio
23.11.3. Sales Footprint
23.11.4. Channel Footprint
23.11.4.1. Distributors List
23.11.4.2. Sales Channel (Clients)
23.11.5. Strategy Overview
23.11.5.1. Marketing Strategy
23.11.5.2. Culture Strategy
23.11.5.3. Channel Strategy
23.11.6. SWOT Analysis
23.11.7. Financial Analysis
23.11.8. Revenue Share
23.11.8.1. By Type
23.11.8.2. By Region
23.11.9. Key Clients
23.11.10. Analyst Comments
23.12. The Stash Tea and Tea-Based Beverages Company
23.12.1. Overview
23.12.2. Product Portfolio
23.12.3. Sales Footprint
23.12.4. Channel Footprint
23.12.4.1. Distributors List
23.12.4.2. Sales Channel (Clients)
23.12.5. Strategy Overview
23.12.5.1. Marketing Strategy
23.12.5.2. Culture Strategy
23.12.5.3. Channel Strategy
23.12.6. SWOT Analysis
23.12.7. Financial Analysis
23.12.8. Revenue Share
23.12.8.1. By Type
23.12.8.2. By Region
23.12.9. Key Clients
23.12.10. Analyst Comments
23.13. Arbor Tea and Tea-Based Beveragess
23.13.1. Overview
23.13.2. Product Portfolio
23.13.3. Sales Footprint
23.13.4. Channel Footprint
23.13.4.1. Distributors List
23.13.4.2. Sales Channel (Clients)
23.13.5. Strategy Overview
23.13.5.1. Marketing Strategy
23.13.5.2. Culture Strategy
23.13.5.3. Channel Strategy
23.13.6. SWOT Analysis
23.13.7. Financial Analysis
23.13.8. Revenue Share
23.13.8.1. By Type
23.13.8.2. By Region
23.13.9. Key Clients
23.13.10. Analyst Comments
23.14. Republic of Tea and Tea-Based Beverages
23.14.1. Overview
23.14.2. Product Portfolio
23.14.3. Sales Footprint
23.14.4. Channel Footprint
23.14.4.1. Distributors List
23.14.4.2. Sales Channel (Clients)
23.14.5. Strategy Overview
23.14.5.1. Marketing Strategy
23.14.5.2. Culture Strategy
23.14.5.3. Channel Strategy
23.14.6. SWOT Analysis
23.14.7. Financial Analysis
23.14.8. Revenue Share
23.14.8.1. By Type
23.14.8.2. By Region
23.14.9. Key Clients
23.14.10. Analyst Comments
23.15. Townshend's Tea and Tea-Based Beverages Company
23.15.1. Overview
23.15.2. Product Portfolio
23.15.3. Sales Footprint
23.15.4. Channel Footprint
23.15.4.1. Distributors List
23.15.4.2. Sales Channel (Clients)
23.15.5. Strategy Overview
23.15.5.1. Marketing Strategy
23.15.5.2. Culture Strategy
23.15.5.3. Channel Strategy
23.15.6. SWOT Analysis
23.15.7. Financial Analysis
23.15.8. Revenue Share
23.15.8.1. By Type
23.15.8.2. By Region
23.15.9. Key Clients
23.15.10. Analyst Comments
23.16. 23.19. Others (On additional request)arResearch, All Rights Reserved 14
24. Recommendation- Critical Success Factors
25. Research Methodology
26. Assumptions & Acronyms Used
List of Tables
Table 01: Global Tea and Tea-Based Beverages Market Value (US$ Mn) Forecast by Type, 2018–2028
Table 02: Global Tea and Tea-Based Beverages Market Volume (MT) Forecast by Type, 2018–2028
Table 03: Global Tea and Tea-Based Beverages Market Value (US$ Mn) Forecast by Packaging, 2018–2028
Table 04: Global Tea and Tea-Based Beverages Market Volume (MT) Forecast by Packaging, 2018–2028
Table 05: Global Tea and Tea-Based Beverages Market Value (US$ Mn) Forecast by Sales Channel, 2018–2028
Table 06: Global Tea and Tea-Based Beverages Market Volume (MT) Forecast by Sales Channel, 2018–2028
Table 07: Global Tea and Tea-Based Beverages Market Value (US$ Mn) Forecast by Nature, 2018–2028
Table 08: Global Tea and Tea-Based Beverages Market Volume (MT) Forecast by Nature, 2018–2028
Table 09: Global Tea and Tea-Based Beverages Market Value (US$ Mn) Forecast by Format, 2018–2028
Table 10: Global Tea and Tea-Based Beverages Market Volume (MT) Forecast by Format, 2018–2028
Table 11: Global Tea and Tea-Based Beverages Market Value (US$ Mn) Forecast by End Use, 2018–2028
Table 12: Global Tea and Tea-Based Beverages Market Volume (MT) Forecast by End Use, 2018–2028
Table 13: North America Tea and Tea-Based Beverages Market Value (US$ Mn) Forecast by Country, 2018–2028
Table 14: North America Tea and Tea-Based Beverages Market Volume (MT) Forecast by Country, 2018–2028
Table 15: North America Tea and Tea-Based Beverages Market Value (US$ Mn) Forecast by Type, 2018–2028
Table 16: North America Tea and Tea-Based Beverages Market Volume (MT) Forecast by Type, 2018–2028
Table 17: North America Tea and Tea-Based Beverages Market Value (US$ Mn) Forecast by Packaging, 2018–2028
Table 18: North America Tea and Tea-Based Beverages Market Volume (MT) Forecast by Packaging, 2018–2028
Table 19: North America Tea and Tea-Based Beverages Market Value (US$ Mn) Forecast by Sales Channel, 2018–2028
Table 20: North America Tea and Tea-Based Beverages Market Volume (MT) Forecast by Sales Channel, 2018–2028
Table 21: North America Tea and Tea-Based Beverages Market Value (US$ Mn) Forecast by Nature, 2018–2028
Table 22: North America Tea and Tea-Based Beverages Market Volume (MT) Forecast by Nature, 2018–2028
Table 23: North America Tea and Tea-Based Beverages Market Value (US$ Mn) Forecast by Format, 2018–2028
Table 24: North America Tea and Tea-Based Beverages Market Volume (MT) Forecast by Format, 2018–2028
Table 25: Latin America Tea and Tea-Based Beverages Market Value (US$ Mn) Forecast by Country, 2018–2028
Table 26: Latin America Tea and Tea-Based Beverages Market Volume (MT) Forecast by Country, 2018–2028
Table 27: Latin America Tea and Tea-Based Beverages Market Value (US$ Mn) Forecast by Type, 2018–2028
Table 28: Latin America Tea and Tea-Based Beverages Market Volume (MT) Forecast by Type, 2018–2028
Table 29: Latin America Tea and Tea-Based Beverages Market Value (US$ Mn) Forecast by Packaging, 2018–2028
Table 30: Latin America Tea and Tea-Based Beverages Market Volume (MT) Forecast by Packaging, 2018–2028
Table 31: Latin America Tea and Tea-Based Beverages Market Value (US$ Mn) Forecast by Sales Channel, 2018–2028
Table 32: Latin America Tea and Tea-Based Beverages Market Volume (MT) Forecast by Sales Channel, 2018–2028
Table 33: Latin America Tea and Tea-Based Beverages Market Value (US$ Mn) Forecast by Nature, 2018–2028
Table 34: Latin America Tea and Tea-Based Beverages Market Volume (MT) Forecast by Nature, 2018–2028
Table 35: Latin America Tea and Tea-Based Beverages Market Value (US$ Mn) Forecast by Format, 2018–2028
Table 36: Latin America Tea and Tea-Based Beverages Market Volume (MT) Forecast by Format, 2018–2028
Table 37: Europe Tea and Tea-Based Beverages Market Value (US$ Mn) Forecast by Country, 2018–2028
Table 38: Europe Tea and Tea-Based Beverages Market Volume (MT) Forecast by Country, 2018–2028
Table 39: Europe Tea and Tea-Based Beverages Market Value (US$ Mn) Forecast by Type, 2018–2028
Table 40: Europe Tea and Tea-Based Beverages Market Volume (MT) Forecast by Type, 2018–2028
Table 41: Europe Tea and Tea-Based Beverages Market Value (US$ Mn) Forecast by Packaging, 2018–2028
Table 42: Europe Tea and Tea-Based Beverages Market Volume (MT) Forecast by Packaging, 2018–2028
Table 43: Europe Tea and Tea-Based Beverages Market Value (US$ Mn) Forecast by Sales Channel, 2018–2028
Table 44: Europe Tea and Tea-Based Beverages Market Volume (MT) Forecast by Sales Channel, 2018–2028
Table 45: Europe Tea and Tea-Based Beverages Market Value (US$ Mn) Forecast by Nature, 2018–2028
Table 46: Europe Tea and Tea-Based Beverages Market Volume (MT) Forecast by Nature, 2018–2028
Table 47: Europe Tea and Tea-Based Beverages Market Value (US$ Mn) Forecast by Format, 2018–2028
Table 48: Europe Tea and Tea-Based Beverages Market Volume (MT) Forecast by Format, 2018–2028
Table 49: APAC Tea and Tea-Based Beverages Market Value (US$ Mn) Forecast by Country, 2018–2028
Table 50: APAC Tea and Tea-Based Beverages Market Volume (MT) Forecast by Country, 2018–2028
Table 51: APAC Tea and Tea-Based Beverages Market Value (US$ Mn) Forecast by Type, 2018–2028
Table 52: APAC Tea and Tea-Based Beverages Market Volume (MT) Forecast by Type, 2018–2028
Table 53: APAC Tea and Tea-Based Beverages Market Value (US$ Mn) Forecast by Packaging, 2018–2028
Table 54: APAC Tea and Tea-Based Beverages Market Volume (MT) Forecast by Packaging, 2018–2028
Table 55: APAC Tea and Tea-Based Beverages Market Value (US$ Mn) Forecast by Sales Channel, 2018–2028
Table 56: APAC Tea and Tea-Based Beverages Market Volume (MT) Forecast by Sales Channel, 2018–2028
Table 57: APAC Tea and Tea-Based Beverages Market Value (US$ Mn) Forecast by Nature, 2018–2028
Table 58: APAC Tea and Tea-Based Beverages Market Volume (MT) Forecast by Nature, 2018–2028
Table 59: APAC Tea and Tea-Based Beverages Market Value (US$ Mn) Forecast by Format, 2018–2028
Table 60: APAC Tea and Tea-Based Beverages Market Volume (MT) Forecast by Format, 2018–2028
Table 61: MEA Tea and Tea-Based Beverages Market Value (US$ Mn) Forecast by Country, 2018–2028
Table 62: MEA Tea and Tea-Based Beverages Market Volume (MT) Forecast by Country, 2018–2028
Table 63: MEA Tea and Tea-Based Beverages Market Value (US$ Mn) Forecast by Type, 2018–2028
Table 64: MEA Tea and Tea-Based Beverages Market Volume (MT) Forecast by Type, 2018–2028
Table 65: MEA Tea and Tea-Based Beverages Market Value (US$ Mn) Forecast by Packaging, 2018–2028
Table 66: MEA Tea and Tea-Based Beverages Market Volume (MT) Forecast by Packaging, 2018–2028
Table 67: MEA Tea and Tea-Based Beverages Market Value (US$ Mn) Forecast by Sales Channel, 2018–2028
Table 68: MEA Tea and Tea-Based Beverages Market Volume (MT) Forecast by Sales Channel, 2018–2028
Table 69: MEA Tea and Tea-Based Beverages Market Value (US$ Mn) Forecast by Nature, 2018–2028
Table 70: MEA Tea and Tea-Based Beverages Market Volume (MT) Forecast by Nature, 2018–2028
Table 71: MEA Tea and Tea-Based Beverages Market Value (US$ Mn) Forecast by Format, 2018–2028
Table 72: MEA Tea and Tea-Based Beverages Market Volume (MT) Forecast by Format, 2018–2028
List of Figures
Figure 01: Global Tea and Tea-Based Beverages Market Absolute $ Opportunity (US$ Mn), 2017-2028
Figure 02: Global Tea and Tea-Based Beverages Market Value (US$ Mn) and Volume (MT), 2013-2017
Figure 03: Global Tea and Tea-Based Beverages Market Value (US$ Mn) and Volume (MT) Forecast, 2018-2028
Figure 04: Global Tea and Tea-Based Beverages Market Volume (MT) Analysis by Type, 2018 & 2028
Figure 05: Global Tea and Tea-Based Beverages Market Value (US$ Mn) Analysis by Type, 2018 & 2028
Figure 06: Global Tea and Tea-Based Beverages Market Value Share (%) and BPS Analysis by Type, 2018 & 2028
Figure 07: Global Tea and Tea-Based Beverages Market Y-o-Y Growth (%) Projections by Type, 2018-2028
Figure 08: Global Tea and Tea-Based Beverages Market Volume (MT) Analysis by Packaging, 2018-2028
Figure 09: Global Tea and Tea-Based Beverages Market Value (US$ Mn) Analysis by Packaging, 2018-2028
Figure 10: Global Tea and Tea-Based Beverages Market Value Share (%) and BPS Analysis by Packaging, 2018-2028
Figure 11: Global Tea and Tea-Based Beverages Market Y-o-Y Growth (%) Projections by Packaging, 2018-2028
Figure 12: Global Tea and Tea-Based Beverages Market Volume (MT) Analysis by Sales Channel, 2018-2028
Figure 13: Global Tea and Tea-Based Beverages Market Value (US$ Mn) Analysis by Sales Channel, 2018-2028
Figure 14: Global Tea and Tea-Based Beverages Market Value Share (%) and BPS Analysis by Sales Channel, 2018-2028
Figure 15: Global Tea and Tea-Based Beverages Market Y-o-Y Growth (%) Projections by Sales Channel, 2018-2028
Figure 16: Global Tea and Tea-Based Beverages Market Volume (MT) Analysis by Nature, 2018-2028
Figure 17: Global Tea and Tea-Based Beverages Market Value (US$ Mn) Analysis by Nature, 2018-2028
Figure 18: Global Tea and Tea-Based Beverages Market Value Share (%) and BPS Analysis by Nature, 2018-2028
Figure 19: Global Tea and Tea-Based Beverages Market Y-o-Y Growth (%) Projections by Nature, 2018-2028
Figure 20: Global Tea and Tea-Based Beverages Market Volume (MT) Analysis by Format, 2018-2028
Figure 21: Global Tea and Tea-Based Beverages Market Value (US$ Mn) Analysis by Format, 2018-2028
Figure 22: Global Tea and Tea-Based Beverages Market Value Share (%) and BPS Analysis by Format, 2018-2028
Figure 23: Global Tea and Tea-Based Beverages Market Y-o-Y Growth (%) Projections by Format, 2018-2028
Figure 24: Global Tea and Tea-Based Beverages Market Volume (MT) Analysis by Region, 2018 & 2028
Figure 25: Global Tea and Tea-Based Beverages Market Value (US$ Mn) Analysis by Region, 2018 & 2028
Figure 26: Global Tea and Tea-Based Beverages Market Value Share (%) and BPS Analysis by Region, 2018 & 2028
Figure 27: Global Tea and Tea-Based Beverages Market Y-o-Y Growth (%) Projections by Region, 2018-2028
Figure 28: Global Tea and Tea-Based Beverages Market Attractiveness Analysis, by Type, 2018 & 2028
Figure 29: Global Tea and Tea-Based Beverages Market Attractiveness Analysis, by Packaging, 2018 & 2028
Figure 30: Global Tea and Tea-Based Beverages Market Attractiveness Analysis, by Sales Channel, 2018 & 2028
Figure 31: Global Tea and Tea-Based Beverages Market Attractiveness Analysis, by Nature, 2018 & 2028
Figure 32: Global Tea and Tea-Based Beverages Market Attractiveness Analysis, by Format, 2018 & 2028
Figure 33: Global Tea and Tea-Based Beverages Market Attractiveness Analysis, by Region, 2018 & 2028
Figure 34: North America Tea and Tea-Based Beverages Market Value Share (%) and BPS Analysis by Country, 2018-2028
Figure 35: North America Tea and Tea-Based Beverages Market Y-o-Y Growth (%) Projections by Country, 2018-2028
Figure 36: North America Tea and Tea-Based Beverages Market Value Share (%) and BPS Analysis by Type, 2018 & 2028
Figure 37: North America Tea and Tea-Based Beverages Market Y-o-Y Growth (%) Projections by Type, 2018-2028
Figure 38: North America Tea and Tea-Based Beverages Market Value Share (%) and BPS Analysis by Packaging, 2018-2028
Figure 39: North America Tea and Tea-Based Beverages Market Y-o-Y Growth (%) Projections by Packaging, 2018-2028
Figure 40: North America Tea and Tea-Based Beverages Market Value Share (%) and BPS Analysis by Sales Channel, 2018-2028
Figure 41: North America Tea and Tea-Based Beverages Market Y-o-Y Growth (%) Projections by Sales Channel, 2018-2028
Figure 42: North America Tea and Tea-Based Beverages Market Value Share (%) and BPS Analysis by Nature, 2018-2028
Figure 43: North America Tea and Tea-Based Beverages Market Y-o-Y Growth (%) Projections by Nature, 2018-2028
Figure 44: North America Tea and Tea-Based Beverages Market Value Share (%) and BPS Analysis by Format, 2018-2028
Figure 45: North America Tea and Tea-Based Beverages Market Y-o-Y Growth (%) Projections by Format, 2018-2028
Figure 46: North America Tea and Tea-Based Beverages Market Attractiveness Analysis, by Type, 2018 & 2028
Figure 47: North America Tea and Tea-Based Beverages Market Attractiveness Analysis, by Packaging, 2018 & 2028
Figure 48: North America Tea and Tea-Based Beverages Market Attractiveness Analysis, by Sales Channel, 2018 & 2028
Figure 49: North America Tea and Tea-Based Beverages Market Attractiveness Analysis, by Nature, 2018 & 2028
Figure 50: North America Tea and Tea-Based Beverages Market Attractiveness Analysis, by Format, 2018 & 2028
Figure 51: North America Tea and Tea-Based Beverages Market Attractiveness Analysis, by Region, 2018 & 2028
Figure 52: Latin America Tea and Tea-Based Beverages Market Value Share (%) and BPS Analysis by Country, 2018-2028
Figure 53: Latin America Tea and Tea-Based Beverages Market Y-o-Y Growth (%) Projections by Country, 2018-2028
Figure 54: Latin America Tea and Tea-Based Beverages Market Value Share (%) and BPS Analysis by Type, 2018 & 2028
Figure 55: Latin America Tea and Tea-Based Beverages Market Y-o-Y Growth (%) Projections by Type, 2018-2028
Figure 56: Latin America Tea and Tea-Based Beverages Market Value Share (%) and BPS Analysis by Packaging, 2018-2028
Figure 57: Latin America Tea and Tea-Based Beverages Market Y-o-Y Growth (%) Projections by Packaging, 2018-2028
Figure 58: Latin America Tea and Tea-Based Beverages Market Value Share (%) and BPS Analysis by Sales Channel, 2018-2028
Figure 59: Latin America Tea and Tea-Based Beverages Market Y-o-Y Growth (%) Projections by Sales Channel, 2018-2028
Figure 60: Latin America Tea and Tea-Based Beverages Market Value Share (%) and BPS Analysis by Nature, 2018-2028
Figure 61: Latin America Tea and Tea-Based Beverages Market Y-o-Y Growth (%) Projections by Nature, 2018-2028
Figure 62: Latin America Tea and Tea-Based Beverages Market Value Share (%) and BPS Analysis by Format, 2018-2028
Figure 63: Latin America Tea and Tea-Based Beverages Market Y-o-Y Growth (%) Projections by Format, 2018-2028
Figure 64: Latin America Tea and Tea-Based Beverages Market Attractiveness Analysis, by Type, 2018 & 2028
Figure 65: Latin America Tea and Tea-Based Beverages Market Attractiveness Analysis, by Packaging, 2018 & 2028
Figure 66: Latin America Tea and Tea-Based Beverages Market Attractiveness Analysis, by Sales Channel, 2018 & 2028
Figure 67: Latin America Tea and Tea-Based Beverages Market Attractiveness Analysis, by Nature, 2018 & 2028
Figure 68: Latin America Tea and Tea-Based Beverages Market Attractiveness Analysis, by Format, 2018 & 2028
Figure 69: Latin America Tea and Tea-Based Beverages Market Attractiveness Analysis, by Region, 2018 & 2028
Figure 70: Europe Tea and Tea-Based Beverages Market Value Share (%) and BPS Analysis by Country, 2018-2028
Figure 71: Europe Tea and Tea-Based Beverages Market Y-o-Y Growth (%) Projections by Country, 2018-2028
Figure 72: Europe Tea and Tea-Based Beverages Market Value Share (%) and BPS Analysis by Type, 2018 & 2028
Figure 73: Europe Tea and Tea-Based Beverages Market Y-o-Y Growth (%) Projections by Type, 2018-2028
Figure 74: Europe Tea and Tea-Based Beverages Market Value Share (%) and BPS Analysis by Packaging, 2018-2028
Figure 75: Europe Tea and Tea-Based Beverages Market Y-o-Y Growth (%) Projections by Packaging, 2018-2028
Figure 76: Europe Tea and Tea-Based Beverages Market Value Share (%) and BPS Analysis by Sales Channel, 2018-2028
Figure 77: Europe Tea and Tea-Based Beverages Market Y-o-Y Growth (%) Projections by Sales Channel, 2018-2028
Figure 78: Europe Tea and Tea-Based Beverages Market Value Share (%) and BPS Analysis by Nature, 2018-2028
Figure 79: Europe Tea and Tea-Based Beverages Market Y-o-Y Growth (%) Projections by Nature, 2018-2028
Figure 80: Europe Tea and Tea-Based Beverages Market Value Share (%) and BPS Analysis by Format, 2018-2028
Figure 81: Europe Tea and Tea-Based Beverages Market Y-o-Y Growth (%) Projections by Format, 2018-2028
Figure 82: Europe Tea and Tea-Based Beverages Market Attractiveness Analysis, by Type, 2018 & 2028
Figure 83: Europe Tea and Tea-Based Beverages Market Attractiveness Analysis, by Packaging, 2018 & 2028
Figure 84: Europe Tea and Tea-Based Beverages Market Attractiveness Analysis, by Sales Channel, 2018 & 2028
Figure 85: Europe Tea and Tea-Based Beverages Market Attractiveness Analysis, by Nature, 2018 & 2028
Figure 86: Europe Tea and Tea-Based Beverages Market Attractiveness Analysis, by Format, 2018 & 2028
Figure 87: Europe Tea and Tea-Based Beverages Market Attractiveness Analysis, by Region, 2018 & 2028
Figure 88: APAC Tea and Tea-Based Beverages Market Value Share (%) and BPS Analysis by Country, 2018-2028
Figure 89: APAC Tea and Tea-Based Beverages Market Y-o-Y Growth (%) Projections by Country, 2018-2028
Figure 90: APAC Tea and Tea-Based Beverages Market Value Share (%) and BPS Analysis by Type, 2018 & 2028
Figure 91: APAC Tea and Tea-Based Beverages Market Y-o-Y Growth (%) Projections by Type, 2018-2028
Figure 92: APAC Tea and Tea-Based Beverages Market Value Share (%) and BPS Analysis by Packaging, 2018-2028
Figure 93: APAC Tea and Tea-Based Beverages Market Y-o-Y Growth (%) Projections by Packaging, 2018-2028
Figure 94: APAC Tea and Tea-Based Beverages Market Value Share (%) and BPS Analysis by Sales Channel, 2018-2028
Figure 95: APAC Tea and Tea-Based Beverages Market Y-o-Y Growth (%) Projections by Sales Channel, 2018-2028
Figure 96: APAC Tea and Tea-Based Beverages Market Value Share (%) and BPS Analysis by Nature, 2018-2028
Figure 97: APAC Tea and Tea-Based Beverages Market Y-o-Y Growth (%) Projections by Nature, 2018-2028
Figure 98: APAC Tea and Tea-Based Beverages Market Value Share (%) and BPS Analysis by Format, 2018-2028
Figure 99: APAC Tea and Tea-Based Beverages Market Y-o-Y Growth (%) Projections by Format, 2018-2028
Figure 100: APAC Tea and Tea-Based Beverages Market Attractiveness Analysis, by Type, 2018 & 2028
Figure 101: APAC Tea and Tea-Based Beverages Market Attractiveness Analysis, by Packaging, 2018 & 2028
Figure 102: APAC Tea and Tea-Based Beverages Market Attractiveness Analysis, by Sales Channel, 2018 & 2028
Figure 103: APAC Tea and Tea-Based Beverages Market Attractiveness Analysis, by Nature, 2018 & 2028
Figure 104: APAC Tea and Tea-Based Beverages Market Attractiveness Analysis, by Format, 2018 & 2028
Figure 105: APAC Tea and Tea-Based Beverages Market Attractiveness Analysis, by Region, 2018 & 2028
Figure 106: MEA Tea and Tea-Based Beverages Market Value Share (%) and BPS Analysis by Country, 2018-2028
Figure 107: MEA Tea and Tea-Based Beverages Market Y-o-Y Growth (%) Projections by Country, 2018-2028
Figure 108: MEA Tea and Tea-Based Beverages Market Value Share (%) and BPS Analysis by Type, 2018 & 2028
Figure 109: MEA Tea and Tea-Based Beverages Market Y-o-Y Growth (%) Projections by Type, 2018-2028
Figure 110: MEA Tea and Tea-Based Beverages Market Value Share (%) and BPS Analysis by Packaging, 2018-2028
Figure 111: MEA Tea and Tea-Based Beverages Market Y-o-Y Growth (%) Projections by Packaging, 2018-2028
Figure 112: MEA Tea and Tea-Based Beverages Market Value Share (%) and BPS Analysis by Sales Channel, 2018-2028
Figure 113: MEA Tea and Tea-Based Beverages Market Y-o-Y Growth (%) Projections by Sales Channel, 2018-2028
Figure 114: MEA Tea and Tea-Based Beverages Market Value Share (%) and BPS Analysis by Nature, 2018-2028
Figure 115: MEA Tea and Tea-Based Beverages Market Y-o-Y Growth (%) Projections by Nature, 2018-2028
Figure 116: MEA Tea and Tea-Based Beverages Market Value Share (%) and BPS Analysis by Format, 2018-2028
Figure 117: MEA Tea and Tea-Based Beverages Market Y-o-Y Growth (%) Projections by Format, 2018-2028
Figure 118: MEA Tea and Tea-Based Beverages Market Attractiveness Analysis, by Type, 2018 & 2028
Figure 119: MEA Tea and Tea-Based Beverages Market Attractiveness Analysis, by Packaging, 2018 & 2028
Figure 120: MEA Tea and Tea-Based Beverages Market Attractiveness Analysis, by Sales Channel, 2018 & 2028
Figure 121: MEA Tea and Tea-Based Beverages Market Attractiveness Analysis, by Nature, 2018 & 2028
Figure 122: MEA Tea and Tea-Based Beverages Market Attractiveness Analysis, by Format, 2018 & 2028
Figure 123: MEA Tea and Tea-Based Beverages Market Attractiveness Analysis, by Region, 2018 & 2028
Copyright © Transparency Market Research, Inc. All Rights reserved
Trust Online

Tea & Tea Based Beverages Market