
Reports
Reports
Smart Classroom Market - Snapshot
Smart classrooms are technologically advanced classrooms that provide opportunities for smart learning and teaching by integrating advanced solutions and products, such as specialized learning and teaching software, assistive listening devices, student response management solutions, etc. Rapid developments in the field of IT and communication are opening up cost-effective and simpler ways to deliver education. Moreover, advanced technologies such as Artificial Intelligence and cloud computing has introduced new avenues for educational institutions to teach and engage their students. Rising smart city initiatives by governments is also compelling educational institutes to adopt digital solutions to provide enhanced education to students.
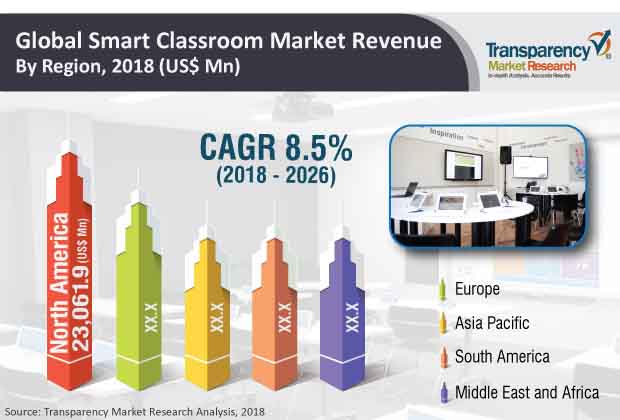
The global smart classroom market is expected to expand at a CAGR of 8.5 % during the forecast period 2018-2026. The market is expected to reach 109,660.3 Mn in 2026. The smart classroom market is primarily driven by government initiatives to offer digital education to students. Governments of several countries are increasingly engaging in providing digital education in schools and other educational institutions. Besides providing broadband facilities, governments are also encouraging educational institutions to offer e-learning courses. For instance, FutureSchools@Singapore, an initiative by the government of Singapore, provides high-end technology and digital content to schools of Singapore. Furthermore, as per the 2018 budget, the government of Singapore plans to spend about US$ 12.8 Bn in 2018 on the education sector in order to provide better quality education to students. Thus, rise in investments in the education sector and increase in number of government initiatives supporting digital education are some of the factors driving the smart classroom market globally.
The smart classroom market is segmented by component, end-use, and region. By component, the market has been segmented into hardware, software, and services. Based on hardware, the market has been bifurcated into Interactive Whiteboard (IWB)/flat panel, digital display, smart projector, and others. Digital display segment and IWB/flat panel segment are expected to hold more than 50% of the total market share. Smart projector segment is further divided into ultra-short throw projectors, short throw projectors, and standard throw projectors. On the basis of software, the global smart classroom market is segmented into learning management software, student response software, classroom management & assessment software, distance learning software, and others. Learning management software segment is expected to have higher adoption rate among end-users during the forecast period. Services segment is further bifurcated into professional services and managed/outsourced services. Based on end-use, the market has been segmented into early education, K-12 education, higher education, language education, and vocational education. Revenue data is estimated for all the above mentioned segments.
The smart classroom market is also bifurcated on the basis of various regions into North America, Europe, South America, Middle East & Africa, and Asia Pacific. North America is projected to hold the dominant share in the global smart classroom market during the forecast period.This is majorly due to presence of leading players in this region. Middle East & Africa and South America are witnessing limited adoption of smart classrooms as compared to other regions. However, growing investments of governments to offer smart education is expected to offer healthy growth to the market during the long term forecast period.
Companies are majorly focusing on increasing their customer base by providing services in untapped markets. Governments that have stringent policies and regulations regarding digital educationare helping the market players by providing them an opportunity to offer their products and solutions. This in turn will strengthen the market share globally.Trend of leading players acquiring technology start-ups is also seen in the market. Merger and acquisition strategy will help companies to enhance their customer base and generate new revenue streams. The global smart classroom market comprises large number of multinational companies providing a range of comprehensive services and solutions to end-users. These companies include Samsung Electronics Co. Ltd, Microsoft Corporation, Dell Inc., Fujitsu Ltd, and IBM Corporation.
1. Preface
1.1. Market Scope
1.2. Market Segmentation
1.3. Key Research Objectives
1.4. Research Highlights
2. Assumptions and Research Methodology
2.1. Market Taxonomy - Segment Definitions
2.2. Research Methodology
2.2.1. List of Primary and Secondary Sources
2.3. Key Assumptions for Data Modelling
3. Executive Summary : Global Smart Classroom Market
4. Market Overview
4.1. Introduction
4.2. Global Market – Macro Economic Factors Overview
4.3. Technology/Product Roadmap
4.4. Market Factor Analysis
4.4.1. Porter’s Five Forces Analysis
4.4.2. PESTEL Analysis
4.4.3. Value Chain Analysis
4.4.3.1. Key End User/Customers Analysis
4.4.4. Market Dynamics (Growth Influencers)
4.4.4.1. Drivers
4.4.4.2. Restraints
4.4.4.3. Opportunities
4.4.4.4. Impact Analysis of Drivers & Restraints
4.5. Regulations and Policies
4.6. Global Smart Classroom Market Analysis and Forecast, 2016 - 2026
4.6.1. Market Revenue Analysis (US$ Mn & Thousand Units)
4.6.1.1. Historic growth trends, 2012-2017
4.6.1.2. Forecast trends, 2017-2026
4.7. Global Market Opportunity Assessment
4.7.1. By Component
4.7.2. By End-use
4.7.3. By Country
4.8. Market Outlook
4.9. Competitive Scenario and Trends
4.9.1. Smart Classroom Market Concentration Rate
4.9.1.1. List of New Entrants
4.9.2. Mergers & Acquisitions, Expansions
5. Global Smart Classroom Market Analysis and Forecast, By Component
5.1. Overview and Definition
5.2. Key Segment Analysis
5.3. Smart Classroom Market Size (US$ Mn & Thousand Units) Forecast, By Component, 2016 - 2026
5.3.1. Hardware
5.3.1.1. Interactive Whiteboards
5.3.1.2. Digital Displays
5.3.1.3. Smart Projectors
5.3.1.3.1. Ultra Short Throw
5.3.1.3.2. Short throw
5.3.1.3.3. Standard Throw
5.3.1.4. Others (Video Conferencing Hardware)
5.3.1.4.1. Codec
5.3.1.4.2. Microphone
5.3.1.4.3. Camera
5.3.2. Software
5.3.2.1. Learning Management Software
5.3.2.2. Student Response Software
5.3.2.3. Classroom Management and Assessment Software
5.3.2.4. Distance Education Solutions
5.3.2.5. Others (Video Conferencing Solutions)
5.3.3. Services
5.3.3.1. Managed/Outsourced
5.3.3.2. Professional
5.3.3.2.1. Consulting
5.3.3.2.2. Implementation & Integration
5.3.3.2.3. Operation & Maintenance
6. Global Smart Classroom Market Analysis and Forecast, By End-use
6.1. Overview and Definition
6.2. Key Segment Analysis
6.3. Smart Classroom Market Size (US$ Mn) Forecast, By End-use, 2016 - 2026
6.3.1. Early Education
6.3.2. K-12 Education
6.3.3. Higher Education
6.3.4. Language Education
6.3.5. Vocational Education
7. Global Smart Classroom Market Analysis and Forecast, By Region
7.1. Overview and Definition
7.2. Key Findings
7.3. Smart Classroom Market Size (US$ Mn) Forecast, By Region, 2016 -2026
7.3.1. North America
7.3.2. Europe
7.3.3. Asia Pacific
7.3.4. Middle East & Africa
7.3.5. South America
8. North America Smart Classroom Market Analysis and Forecast
8.1. Key Findings
8.2. Smart Classroom Market Size (US$ Mn) Forecast, By Component, 2016 - 2026
8.2.1. Hardware
8.2.1.1. Interactive Whiteboards
8.2.1.2. Digital Displays
8.2.1.3. Smart Projectors
8.2.1.3.1. Ultra Short Throw
8.2.1.3.2. Short throw
8.2.1.3.3. Standard Throw
8.2.1.4. Others (Video Conferencing Hardware)
8.2.1.4.1. Codec
8.2.1.4.2. Microphone
8.2.1.4.3. Camera
8.2.2. Software
8.2.2.1. Learning Management Software
8.2.2.2. Student Response Software
8.2.2.3. Classroom Management and Assessment Software
8.2.2.4. Distance Education Solutions
8.2.2.5. Others (Video Conferencing Solutions)
8.2.3. Services
8.2.3.1. Managed/Outsourced
8.2.3.2. Professional
8.2.3.2.1. Consulting
8.2.3.2.2. Implementation & Integration
8.2.3.2.3. Operation & Maintenance
8.3. Smart Classroom Market Size (US$ Mn) Forecast, By End-use, 2016 - 2026
8.3.1. Early Education
8.3.2. K-12 Education
8.3.3. Higher Education
8.3.4. Language Education
8.3.5. Vocational Education
8.4. Smart Classroom Market Size (US$ Mn) Forecast, By Country and Sub-region, 2016 - 2026
8.4.1. The U.S.
8.4.2. Canada
8.4.3. Rest of North America
8.5. Market Attractiveness Analysis
8.5.1. By Component
8.5.2. By End-use
8.5.3. By Country
9. Europe Smart Classroom Market Analysis and Forecast
9.1. Key Findings
9.2. Smart Classroom Market Size (US$ Mn) Forecast, By Component, 2016 - 2026
9.2.1. Hardware
9.2.1.1. Interactive Whiteboards
9.2.1.2. Digital Displays
9.2.1.3. Smart Projectors
9.2.1.3.1. Ultra Short Throw
9.2.1.3.2. Short throw
9.2.1.3.3. Standard Throw
9.2.1.4. Others (Video Conferencing Hardware)
9.2.1.4.1. Codec
9.2.1.4.2. Microphone
9.2.1.4.3. Camera
9.2.2. Software
9.2.2.1. Learning Management Software
9.2.2.2. Student Response Software
9.2.2.3. Classroom Management and Assessment Software
9.2.2.4. Distance Education Solutions
9.2.2.5. Others (Video Conferencing Solutions)
9.2.3. Services
9.2.3.1. Managed/Outsourced
9.2.3.2. Professional
9.2.3.2.1. Consulting
9.2.3.2.2. Implementation & Integration
9.2.3.2.3. Operation & Maintenance
9.3. Smart Classroom Market Size (US$ Mn) Forecast, By End-use, 2016 - 2026
9.3.1. Early Education
9.3.2. K-12 Education
9.3.3. Higher Education
9.3.4. Language Education
9.3.5. Vocational Education
9.4. Smart Classroom Market Size (US$ Mn) Forecast, By Country and Sub-region, 2016 - 2026
9.4.1. Germany
9.4.2. France
9.4.3. The U.K.
9.4.4. Rest of Europe
9.5. Market Attractiveness Analysis
9.5.1. By Component
9.5.2. By End-use
9.5.3. By Country
10. Asia Pacific Smart Classroom Market Analysis and Forecast
10.1. Key Findings
10.2. Smart Classroom Market Size (US$ Mn) Forecast, By Component, 2016 - 2026
10.2.1. Hardware
10.2.1.1.Interactive Whiteboards
10.2.1.2.Digital Displays
10.2.1.3.Smart Projectors
10.2.1.3.1.Ultra Short Throw
10.2.1.3.2.Short throw
10.2.1.3.3.Standard Throw
10.2.1.4.Others (Video Conferencing Hardware)
10.2.1.4.1.Codec
10.2.1.4.2.Microphone
10.2.1.4.3.Camera
10.2.2. Software
10.2.2.1.Learning Management Software
10.2.2.2.Student Response Software
10.2.2.3.Classroom Management and Assessment Software
10.2.2.4.Distance Education Solutions
10.2.2.5.Others (Video Conferencing Solutions)
10.2.3. Services
10.2.3.1.Managed/Outsourced
10.2.3.2.Professional
10.2.3.2.1.Consulting
10.2.3.2.2.Implementation & Integration
10.2.3.2.3.Operation & Maintenance
10.3. Smart Classroom Market Size (US$ Mn) Forecast, By End-use, 2016 - 2026
10.3.1. Early Education
10.3.2. K-12 Education
10.3.3. Higher Education
10.3.4. Language Education
10.3.5. Vocational Education
10.4. Smart Classroom Market Size (US$ Mn) Forecast, By Country and Sub-region, 2016 - 2026
10.4.1. China
10.4.2. Japan
10.4.3. India
10.4.4. Rest of Asia Pacific
10.5. Market Attractiveness Analysis
10.5.1. By Component
10.5.2. By End-use
10.5.3. By Country
11. ASEAN Smart Classroom Market Analysis and Forecast
11.1. Key Findings
11.2. Smart Classroom Market Size (US$ Mn& Thousand Units) Forecast, By Component, 2016 - 2026
11.2.1. Hardware
11.2.1.1.Interactive Whiteboards
11.2.1.2.Digital Displays
11.2.1.3.Smart Projectors
11.2.1.3.1.Ultra Short Throw
11.2.1.3.2.Short throw
11.2.1.3.3.Standard Throw
11.2.1.4.Others (Video Conferencing Hardware)
11.2.1.4.1.Codec
11.2.1.4.2.Microphone
11.2.1.4.3.Camera
11.2.2. Software
11.2.2.1.Learning Management Software
11.2.2.2.Student Response Software
11.2.2.3.Classroom Management and Assessment Software
11.2.2.4.Distance Education Solutions
11.2.2.5.Others (Video Conferencing Solutions)
11.2.3. Services
11.2.3.1.Managed/Outsourced
11.2.3.2.Professional
11.2.3.2.1.Consulting
11.2.3.2.2.Implementation & Integration
11.2.3.2.3.Operation & Maintenance
11.3. Smart Classroom Market Size (US$ Mn) Forecast, By End-use, 2016 - 2026
11.3.1. Early Education
11.3.2. K-12 Education
11.3.3. Higher Education
11.3.4. Language Education
11.3.5. Vocational Education
11.4. Smart Classroom Market Size (US$ Mn) Forecast, By Country, 2016 - 2026
11.4.1. Indonesia
11.4.2. Thailand
11.4.3. Malaysia
11.4.4. Singapore
11.4.5. Philippines
11.4.6. Vietnam
11.4.7. Others (Cambodia, Laos, Brunei, Myanmar)
11.5. Market Attractiveness Analysis
11.5.1. By Component
11.5.2. By End-use
11.5.3. By Country
12. Indonesia Smart Classroom Market Analysis and Forecast
12.1. Key Findings
12.2. Smart Classroom Market Size (US$ Mn) Forecast, By Component, 2016 - 2026
12.2.1. Hardware
12.2.1.1.Interactive Whiteboards
12.2.1.2.Digital Displays
12.2.1.3.Smart Projectors
12.2.1.3.1.Ultra Short Throw
12.2.1.3.2.Short throw
12.2.1.3.3.Standard Throw
12.2.1.4.Others (Video Conferencing Hardware)
12.2.1.4.1.Codec
12.2.1.4.2.Microphone
12.2.1.4.3.Camera
12.2.2. Software
12.2.2.1.Learning Management Software
12.2.2.2.Student Response Software
12.2.2.3.Classroom Management and Assessment Software
12.2.2.4.Distance Education Solutions
12.2.2.5.Others (Video Conferencing Solutions)
12.2.3. Services
12.2.3.1.Managed/Outsourced
12.2.3.2.Professional
12.2.3.2.1.Consulting
12.2.3.2.2.Implementation & Integration
12.2.3.2.3.Operation & Maintenance
12.3. Smart Classroom Market Size (US$ Mn) Forecast, By End-use, 2016 - 2026
12.3.1. Early Education
12.3.2. K-12 Education
12.3.3. Higher Education
12.3.4. Language Education
12.3.5. Vocational Education
12.4. Market Attractiveness Analysis
12.4.1. By Component
12.4.2. By End-use
13. Thailand Smart Classroom Market Analysis and Forecast
13.1. Key Findings
13.2. Smart Classroom Market Size (US$ Mn) Forecast, By Component, 2016 - 2026
13.2.1. Hardware
13.2.1.1.Interactive Whiteboards
13.2.1.2.Digital Displays
13.2.1.3.Smart Projectors
13.2.1.3.1.Ultra Short Throw
13.2.1.3.2.Short throw
13.2.1.3.3.Standard Throw
13.2.1.4.Others (Video Conferencing Hardware)
13.2.1.4.1.Codec
13.2.1.4.2.Microphone
13.2.1.4.3.Camera
13.2.2. Software
13.2.2.1.Learning Management Software
13.2.2.2.Student Response Software
13.2.2.3.Classroom Management and Assessment Software
13.2.2.4.Distance Education Solutions
13.2.2.5.Others (Video Conferencing Solutions)
13.2.3. Services
13.2.3.1.Managed/Outsourced
13.2.3.2.Professional
13.2.3.2.1.Consulting
13.2.3.2.2.Implementation & Integration
13.2.3.2.3.Operation & Maintenance
13.3. Smart Classroom Market Size (US$ Mn) Forecast, By End-use, 2016 - 2026
13.3.1. Early Education
13.3.2. K-12 Education
13.3.3. Higher Education
13.3.4. Language Education
13.3.5. Vocational Education
13.4. Market Attractiveness Analysis
13.4.1. By Component
13.4.2. By End-use
14. Malaysia Smart Classroom Market Analysis and Forecast
14.1. Key Findings
14.2. Smart Classroom Market Size (US$ Mn) Forecast, By Component, 2016 - 2026
14.2.1. Hardware
14.2.1.1.Interactive Whiteboards
14.2.1.2.Digital Displays
14.2.1.3.Smart Projectors
14.2.1.3.1.Ultra Short Throw
14.2.1.3.2.Short throw
14.2.1.3.3.Standard Throw
14.2.1.4.Others (Video Conferencing Hardware)
14.2.1.4.1.Codec
14.2.1.4.2.Microphone
14.2.1.4.3.Camera
14.2.2. Software
14.2.2.1.Learning Management Software
14.2.2.2.Student Response Software
14.2.2.3.Classroom Management and Assessment Software
14.2.2.4.Distance Education Solutions
14.2.2.5.Others (Video Conferencing Solutions)
14.2.3. Services
14.2.3.1.Managed/Outsourced
14.2.3.2.Professional
14.2.3.2.1.Consulting
14.2.3.2.2.Implementation & Integration
14.2.3.2.3.Operation & Maintenance
14.3. Smart Classroom Market Size (US$ Mn) Forecast, By End-use, 2016 - 2026
14.3.1. Early Education
14.3.2. K-12 Education
14.3.3. Higher Education
14.3.4. Language Education
14.3.5. Vocational Education
14.4. Market Attractiveness Analysis
14.4.1. By Component
14.4.2. By End-use
15. Singapore Smart Classroom Market Analysis and Forecast
15.1. Key Findings
15.2. Smart Classroom Market Size (US$ Mn) Forecast, By Component, 2016 - 2026
15.2.1. Hardware
15.2.1.1.Interactive Whiteboards
15.2.1.2.Digital Displays
15.2.1.3.Smart Projectors
15.2.1.3.1.Ultra Short Throw
15.2.1.3.2.Short throw
15.2.1.3.3.Standard Throw
15.2.1.4.Others (Video Conferencing Hardware)
15.2.1.4.1.Codec
15.2.1.4.2.Microphone
15.2.1.4.3.Camera
15.2.2. Software
15.2.2.1.Learning Management Software
15.2.2.2.Student Response Software
15.2.2.3.Classroom Management and Assessment Software
15.2.2.4.Distance Education Solutions
15.2.2.5.Others (Video Conferencing Solutions)
15.2.3. Services
15.2.3.1.Managed/Outsourced
15.2.3.2.Professional
15.2.3.2.1.Consulting
15.2.3.2.2.Implementation & Integration
15.2.3.2.3.Operation & Maintenance
15.3. Smart Classroom Market Size (US$ Mn) Forecast, By End-use, 2016 - 2026
15.3.1. Early Education
15.3.2. K-12 Education
15.3.3. Higher Education
15.3.4. Language Education
15.3.5. Vocational Education
15.4. Market Attractiveness Analysis
15.4.1. By Component
15.4.2. By End-use
16. Philippines Smart Classroom Market Analysis and Forecast
16.1. Key Findings
16.2. Smart Classroom Market Size (US$ Mn) Forecast, By Component, 2016 - 2026
16.2.1. Hardware
16.2.1.1.Interactive Whiteboards
16.2.1.2.Digital Displays
16.2.1.3.Smart Projectors
16.2.1.3.1.Ultra Short Throw
16.2.1.3.2.Short throw
16.2.1.3.3.Standard Throw
16.2.1.4.Others (Video Conferencing Hardware)
16.2.1.4.1.Codec
16.2.1.4.2.Microphone
16.2.1.4.3.Camera
16.2.2. Software
16.2.2.1.Learning Management Software
16.2.2.2.Student Response Software
16.2.2.3.Classroom Management and Assessment Software
16.2.2.4.Distance Education Solutions
16.2.2.5.Others (Video Conferencing Solutions)
16.2.3. Services
16.2.3.1.Managed/Outsourced
16.2.3.2.Professional
16.2.3.2.1.Consulting
16.2.3.2.2.Implementation & Integration
16.2.3.2.3.Operation & Maintenance
16.3. Smart Classroom Market Size (US$ Mn) Forecast, By End-use, 2016 - 2026
16.3.1. Early Education
16.3.2. K-12 Education
16.3.3. Higher Education
16.3.4. Language Education
16.3.5. Vocational Education
16.4. Market Attractiveness Analysis
16.4.1. By Component
16.4.2. By End-use
17. Vietnam Smart Classroom Market Analysis and Forecast
17.1. Key Findings
17.2. Smart Classroom Market Size (US$ Mn) Forecast, By Component, 2016 - 2026
17.2.1. Hardware
17.2.1.1.Interactive Whiteboards
17.2.1.2.Digital Displays
17.2.1.3.Smart Projectors
17.2.1.3.1.Ultra Short Throw
17.2.1.3.2.Short throw
17.2.1.3.3.Standard Throw
17.2.1.4.Others (Video Conferencing Hardware)
17.2.1.4.1.Codec
17.2.1.4.2.Microphone
17.2.1.4.3.Camera
17.2.2. Software
17.2.2.1.Learning Management Software
17.2.2.2.Student Response Software
17.2.2.3.Classroom Management and Assessment Software
17.2.2.4.Distance Education Solutions
17.2.2.5.Others (Video Conferencing Solutions)
17.2.3. Services
17.2.3.1.Managed/Outsourced
17.2.3.2.Professional
17.2.3.2.1.Consulting
17.2.3.2.2.Implementation & Integration
17.2.3.2.3.Operation & Maintenance
17.3. Smart Classroom Market Size (US$ Mn) Forecast, By End-use, 2016 - 2026
17.3.1. Early Education
17.3.2. K-12 Education
17.3.3. Higher Education
17.3.4. Language Education
17.3.5. Vocational Education
17.4. Market Attractiveness Analysis
17.4.1. By Component
17.4.2. By End-use
18. Middle East & Africa (MEA) Smart Classroom Market Analysis and Forecast
18.1. Key Findings
18.2. Smart Classroom Market Size (US$ Mn) Forecast, By Component, 2016 - 2026
18.2.1. Hardware
18.2.1.1.Interactive Whiteboards
18.2.1.2.Digital Displays
18.2.1.3.Smart Projectors
18.2.1.3.1.Ultra Short Throw
18.2.1.3.2.Short throw
18.2.1.3.3.Standard Throw
18.2.1.4.Others (Video Conferencing Hardware)
18.2.1.4.1.Codec
18.2.1.4.2.Microphone
18.2.1.4.3.Camera
18.2.2. Software
18.2.2.1.Learning Management Software
18.2.2.2.Student Response Software
18.2.2.3.Classroom Management and Assessment Software
18.2.2.4.Distance Education Solutions
18.2.2.5.Others (Video Conferencing Solutions)
18.2.3. Services
18.2.3.1.Managed/Outsourced
18.2.3.2.Professional
18.2.3.2.1.Consulting
18.2.3.2.2.Implementation & Integration
18.2.3.2.3.Operation & Maintenance
18.3. Smart Classroom Market Size (US$ Mn) Forecast, By End-use, 2016 - 2026
18.3.1. Early Education
18.3.2. K-12 Education
18.3.3. Higher Education
18.3.4. Language Education
18.3.5. Vocational Education
18.4. Smart Classroom Market Size (US$ Mn) Forecast, By Country and Sub-region, 2016 - 2026
18.4.1. GCC Countries
18.4.2. South Africa
18.4.3. Rest of MEA
18.5. Market Attractiveness Analysis
18.5.1. By Component
18.5.2. By End-use
18.5.3. By Country
19. South America Smart Classroom Market Analysis and Forecast
19.1. Key Findings
19.2. Smart Classroom Market Size (US$ Mn) Forecast, By Component, 2016 - 2026
19.2.1. Hardware
19.2.1.1.Interactive Whiteboards
19.2.1.2.Digital Displays
19.2.1.3.Smart Projectors
19.2.1.3.1.Ultra Short Throw
19.2.1.3.2.Short throw
19.2.1.3.3.Standard Throw
19.2.1.4.Others (Video Conferencing Hardware)
19.2.1.4.1.Codec
19.2.1.4.2.Microphone
19.2.1.4.3.Camera
19.2.2. Software
19.2.2.1.Learning Management Software
19.2.2.2.Student Response Software
19.2.2.3.Classroom Management and Assessment Software
19.2.2.4.Distance Education Solutions
19.2.2.5.Others (Video Conferencing Solutions)
19.2.3. Services
19.2.3.1.Managed/Outsourced
19.2.3.2.Professional
19.2.3.2.1.Consulting
19.2.3.2.2.Implementation & Integration
19.2.3.2.3.Operation & Maintenance
19.3. Smart Classroom Market Size (US$ Mn) Forecast, By End-use, 2016 - 2026
19.3.1. Early Education
19.3.2. K-12 Education
19.3.3. Higher Education
19.3.4. Language Education
19.3.5. Vocational Education
19.4. Smart Classroom Market Size (US$ Mn) Forecast, By Country and Sub-region, 2016 - 2026
19.4.1. Brazil
19.4.2. Rest of South America
19.5. Market Attractiveness Analysis
19.5.1. By Component
19.5.2. By End-use
19.5.3. By Country
20. Competition Landscape
20.1. Market Player – Competition Matrix
20.2. Market Revenue Share Analysis (%), By Company (2017)
20.3. Regional Presence (Intensity Map)
21. Company Profiles (Details – Business Overview, Sales Area/Geographical Presence, Revenue, Key Business Strategy)
21.1.1. Microsoft Corporation
21.1.2. Dell Inc.
21.1.3. Apple, Inc.
21.1.4. Fujitsu Ltd.
21.1.5. Cisco Systems, Inc.
21.1.6. International Business Machines Corp.
21.1.7. Samsung Electronics Co., Ltd.
21.1.8. Blackboard, Inc.
21.1.9. Educomp Solutions Ltd.
21.1.10. Adobe Corporation
21.1.11. NIIT Ltd.
22. Key Takeaways
List of Table
Table 01: Global Smart Classroom Market Revenue (US$ Mn) Forecast, by Component, 2016 - 2026
Table 02: Global Smart Classroom Market Size (US$ Mn) Forecast, by Component, Hardware, 2016–2026
Table 03: Global Smart Classroom Market Size (Thousand Units) Forecast, by Component, Hardware, 2016–2026
Table 04: Global Smart Classroom Market Size (US$ Mn) Forecast, by Component, Software, 2016–2026
Table 05: Global Smart Classroom Market Size (US$ Mn) Forecast, by Component, Services, 2016–2026
Table 06: Global Smart Classroom Market Size (US$ Mn) Forecast, by End-use, 2016–2026
Table 07: Global Smart Classroom Market Size (US$ Mn) Forecast, by Region, 2016–2026
Table 08: North America Smart Classroom Market Size (US$ Mn) Forecast, by Component, 2016–2026
Table 09: North America Smart Classroom Market Size (US$ Mn) Forecast, by Component, Hardware, 2016–2026
Table 10: North America Smart Classroom Market Size (Thousand Units) Forecast, by Component, Hardware, 2016–2026
Table 11: North America Smart Classroom Market Size (US$ Mn) Forecast, by Component, Software, 2016–2026
Table 12: North America Smart Classroom Market Size (US$ Mn) Forecast, by Component, Services, 2016–2026
Table 13: North America Smart Classroom Market Size (US$ Mn) Forecast, by End-use, 2016–2026
Table 14: North America Smart Classroom Market Size (US$ Mn) Forecast, by Country, 2016–2026
Table 15: Europe Smart Classroom Market Size (US$ Mn) Forecast, by Component, 2016–2026
Table 16: Europe Smart Classroom Market Size (US$ Mn) Forecast, by Component, Hardware, 2016–2026
Table 17: Europe Smart Classroom Market Size (Thousand Units) Forecast, by Component, Hardware, 2016–2026
Table 18: Europe Smart Classroom Market Size (US$ Mn) Forecast, by Component, Software, 2016–2026
Table 19: Europe Smart Classroom Market Size (US$ Mn) Forecast, by Component, Services, 2016–2026
Table 20: Europe Smart Classroom Market Size (US$ Mn) Forecast, by End-use, 2016–2026
Table 21: Europe Smart Classroom Market Size (US$ Mn) Forecast, by Country, 2016–2026
Table 22: Asia Pacific Smart Classroom Market Size (US$ Mn) Forecast, by Component, 2016–2026
Table 23: Asia Pacific Smart Classroom Market Size (US$ Mn) Forecast, by Component, Hardware, 2016–2026
Table 24: Asia Pacific Smart Classroom Market Size (Thousand Units) Forecast, by Component, Hardware, 2016–2026
Table 25: Asia Pacific Smart Classroom Market Size (US$ Mn) Forecast, by Component, Software, 2016–2026
Table 26: Asia Pacific Smart Classroom Market Size (US$ Mn) Forecast, by Component, Services, 2016–2026
Table 27: Asia Pacific Smart Classroom Market Size (US$ Mn) Forecast, by End-use, 2016–2026
Table 28: Asia Pacific Smart Classroom Market Size (US$ Mn) Forecast, by Country, 2016–2026
Table 29: ASEAN Smart Classroom Market Revenue (US$ Mn) Forecast, By Component, 2016 - 2026
Table 30: ASEAN Smart Classroom Market Size (US$ Mn) Forecast, by Component, Hardware, 2016–2026
Table 31: ASEAN Smart Classroom Market Size (Thousand Units) Forecast, by Component, Hardware, 2016–2026
Table 32: ASEAN Smart Classroom Market Size (US$ Mn) Forecast, by Component, Software, 2016–2026
Table 33: ASEAN Smart Classroom Market Size (US$ Mn) Forecast, by Component, Services, 2016–2026
Table 34: ASEAN Smart Classroom Market Size (US$ Mn) Forecast, by End-use, 2016–2026
Table 35: ASEAN Smart Classroom Market Size (US$ Mn) Forecast, by Country, 2016–2026
Table 36: Indonesia Smart Classroom Market Size (US$ Mn) Forecast, by Component, 2016–2026
Table 37: Indonesia Smart Classroom Market Size (US$ Mn) Forecast, by Component, Hardware, 2016–2026
Table 38: Indonesia Smart Classroom Market Size (US$ Mn) Forecast, by Component, Software, 2016–2026
Table 39: Indonesia Smart Classroom Market Size (US$ Mn) Forecast, by Component, Services, 2016–2026
Table 40: Indonesia Smart Classroom Market Size (US$ Mn) Forecast, by End-use, 2016–2026
Table 41: Thailand Smart Classroom Market Size (US$ Mn) Forecast, by Component, 2016–2026
Table 42: Thailand Smart Classroom Market Size (US$ Mn) Forecast, by Component, Hardware, 2016–2026
Table 43: Thailand Smart Classroom Market Size (US$ Mn) Forecast, by Component, Software, 2016–2026
Table 44: Thailand Smart Classroom Market Size (US$ Mn) Forecast, by Component, Services, 2016–2026
Table 45: Thailand Smart Classroom Market Size (US$ Mn) Forecast, by End-use, 2016–2026
Table 46: Malaysia Smart Classroom Market Size (US$ Mn) Forecast, by Component, 2016–2026
Table 47: Malaysia Smart Classroom Market Size (US$ Mn) Forecast, by Component, Hardware, 2016–2026
Table 48: Malaysia Smart Classroom Market Size (US$ Mn) Forecast, by Component, Software, 2016–2026
Table 49: Malaysia Smart Classroom Market Size (US$ Mn) Forecast, by Component, Services, 2016–2026
Table 50: Malaysia Smart Classroom Market Size (US$ Mn) Forecast, by End-use, 2016–2026
Table 51: Singapore Smart Classroom Market Size (US$ Mn) Forecast, by Component, 2016–2026
Table 52: Singapore Smart Classroom Market Size (US$ Mn) Forecast, by Component, Hardware, 2016–2026
Table 53: Singapore Smart Classroom Market Size (US$ Mn) Forecast, by Component, Software, 2016–2026
Table 54: Singapore Smart Classroom Market Size (US$ Mn) Forecast, by Component, Services, 2016–2026
Table 55: Singapore Smart Classroom Market Size (US$ Mn) Forecast, by End-use, 2016–2026
Table 56: Philippines Smart Classroom Market Size (US$ Mn) Forecast, by Component, 2016–2026
Table 57: Philippines Smart Classroom Market Size (US$ Mn) Forecast, by Component, Hardware, 2016–2026
Table 58: Philippines Smart Classroom Market Size (US$ Mn) Forecast, by Component, Software, 2016–2026
Table 59: Philippines Smart Classroom Market Size (US$ Mn) Forecast, by Component, Services, 2016–2026
Table 60: Philippines Smart Classroom Market Size (US$ Mn) Forecast, by End-use, 2016–2026
Table 61: Vietnam Smart Classroom Market Size (US$ Mn) Forecast, by Component, 2016–2026
Table 62: Vietnam Smart Classroom Market Size (US$ Mn) Forecast, by Component, Hardware, 2016–2026
Table 63: Vietnam Smart Classroom Market Size (US$ Mn) Forecast, by Component, Software, 2016–2026
Table 64: Vietnam Smart Classroom Market Size (US$ Mn) Forecast, by Component, Services, 2016–2026
Table 65: Vietnam Smart Classroom Market Size (US$ Mn) Forecast, by End-use, 2016–2026
Table 66: MEA Smart Classroom Market Size (US$ Mn) Forecast, by Component, 2016–2026
Table 67: MEA Smart Classroom Market Size (US$ Mn) Forecast, by Component, Hardware, 2016–2026
Table 68: MEA Smart Classroom Market Size (Thousand Units) Forecast, by Component, Hardware, 2016–2026
Table 69: MEA Smart Classroom Market Size (US$ Mn) Forecast, by Component, Software, 2016–2026
Table 70: MEA Smart Classroom Market Size (US$ Mn) Forecast, by Component, Services, 2016–2026
Table 71: MEA Smart Classroom Market Size (US$ Mn) Forecast, by End-use, 2016–2026
Table 72: MEA Smart Classroom Market Size (US$ Mn) Forecast, by Country, 2016–2026
Table 73: South America Smart Classroom Market Size (US$ Mn) Forecast, by Component, 2016–2026
Table 74: South America Smart Classroom Market Size (US$ Mn) Forecast, by Component, Hardware, 2016–2026
Table 75: South America Smart Classroom Market Size (Thousand Units) Forecast, by Component, Hardware, 2016–2026
Table 76: South America Smart Classroom Market Size (US$ Mn) Forecast, by Component, Software, 2016–2026
Table 77: South America Smart Classroom Market Size (US$ Mn) Forecast, by Component, Services, 2016–2026
Table 78: South America Smart Classroom Market Size (US$ Mn) Forecast, by End-use, 2016–2026
Table 79: South America Smart Classroom Market Size (US$ Mn) Forecast, by Country, 2016–2026
List of Figures
Figure 1: Global Smart Classroom Market is expected to grow at a CAGR of 8.0% from US$ 3,050.8 Mn in 2018 to US$ 5,637.3 Mn in 2026
Figure 2: Global Smart Classroom Market Size (US$ Mn) Forecast, 2016–2026
Figure 3: Smart Classroom Market Size (US$ Mn) Forecast, 2012 – 2026
Figure 4: Global Smart Classroom Market Y-o-Y Growth (Value %) Forecast, 2017 – 2026
Figure 5: Smart Classroom Market Size (Thousand Units) Forecast, 2012 – 2026
Figure 6: Global Smart Classroom Market Y-o-Y Growth (Value %) Forecast, 2017 – 2026
Figure 7: Global Smart Classroom Market Attractiveness Analysis, by Component
Figure 8: Global Smart Classroom Market Attractiveness Analysis, by End-use
Figure 9: Global Smart Classroom Market Attractiveness Analysis, by Country
Figure 10: Global Smart Classroom Market Share Analysis, by Component (2018)
Figure 11: Global Smart Classroom Market Share Analysis, by Component (2026)
Figure 12: Global Smart Classroom Market Share Analysis (%), by Component – Software, 2018
Figure 13: Global Smart Classroom Market Share Analysis (%), by Component – Software, 2026
Figure 14: Global Smart Classroom Market Share Analysis (%), by Component – Services, 2018
Figure 15: Global Smart Classroom Market Share Analysis (%), by Component – Services, 2026
Figure 16: Global Smart Classroom Market Share Analysis (%), by End-use, 2018
Figure 17: Global Smart Classroom Market Share Analysis (%), by End-use, 2026
Figure 18: Global Smart Classroom Market Share Analysis (%), by Country, 2018
Figure 19: Global Smart Classroom Market Share Analysis (%), by Country, 2026
Figure 20: North America Smart Classroom Market Size (US$ Mn), forecast, 2016 - 2026
Figure 21: North America Smart Classroom Market Size (Thousand Units), forecast, 2016 - 2026
Figure 22: North America Smart Classroom Market Share Analysis (%), by Component, 2018
Figure 23: North America Smart Classroom Market Share Analysis (%), by Component, 2026
Figure 24: North America Smart Classroom Market Share Analysis (%), by Component– Hardware, 2018
Figure 25: North America Smart Classroom Market Share Analysis (%), by Component– Hardware, 2026
Figure 26: North America Smart Classroom Market Share Analysis (%), by Component – Software, 2018
Figure 27: North America Smart Classroom Market Share Analysis (%), by Component – Software, 2026
Figure 28: North America Smart Classroom Market Share Analysis (%), by Component – Services, 2018
Figure 29: North America Smart Classroom Market Share Analysis (%), by Component – Services, 2026
Figure 30: North America Smart Classroom Market Share Analysis (%), by End-use, 2018
Figure 31: North America Smart Classroom Market Share Analysis (%), by End-use, 2026
Figure 32: North America Smart Classroom Market Share Analysis (%), by Country, 2018
Figure 33: North America Smart Classroom Market Share Analysis (%), by Country, 2026
Figure 34: North America Smart Classroom Market Attractiveness Analysis, by Component
Figure 35: North America Smart Classroom Market Attractiveness Analysis, by End-use
Figure 36: North America Smart Classroom Market Attractiveness Analysis, by Country
Figure 37: Europe Smart Classroom Market Size (US$ Mn), forecast, 2016 - 2026
Figure 38: Europe Smart Classroom Market Size (Thousand Units), forecast, 2016 - 2026
Figure 39: Europe Smart Classroom Market Share Analysis (%), by Component, 2018
Figure 40: Europe Smart Classroom Market Share Analysis (%), by Component, 2026
Figure 41: Europe Smart Classroom Market Share Analysis (%), by Component– Hardware, 2018
Figure 42: Europe Smart Classroom Market Share Analysis (%), by Component– Hardware, 2026
Figure 43: Europe Smart Classroom Market Share Analysis (%), by Component – Software, 2018
Figure 44: Europe Smart Classroom Market Share Analysis (%), by Component – Software, 2026
Figure 45: Europe Smart Classroom Market Share Analysis (%), by Component – Services, 2018
Figure 46: Europe Smart Classroom Market Share Analysis (%), by Component – Services, 2026
Figure 47: Europe Smart Classroom Market Share Analysis (%), by End-use, 2018
Figure 48: Europe Smart Classroom Market Share Analysis (%), by End-use, 2026
Figure 49: Europe Smart Classroom Market Share Analysis (%), by Country, 2018
Figure 50: Europe Smart Classroom Market Share Analysis (%), by Country, 2026
Figure 51: Europe Smart Classroom Market Attractiveness Analysis, by Component
Figure 52: Europe Smart Classroom Market Attractiveness Analysis, by End-use
Figure 53: Europe Smart Classroom Market Attractiveness Analysis, by Country
Figure 54: Asia Pacific Smart Classroom Market Size (US$ Mn), forecast, 2016 - 2026
Figure 55: Asia Pacific Smart Classroom Market Size (Thousand Units), forecast, 2016 - 2026
Figure 56: Asia Pacific Smart Classroom Market Share Analysis (%), by Component, 2018
Figure 57: Asia Pacific Smart Classroom Market Share Analysis (%), by Component, 2026
Figure 58: Asia Pacific Smart Classroom Market Share Analysis (%), by Component– Hardware, 2018
Figure 59: Asia Pacific Smart Classroom Market Share Analysis (%), by Component– Hardware, 2026
Figure 60: Asia Pacific Smart Classroom Market Share Analysis (%), by Component – Software, 2018
Figure 61: Asia Pacific Smart Classroom Market Share Analysis (%), by Component – Software, 2026
Figure 62: Asia Pacific Smart Classroom Market Share Analysis (%), by Component – Services, 2018
Figure 63: Asia Pacific Smart Classroom Market Share Analysis (%), by Component – Services, 2026
Figure 64: Asia Pacific Smart Classroom Market Share Analysis (%), by End-use, 2018
Figure 65: Asia Pacific Smart Classroom Market Share Analysis (%), by End-use, 2026
Figure 66: Asia Pacific Smart Classroom Market Share Analysis (%), by Country, 2018
Figure 67: Asia Pacific Smart Classroom Market Share Analysis (%), by Country, 2026
Figure 68: Asia Pacific Smart Classroom Market Attractiveness Analysis, by Component
Figure 69: Asia Pacific Smart Classroom Market Attractiveness Analysis, by End-use
Figure 70: Asia Pacific Smart Classroom Market Attractiveness Analysis, by Country
Figure 71: ASEAN Smart Classroom Market Share Analysis, by Component (2018)
Figure 72: ASEAN Smart Classroom Market Share Analysis, by Component (2026)
Figure 73: ASEAN Smart Classroom Market Share Analysis (%), by Component – Software, 2018
Figure 74: ASEAN Smart Classroom Market Share Analysis (%), by Component – Software, 2026
Figure 75: ASEAN Smart Classroom Market Share Analysis (%), by Component – Services, 2018
Figure 76: ASEAN Smart Classroom Market Share Analysis (%), by Component – Services, 2026
Figure 77: ASEAN Smart Classroom Market Share Analysis (%), by End-use, 2018
Figure 78: ASEAN Smart Classroom Market Share Analysis (%), by End-use, 2026
Figure 79: ASEAN Smart Classroom Market Share Analysis (%), by Country, 2018
Figure 80: ASEAN Smart Classroom Market Share Analysis (%), by Country, 2026
Figure 81: Indonesia Smart Classroom Market Size (US$ Mn), Forecast, 2016 - 2026
Figure 82: Indonesia Smart Classroom Market Share Analysis (%), by Component, 2018
Figure 83: Indonesia Smart Classroom Market Share Analysis (%), by Component, 2026
Figure 84: Indonesia Smart Classroom Market Share Analysis (%), by Component– Hardware, 2018
Figure 85: Indonesia Smart Classroom Market Share Analysis (%), by Component– Hardware, 2026
Figure 86: Indonesia Smart Classroom Market Share Analysis (%), by Component – Software, 2018
Figure 87: Indonesia Smart Classroom Market Share Analysis (%), by Component – Software, 2026
Figure 88: Indonesia Smart Classroom Market Share Analysis (%), by Component – Services, 2018
Figure 89: Indonesia Smart Classroom Market Share Analysis (%), by Component – Services, 2026
Figure 90: Indonesia Smart Classroom Market Share Analysis (%), by End-use, 2018
Figure 91: Indonesia Smart Classroom Market Share Analysis (%), by End-use, 2026
Figure 92: Indonesia Smart Classroom Market Attractiveness Analysis, by Component
Figure 93: Indonesia Smart Classroom Market Attractiveness Analysis, by End-use
Figure 94: Thailand Smart Classroom Market Size (US$ Mn), Forecast, 2016 - 2026
Figure 95: Thailand Smart Classroom Market Share Analysis (%), by Component, 2018
Figure 96: Thailand Smart Classroom Market Share Analysis (%), by Component, 2026
Figure 97: Thailand Smart Classroom Market Share Analysis (%), by Component– Hardware, 2018
Figure 98: Thailand Smart Classroom Market Share Analysis (%), by Component– Hardware, 2026
Figure 99: Thailand Smart Classroom Market Share Analysis (%), by Component – Software, 2018
Figure 100: Thailand Smart Classroom Market Share Analysis (%), by Component – Software, 2026
Figure 101: Thailand Smart Classroom Market Share Analysis (%), by Component – Services, 2018
Figure 102: Thailand Smart Classroom Market Share Analysis (%), by Component – Services, 2026
Figure 103: Thailand Smart Classroom Market Share Analysis (%), by End-use, 2018
Figure 104: Thailand Smart Classroom Market Share Analysis (%), by End-use, 2026
Figure 105: Thailand Smart Classroom Market Attractiveness Analysis, by Component
Figure 106: Thailand Smart Classroom Market Attractiveness Analysis, by End-use
Figure 107: Malaysia Smart Classroom Market Size (US$ Mn), Forecast, 2016 - 2026
Figure 108: Malaysia Smart Classroom Market Share Analysis (%), by Component, 2018
Figure 109: Malaysia Smart Classroom Market Share Analysis (%), by Component, 2026
Figure 110: Malaysia Smart Classroom Market Share Analysis (%), by Component– Hardware, 2018
Figure 111: Malaysia Smart Classroom Market Share Analysis (%), by Component– Hardware, 2026
Figure 112: Malaysia Smart Classroom Market Share Analysis (%), by Component – Software, 2018
Figure 113: Malaysia Smart Classroom Market Share Analysis (%), by Component – Software, 2026
Figure 114: Malaysia Smart Classroom Market Share Analysis (%), by Component – Services, 2018
Figure 115: Malaysia Smart Classroom Market Share Analysis (%), by Component – Services, 2026
Figure 116: Malaysia Smart Classroom Market Share Analysis (%), by End-use, 2018
Figure 117: Malaysia Smart Classroom Market Share Analysis (%), by End-use, 2026
Figure 118: Malaysia Smart Classroom Market Attractiveness Analysis, by Component
Figure 119: Malaysia Smart Classroom Market Attractiveness Analysis, by End-use
Figure 120: Singapore Smart Classroom Market Size (US$ Mn), Forecast, 2016 - 2026
Figure 121: Singapore Smart Classroom Market Share Analysis (%), by Component, 2018
Figure 122: Singapore Smart Classroom Market Share Analysis (%), by Component, 2026
Figure 123: Singapore Smart Classroom Market Share Analysis (%), by Component– Hardware, 2018
Figure 124: Singapore Smart Classroom Market Share Analysis (%), by Component– Hardware, 2026
Figure 125: Singapore Smart Classroom Market Share Analysis (%), by Component – Software, 2018
Figure 126: Singapore Smart Classroom Market Share Analysis (%), by Component – Software, 2026
Figure 127: Singapore Smart Classroom Market Share Analysis (%), by Component – Services, 2018
Figure 128: Singapore Smart Classroom Market Share Analysis (%), by Component – Services, 2026
Figure 129: Singapore Smart Classroom Market Share Analysis (%), by End-use, 2018
Figure 130: Singapore Smart Classroom Market Share Analysis (%), by End-use, 2026
Figure 131: Singapore Smart Classroom Market Attractiveness Analysis, by Component
Figure 132: Singapore Smart Classroom Market Attractiveness Analysis, by End-use
Figure 133: Philippines Smart Classroom Market Size (US$ Mn), Forecast, 2016 - 2026
Figure 134: Philippines Smart Classroom Market Share Analysis (%), by Component, 2018
Figure 135: Philippines Smart Classroom Market Share Analysis (%), by Component, 2026
Figure 136: Philippines Smart Classroom Market Share Analysis (%), by Component– Hardware, 2018
Figure 137: Philippines Smart Classroom Market Share Analysis (%), by Component– Hardware, 2026
Figure 138: Philippines Smart Classroom Market Share Analysis (%), by Component – Software, 2018
Figure 139: Philippines Smart Classroom Market Share Analysis (%), by Component – Software, 2026
Figure 140: Philippines Smart Classroom Market Share Analysis (%), by Component – Services, 2018
Figure 141: Philippines Smart Classroom Market Share Analysis (%), by Component – Services, 2026
Figure 142: Philippines Smart Classroom Market Share Analysis (%), by End-use, 2018
Figure 143: Philippines Smart Classroom Market Share Analysis (%), by End-use, 2026
Figure 144: Philippines Smart Classroom Market Attractiveness Analysis, by Component
Figure 145: Philippines Smart Classroom Market Attractiveness Analysis, by End-use
Figure 146: Vietnam Smart Classroom Market Size (US$ Mn), Forecast, 2016 - 2026
Figure 147: Vietnam Smart Classroom Market Share Analysis (%), by Component, 2018
Figure 148: Vietnam Smart Classroom Market Share Analysis (%), by Component, 2026
Figure 149: Vietnam Smart Classroom Market Share Analysis (%), by Component– Hardware, 2018
Figure 150: Vietnam Smart Classroom Market Share Analysis (%), by Component– Hardware, 2026
Figure 151: Vietnam Smart Classroom Market Share Analysis (%), by Component – Software, 2018
Figure 152: Vietnam Smart Classroom Market Share Analysis (%), by Component – Software, 2026
Figure 153: Vietnam Smart Classroom Market Share Analysis (%), by Component – Services, 2018
Figure 154: Vietnam Smart Classroom Market Share Analysis (%), by Component – Services, 2026
Figure 155: Vietnam Smart Classroom Market Share Analysis (%), by End-use, 2018
Figure 156: Vietnam Smart Classroom Market Share Analysis (%), by End-use, 2026
Figure 157: Vietnam Smart Classroom Market Attractiveness Analysis, by Component
Figure 158: Vietnam Smart Classroom Market Attractiveness Analysis, by End-use
Figure 159: MEA Smart Classroom Market Size (US$ Mn), forecast, 2016 - 2026
Figure 160: MEA Smart Classroom Market Size (Thousand Units), forecast, 2016 - 2026
Figure 161: MEA Smart Classroom Market Share Analysis (%), by Component, 2018
Figure 162: MEA Smart Classroom Market Share Analysis (%), by Component, 2026
Figure 163: MEA Smart Classroom Market Share Analysis (%), by Component– Hardware, 2018
Figure 164: MEA Smart Classroom Market Share Analysis (%), by Component– Hardware, 2026
Figure 165: MEA Smart Classroom Market Share Analysis (%), by Component – Software, 2018
Figure 166: MEA Smart Classroom Market Share Analysis (%), by Component – Software, 2026
Figure 167: MEA Smart Classroom Market Share Analysis (%), by Component – Services, 2018
Figure 168: MEA Smart Classroom Market Share Analysis (%), by Component – Services, 2026
Figure 169: MEA Smart Classroom Market Share Analysis (%), by End-use, 2018
Figure 170: MEA Smart Classroom Market Share Analysis (%), by End-use, 2026
Figure 171: MEA Smart Classroom Market Share Analysis (%), by Country, 2018
Figure 172: MEA Smart Classroom Market Share Analysis (%), by Country, 2026
Figure 173: MEA Smart Classroom Market Attractiveness Analysis, by Component
Figure 174: MEA Smart Classroom Market Attractiveness Analysis, by End-use
Figure 175: MEA Smart Classroom Market Attractiveness Analysis, by Country
Figure 176: South America Smart Classroom Market Size (US$ Mn), forecast, 2016 - 2026
Figure 177: South America Smart Classroom Market Size (Thousand Units), forecast, 2016 - 2026
Figure 178: South America Smart Classroom Market Share Analysis (%), by Component, 2018
Figure 179: South America Smart Classroom Market Share Analysis (%), by Component, 2026
Figure 180: South America Smart Classroom Market Share Analysis (%), by Component– Hardware, 2018
Figure 181: South America Smart Classroom Market Share Analysis (%), by Component– Hardware, 2026
Figure 182: South America Smart Classroom Market Share Analysis (%), by Component – Software, 2018
Figure 183: South America Smart Classroom Market Share Analysis (%), by Component – Software, 2026
Figure 184: South America Smart Classroom Market Share Analysis (%), by Component – Services, 2018
Figure 185: South America Smart Classroom Market Share Analysis (%), by Component – Services, 2026
Figure 186: South America Smart Classroom Market Share Analysis (%), by End-use, 2018
Figure 187: South America Smart Classroom Market Share Analysis (%), by End-use, 2026
Figure 188: South America Smart Classroom Market Share Analysis (%), by Country, 2018
Figure 189: South America Smart Classroom Market Share Analysis (%), by Country, 2026
Figure 190: South America Smart Classroom Market Attractiveness Analysis, by Component
Figure 191: South America Smart Classroom Market Attractiveness Analysis, by End-use
Figure 192: South America Smart Classroom Market Attractiveness Analysis, by Country
Copyright © Transparency Market Research, Inc. All Rights reserved
Trust Online

Smart Classroom Market, Forecast 2018 - 2026