
Reports
Reports
Global Semiconductor Intellectual Property Market: Snapshot
The global semiconductor intellectual property market has numerous small and large players, currently. In order to tap into the rising demand for less expensive and highly reliable end-products with way more sophisticated features, many new players are foraying into the market. Meanwhile, well-entrenched players are scouting for suitable opportunities to acquire other IP companies to bolster their positions in the market.
An advantage of semiconductor intellectual property is that it enables manufacturers to design chips faster making use of existing blocks. Semiconductor intellectual property cores improve quality of devices and up efficiency of final product. Rising demand for reduced design and manufacturing costs, across the world have resulted in the growth of the semiconductor intellectual property market.
Serving to have a negative impact of the global semiconductor intellectual property market, on the flipside, is the detection of infringement of patented technologies. As a result, most companies in the market have changed their long-term licensing contracts to medium-term and short-term ones.
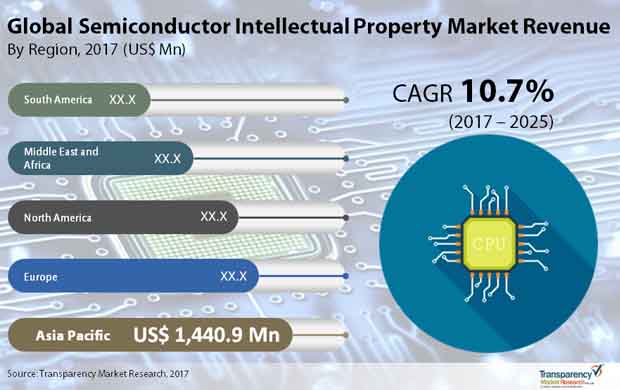
As per Transparency Market Research, the global market for semiconductor intellectual property will likely register a CAGR of 10.7% during the period between 2017 and 2025 to attain a value of US$9.1 bn by the end of 2025.
Use in Netlist and Synthesizable Cores Makes Soft IP Leading Segment
By type, the two key segments of the global market for semiconductor intellectual property are soft IP and hard IP. In 2016, the segment of soft IP accounted for a greater market share of 51.7%. The segment enjoys greater market share on account of the rising use of soft IP core such as netlist and synthesizable cores in a range of applications to improve the hardware quality.
The soft IP core segment is predicted to rise at a 13.1% CAGR from 2017 to 2025, owing to its ability to carry out testing in the virtual environment and optimize hardware components.
Based on application, the global market for semiconductor intellectual property can be classified into automotive, healthcare, telecommunications, consumer electronics, etc. Of these, the automotive segment is expected to clock maximum CAGR of 11.2% during the forecast period. This is linked to the rising demand of hard IP cores and soft IP cores in the automotive segment. In terms of market share, on the other hand, the consumer electronics segment led the way with a share of 10.9% in 2016.
Asia Pacific Propelled to Fore by Consumer Electronics Industry
From a geographical perspective, Asia Pacific dominated the market with a share of 32.4% in 2016. The market in the region has been boosted primarily by the booming consumer electronics industry which has upped demand for hard IP core such as analog IP, etc. Nations of India, China, and Japan, which are manufacturing hubs for consumer electronic products such as television, home appliances, etc. are said to be powering the market in Asia Pacific.
Europe is another key region in the global semiconductor intellectual property market, which is anticipated to clock a 10.9% CAGR during the period between 2017 and 2025. The market in Europe is being driven mainly by the countries of France, Germany, and the U.K. Two factors are responsible for driving impressive growth in the market in the region are progress in the semiconductor market and presence of prominent vendors focusing on development of semiconductor IP cores.
Some of the main players in the global semiconductor intellectual property market are Altera (acquired by Intel Corporation), Cadence Design Systems, Inc., Ceva Inc., Cast In., eSilicon Corporation, Kilopass Technology Inc., Imagination Technologies Limited, Mentor, Open-Silicon, Inc., Silabtech Private Limited, Synopsys Inc., and Videantis GmbH.
1. Preface
1.1. Market Definition and Scope
1.2. Market Segmentation
1.3. Key Research Objectives
2. Assumptions and Research Methodology
3. Executive Summary : Global Semiconductor Intellectual Property Market
4. Market Overview
4.1. Introduction
4.2. Key Industry Developments
4.3. Market Dynamics
4.3.1. Drivers
4.3.2. Restraints
4.3.3. Opportunities
4.4. Key Market Indicators
4.5. Trend analysis
4.5.1. Semiconductor Intellectual Property Market, By Architectural Design
4.5.1.1. By Customization
4.5.1.2. By Processor Design
4.5.2. Semiconductor Intellectual Property Market, By Form Factor
4.5.2.1. Integrated circuit IP
4.5.2.1.1. General Purpose IC IP
4.5.2.1.2. Application-Specific IC IP
4.5.2.1.3. Programmable IC IP
4.5.2.1.4. Digital IC IP
4.5.2.1.5. Analog & Mixed Signal IC IP
4.5.2.1.6. Memory IC
4.5.3. System on Chip (SOC) IP
4.6. Global Semiconductor Intellectual Property Market Analysis and Forecasts, (2016 – 2025)
4.6.1. Market Revenue Projections (US$ Mn)
4.7. Porter’s Five Forces Analysis
4.8. Ecosystem Analysis
4.9. Market Outlook
5. Global Semiconductor Intellectual Property Market Analysis and Forecasts, By Type
5.1. Key Findings
5.2. Definitions
5.3. Semiconductor Intellectual Property Market Size (US$ Mn) Forecast By Type, 2017-2025
5.3.1. Digital Semiconductor IP
5.3.2. Physical Semiconductor IP
5.3.3. Processor Semiconductor IP
5.4. Value Share Analysis By Type
5.5. Market Attractiveness By Type
6. Global Semiconductor Intellectual Property Market Analysis and Forecasts, By Architecture Design
6.1. Key Findings
6.2. Definitions
6.3. Semiconductor Intellectual Property Market Size (US$ Mn) Forecast By Architecture Design , 2017-2025
6.3.1. Hard IP cores
6.3.2. Soft IP cores
6.4. Value Share Analysis by Architecture Design
6.5. Market Attractiveness By Architecture Design
7. Global Semiconductor Intellectual Property Market Analysis and Forecasts, By Application
7.1. Key Findings
7.2. Definitions
7.3. Semiconductor Intellectual Property Market Size (US$ Mn) Forecast By Application, 2017-2025
7.3.1. Healthcare
7.3.2. IT & Telecom
7.3.3. Automotive
7.3.4. Consumer Electronics
7.3.5. Others
7.4. Value Share Analysis By Application
7.5. Market Attractiveness By Application
8. Global Semiconductor Intellectual Property Market Analysis and Forecasts, By Region
8.1. Key Findings
8.2. Semiconductor Intellectual Property Market Size (US$ Mn) Forecast By Region, 2017-2025
8.2.1. North America
8.2.2. Europe
8.2.3. Asia Pacific
8.2.4. Middle East and Africa
8.2.5. South America
8.3. Market Attractiveness By Region
9. North America Semiconductor Intellectual Property Market Analysis and Forecast
9.1. Key Findings
9.2. Key Trends
9.3. Semiconductor Intellectual Property Market Size (US$ Mn) Forecast By Type, 2017-2025
9.3.1. Digital Semiconductor IP
9.3.2. Physical Semiconductor IP
9.3.3. Processor Semiconductor IP
9.4. Semiconductor Intellectual Property Market Size (US$ Mn) Forecast By Architecture Design , 2017-2025
9.4.1. Hard IP cores
9.4.2. Soft IP cores
9.5. Semiconductor Intellectual Property Market Size (US$ Mn) Forecast By Application, 2017-2025
9.5.1. Healthcare
9.5.2. IT & Telecom
9.5.3. Automotive
9.5.4. Consumer Electronics
9.5.5. Others
9.6. Semiconductor Intellectual Property Market Size (US$ Mn) Forecast By Region , 2017-2025
9.6.1. The U.S.
9.6.2. Canada
9.6.3. Rest of North America
9.7. Market Attractiveness Analysis
9.7.1. By Type
9.7.2. By Architecture Design
9.7.3. By Application
9.7.4. By Country
10. Europe Semiconductor Intellectual Property Market Analysis and Forecast
10.1. Key Findings
10.2. Key Trends
10.3. Semiconductor Intellectual Property Market Size (US$ Mn) Forecast By Type, 2017-2025
10.3.1. Digital Semiconductor IP
10.3.2. Physical Semiconductor IP
10.3.3. Processor Semiconductor IP
10.4. Semiconductor Intellectual Property Market Size (US$ Mn) Forecast By Architecture Design , 2017-2025
10.4.1. Hard IP cores
10.4.2. Soft IP cores
10.5. Semiconductor Intellectual Property Market Size (US$ Mn) Forecast By Application, 2017-2025
10.5.1. Healthcare
10.5.2. IT & Telecom
10.5.3. Automotive
10.5.4. Consumer Electronics
10.5.5. Others
10.6. Semiconductor Intellectual Property Market Size (US$ Mn) Forecast By Country, 2017-2025
10.6.1. The U.K.
10.6.2. Germany
10.6.3. France
10.6.4. Rest of Europe
10.7. Market Attractiveness Analysis
10.7.1. By Type
10.7.2. By Architecture Design
10.7.3. By Application
10.7.4. By Country
11. Asia Pacific Semiconductor Intellectual Property Market Analysis and Forecast
11.1. Key Findings
11.2. Key Trends
11.3. Semiconductor Intellectual Property Market Size (US$ Mn) Forecast By Type, 2017-2025
11.3.1. Digital Semiconductor IP
11.3.2. Physical Semiconductor IP
11.3.3. Processor Semiconductor IP
11.4. Semiconductor Intellectual Property Market Size (US$ Mn) Forecast By Architecture Design , 2017-2025
11.4.1. Hard IP cores
11.4.2. Soft IP cores
11.5. Semiconductor Intellectual Property Market Size (US$ Mn) Forecast By Application, 2017-2025
11.5.1. Healthcare
11.5.2. IT & Telecom
11.5.3. Automotive
11.5.4. Consumer Electronics
11.5.5. Others
11.6. Semiconductor Intellectual Property Market Size (US$ Mn) Forecast By Country, 2017-2025
11.6.1. India
11.6.2. Japan
11.6.3. China
11.6.4. Rest of Asia Pacific
11.7. Market Attractiveness Analysis
11.7.1. By Type
11.7.2. By Architecture Design
11.7.3. By Application
11.7.4. By Country
12. Middle East and Africa (MEA) Semiconductor Intellectual Property Market Analysis and Forecast
12.1. Key Findings
12.2. Key Trends
12.3. Semiconductor Intellectual Property Market Size (US$ Mn) Forecast By Type, 2017-2025
12.3.1. Digital Semiconductor IP
12.3.2. Physical Semiconductor IP
12.3.3. Processor Semiconductor IP
12.4. Semiconductor Intellectual Property Market Size (US$ Mn) Forecast By Architecture Design , 2017-2025
12.4.1. Hard IP cores
12.4.2. Soft IP cores
12.5. Semiconductor Intellectual Property Market Size (US$ Mn) Forecast By Application, 2017-2025
12.5.1. Healthcare
12.5.2. IT & Telecom
12.5.3. Automotive
12.5.4. Consumer Electronics
12.5.5. Others
12.6. Semiconductor Intellectual Property Market Size (US$ Mn) Forecast By Region, 2017-2025
12.6.1. GCC countries
12.6.2. South Africa
12.6.3. Rest of MEA
12.7. Market Attractiveness Analysis
12.7.1. By Type
12.7.2. By Architecture Design
12.7.3. By Application
12.7.4. By Country
13. South America Semiconductor Intellectual Property Market Analysis and Forecast
13.1. Key Findings
13.2. Key Trends
13.3. Semiconductor Intellectual Property Market Size (US$ Mn) Forecast By Type, 2017-2025
13.3.1. Digital Semiconductor IP
13.3.2. Physical Semiconductor IP
13.3.3. Processor Semiconductor IP
13.4. Semiconductor Intellectual Property Market Size (US$ Mn) Forecast By Architecture Design , 2017-2025
13.4.1. Hard IP cores
13.4.2. Soft IP cores
13.5. Semiconductor Intellectual Property Market Size (US$ Mn) Forecast By Application, 2017-2025
13.5.1. Healthcare
13.5.2. IT & Telecom
13.5.3. Automotive
13.5.4. Consumer Electronics
13.5.5. Others
13.6. Semiconductor Intellectual Property Market Size (US$ Mn) Forecast By Country, 2017-2025
13.6.1. Brazil
13.6.2. Rest of South America
13.7. Market Attractiveness Analysis
13.7.1. By Type
13.7.2. By Architecture Design
13.7.3. By Application
13.7.4. By Country
14. Competition Landscape
14.1. Market Player – Competition Matrix
14.2. Market Share Analysis By Company (2016)
14.3. Company Profiles (Details – Overview, Financials, Strategy, and SWOT Analysis)
14.3.1. Altera (Intel Corporation)
14.3.1.1. Company Details and Description (HQ, Foundation Year, Revenue, Employee Strength)
14.3.1.2. Business Overview
14.3.1.3. Company Financials
14.3.1.4. SWOT Analysis
14.3.2. Arm Limited Company
14.3.2.1. Details and Description (HQ, Foundation Year, Revenue, Employee Strength)
14.3.2.2. Business Overview
14.3.2.3. Company Financials
14.3.2.4. SWOT Analysis
14.3.3. Cadence Design Systems, Inc.
14.3.3.1. Details and Description (HQ, Foundation Year, Revenue, Employee Strength)
14.3.3.2. Business Overview
14.3.3.3. Company Financials
14.3.3.4. SWOT Analysis
14.3.4. Cast Inc.
14.3.4.1. Details and Description (HQ, Foundation Year, Revenue, Employee Strength)
14.3.4.2. Business Overview
14.3.4.3. Company Financials
14.3.4.4. SWOT Analysis
14.3.5. Ceva Inc.
14.3.5.1. Details and Description (HQ, Foundation Year, Revenue, Employee Strength)
14.3.5.2. Business Overview
14.3.5.3. Company Financials
14.3.5.4. SWOT Analysis
14.3.6. eSilicon Corporation
14.3.6.1. Details and Description (HQ, Foundation Year, Revenue, Employee Strength)
14.3.6.2. Business Overview
14.3.6.3. Company Financials
14.3.6.4. SWOT Analysis
14.3.7. Imagination Technologies Limited
14.3.7.1. Details and Description (HQ, Foundation Year, Revenue, Employee Strength)
14.3.7.2. Business Overview
14.3.7.3. Company Financials
14.3.7.4. SWOT Analysis
14.3.8. Kilopass Technology Inc.
14.3.8.1. Details and Description (HQ, Foundation Year, Revenue, Employee Strength)
14.3.8.2. Business Overview
14.3.8.3. Company Financials
14.3.8.4. SWOT Analysis
14.3.9. Mentor, a Siemens Business
14.3.9.1. Details and Description (HQ, Foundation Year, Revenue, Employee Strength)
14.3.9.2. Business Overview
14.3.9.3. Company Financials
14.3.9.4. SWOT Analysis
14.3.10. Open-Silicon, Inc.
14.3.10.1. Details and Description (HQ, Foundation Year, Revenue, Employee Strength)
14.3.10.2. Business Overview
14.3.10.3. Company Financials
14.3.10.4. SWOT Analysis
14.3.11. Perceptia Devices Inc.
14.3.11.1. Details and Description (HQ, Foundation Year, Revenue, Employee Strength)
14.3.11.2. Business Overview
14.3.11.3. Company Financials
14.3.11.4. SWOT Analysis
14.3.12. Rambus Inc.
14.3.12.1. Details and Description (HQ, Foundation Year, Revenue, Employee Strength)
14.3.12.2. Business Overview
14.3.12.3. Company Financials
14.3.12.4. SWOT Analysis
14.3.13. Silabtech Private Limited
14.3.13.1. Details and Description (HQ, Foundation Year, Revenue, Employee Strength)
14.3.13.2. Business Overview
14.3.13.3. Company Financials
14.3.13.4. SWOT Analysis
14.3.14. Synopsys Inc.
14.3.14.1. Details and Description (HQ, Foundation Year, Revenue, Employee Strength)
14.3.14.2. Business Overview
14.3.14.3. Company Financials
14.3.14.4. SWOT Analysis
14.3.15. Videantis GmbH
14.3.15.1. Details and Description (HQ, Foundation Year, Revenue, Employee Strength)
14.3.15.2. Business Overview
14.3.15.3. Company Financials
14.3.15.4. SWOT Analysis
15. Key Takeaways
List of Tables
Table 1 Global Semiconductor Intellectual Property Market Size (US$ Mn) Forecast, By Type, 2015 – 2025
Table 2 Global Semiconductor Intellectual Property Market Size (US$ Mn) Forecast, By Architecture Design, 2015 – 2025
Table 3 Global Semiconductor Intellectual Property Market Size (US$ Mn) Forecast, By Application, 2015 – 2025
Table 4 Global Semiconductor Intellectual Property Market Size (US$ Mn) Forecast, By Region, 2015 – 2025
Table 5 North America Semiconductor Intellectual Property Market Size (US$ Mn) Forecast, By Type, 2015 – 2025
Table 6 North America Semiconductor Intellectual Property Market Size (US$ Mn) Forecast, By Architecture Design, 2015 – 2025
Table 7 North America Semiconductor Intellectual Property Market Size (US$ Mn) Forecast, By Application, 2015 – 2025
Table 8 North America Semiconductor Intellectual Property Market Size (US$ Mn) Forecast, By Country, 2015 – 2025
Table 9 Europe Semiconductor Intellectual Property Market Size (US$ Mn) Forecast, By Type, 2015 – 2025
Table 10 Europe Semiconductor Intellectual Property Market Size (US$ Mn) Forecast, By Architecture Design, 2015 – 2025
Table 11 Europe Semiconductor Intellectual Property Market Size (US$ Mn) Forecast, By Application, 2015 – 2025
Table 12 Europe Semiconductor Intellectual Property Market Size (US$ Mn) Forecast, By Country, 2015 – 2025
Table 13 Asia-Pacific Semiconductor Intellectual Property Market Size (US$ Mn) Forecast, By Type, 2015 – 2025
Table 14 Asia-Pacific Semiconductor Intellectual Property Market Size (US$ Mn) Forecast, By Architecture Design, 2015 – 2025
Table 15 Asia-Pacific Semiconductor Intellectual Property Market Size (US$ Mn) Forecast, By Application, 2015 – 2025
Table 16 Asia-Pacific Semiconductor Intellectual Property Market Size (US$ Mn) Forecast, By Country, 2015 – 2025
Table 17 Middle East and Africa Semiconductor Intellectual Property Market Size (US$ Mn) Forecast, By Type, 2015 – 2025
Table 18 Middle East and Africa Semiconductor Intellectual Property Market Size (US$ Mn) Forecast, By Architecture Design, 2015 – 2025
Table 19 Middle East and Africa Semiconductor Intellectual Property Market Size (US$ Mn) Forecast, By Application, 2015 – 2025
Table 20 Middle East and Africa Semiconductor Intellectual Property Market Size (US$ Mn) Forecast, By Country, 2015 – 2025
Table 21 South America Semiconductor Intellectual Property Market Size (US$ Mn) Forecast, By Type, 2015 – 2025
Table 22 South America Semiconductor Intellectual Property Market Size (US$ Mn) Forecast, By Architecture Design, 2015 – 2025
Table 23 South America Semiconductor Intellectual Property Market Size (US$ Mn) Forecast, By Application, 2015 – 2025
Table 24 South America Semiconductor Intellectual Property Market Size (US$ Mn) Forecast, By Country, 2015 – 2025
Table 25 Business Segment Revenue, Arm Limited
Table 26 Business Segment Revenue, Cadence Design Systems, Inc
Table 27 Business Segment Revenue, CEVA, Inc
Table 28 Business Segment Revenue Imagination Technologies Limited
Table 29 Business Segment Revenue Rambus Inc.
Table 30 Business Segment Revenue Synopsys, Inc.
List of Figures
Figure 1 Calculation of the Global Semiconductor Intellectual Property Market
Figure 2 Global Semiconductor Intellectual Property Market
Figure 3 Global Semiconductor Intellectual Property Market, By Type, 2016
Figure 4 Global Semiconductor Intellectual Property Market Share, By Architecture Design, 2016
Figure 5 Global Semiconductor Intellectual Property Market, Key Industry Developments
Figure 6 Global Semiconductor Intellectual Property Market, 2025 Revenue (US$ Mn) Forecast, 2015 – 2025
Figure 7 Global Semiconductor Intellectual Property Market, Y-o-Y Growth (Value %) Forecast, 2015 – 2025
Figure 8 Global Semiconductor Intellectual Property Market, Porter’s Five Force Analysis
Figure 9 Ecosystem Analysis, Semiconductor Intellectual Property Market
Figure 10 Market Value Share, By Type (2016)
Figure 11 Market Value Share, By Architecture Design (2016)
Figure 12 Market Value Share, By Application (2016)
Figure 13 Market Value Share, By Region (2016)
Figure 14 Global Semiconductor Intellectual Property Market, By Digital IP, Y-o-Y Growth (Value %) Forecast, 2015 – 2025
Figure 15 Global Semiconductor Intellectual Property Market, By Physical IP, Y-o-Y Growth (Value %) Forecast, 2015 – 2025
Figure 16 Global Semiconductor Intellectual Property Market, By Processor IP, Y-o-Y Growth (Value %) Forecast, 2015 – 2025
Figure 17 Global Semiconductor Intellectual Property Market Value Share Analysis, By Type, 2017 and 2025
Figure 18 Global Semiconductor Intellectual Property Market Attractiveness Analysis, By Type
Figure 19 Global Semiconductor Intellectual Property Market, By Hard IP, Y-o-Y Growth (Value %) Forecast, 2015 – 2025
Figure 20 Global Semiconductor Intellectual Property Market, By Soft IP, Y-o-Y Growth (Value %) Forecast, 2015 – 2025
Figure 21 Global Semiconductor Intellectual Property Market Value Share Analysis, By Architecture Design, 2017 and 2025
Figure 22 Global Semiconductor Intellectual Property Market Attractiveness Analysis, By Architecture Design
Figure 23 Global Semiconductor Intellectual Property Market Value Share Analysis, By Application, 2017 and 2025
Figure 24 Global Semiconductor Intellectual Property Market, By Healthcare, Y-o-Y Growth (Value %) Forecast, 2015 – 2025
Figure 25 Global Semiconductor Intellectual Property Market, By Telecommunications, Y-o-Y Growth (Value %) Forecast, 2015 – 2025
Figure 26 Global Semiconductor Intellectual Property Market, By Automotive, Y-o-Y Growth (Value %) Forecast, 2015 – 2025
Figure 27 Global Semiconductor Intellectual Property Market, By Consumer Electronics, Y-o-Y Growth (Value %) Forecast, 2015 – 2025
Figure 28 Global Semiconductor Intellectual Property Market, By Others, Y-o-Y Growth (Value %) Forecast, 2015 – 2025
Figure 29 Global Semiconductor Intellectual Property Market Attractiveness Analysis, By Application
Figure 30 Semiconductor Intellectual Property Market CAGR (2017 – 2025) Analysis, By Country
Figure 31 Rest of APAC Semiconductor Intellectual Property Market, Y-o-Y Growth (Value %) Forecast, 2015 – 2025
Figure 32 Semiconductor Intellectual Property Market Attractiveness Analysis, By Region
Figure 33 The U.S. Semiconductor Intellectual Property Market, Y-o-Y Growth (Value %) Forecast, 2015 – 2025
Figure 34 Canada Semiconductor Intellectual Property Market, Y-o-Y Growth (Value %) Forecast, 2015 – 2025
Figure 35 Rest of North America Semiconductor Intellectual Property Market, Y-o-Y Growth (Value %) Forecast, 2015 – 2025
Figure 36 North America Semiconductor Intellectual Property Market Attractiveness Analysis, By Type
Figure 37 North America Semiconductor Intellectual Property Market Attractiveness Analysis, By Architecture Design
Figure 38 North America Semiconductor Intellectual Property Market Attractiveness Analysis, By Application
Figure 39 North America Semiconductor Intellectual Property Market Attractiveness Analysis, By Country
Figure 40 The U.K. Semiconductor Intellectual Property Market, Y-o-Y Growth (Value %) Forecast, 2015 – 2025
Figure 41 Germany Semiconductor Intellectual Property Market, Y-o-Y Growth (Value %) Forecast, 2015 – 2025
Figure 42 France Semiconductor Intellectual Property Market, Y-o-Y Growth (Value %) Forecast, 2015 – 2025
Figure 43 Rest of Europe Semiconductor Intellectual Property Market, Y-o-Y Growth (Value %) Forecast, 2015 – 2025
Figure 44 Europe Semiconductor Intellectual Property Market Attractiveness Analysis, By Type
Figure 45 Europe Semiconductor Intellectual Property Market Attractiveness Analysis, By Architecture Design
Figure 46 Europe Semiconductor Intellectual Property Market Attractiveness Analysis, By Application
Figure 47 Europe Semiconductor Intellectual Property Market Attractiveness Analysis, By Country
Figure 48 India Semiconductor Intellectual Property Market, Y-o-Y Growth (Value %) Forecast, 2015 – 2025
Figure 49 China Semiconductor Intellectual Property Market, Y-o-Y Growth (Value %) Forecast, 2015 – 2025
Figure 50 Japan Semiconductor Intellectual Property Market, Y-o-Y Growth (Value %) Forecast, 2015 – 2025
Figure 51 Rest of APAC Semiconductor Intellectual Property Market, Y-o-Y Growth (Value %) Forecast, 2015 – 2025
Figure 52 Asia-Pacific Semiconductor Intellectual Property Market Attractiveness Analysis, By Type
Figure 53 Asia-Pacific Semiconductor Intellectual Property Market Attractiveness Analysis, By Architecture Design
Figure 54 Asia-Pacific Semiconductor Intellectual Property Market Attractiveness Analysis, By Application
Figure 55 Asia-Pacific Semiconductor Intellectual Property Market Attractiveness Analysis, By Country
Figure 56 GCC countries Semiconductor Intellectual Property Market, Y-o-Y Growth (Value %) Forecast, 2015 – 2025
Figure 57 South Africa Semiconductor Intellectual Property Market, Y-o-Y Growth (Value %) Forecast, 2015 – 2025
Figure 58 Rest of MEA Semiconductor Intellectual Property Market, Y-o-Y Growth (Value %) Forecast, 2015 – 2025
Figure 59 Middle East and Africa Semiconductor Intellectual Property Market Attractiveness Analysis, By Type
Figure 60 Middle East and Africa Semiconductor Intellectual Property Market Attractiveness Analysis, By Architecture Design
Figure 61 Middle East and Africa Semiconductor Intellectual Property Market Attractiveness Analysis, By Application
Figure 62 Middle East and Africa Semiconductor Intellectual Property Market Attractiveness Analysis, By Country
Figure 63 Brazil Semiconductor Intellectual Property Market, Y-o-Y Growth (Value %) Forecast, 2015 – 2025
Figure 64 Rest of South Africa Semiconductor Intellectual Property Market, Y-o-Y Growth (Value %) Forecast, 2015 – 2025
Figure 65 South America Semiconductor Intellectual Property Market Attractiveness Analysis, By Type
Figure 66 South America Semiconductor Intellectual Property Market Attractiveness Analysis, By Architecture Design
Figure 67 South America Semiconductor Intellectual Property Market Attractiveness Analysis, By Application
Figure 68 South America Semiconductor Intellectual Property Market Attractiveness Analysis, By Country
Figure 69 Altera (Intel Corporation) Revenue (US$ Mn) & Y-o-Y Growth (%), 2014–2016
Figure 70 Altera (Intel Corporation), Breakdown of Net Sales, by Geography, 2016
Figure 71 Arm Limited, Revenue (US$ Mn) & Y-o-Y Growth (%), 2013–2015
Figure 72 Arm Limited, Breakdown of Net Sales, by Geography, 2015
Figure 73 Cadence Design Systems, Inc., Revenue (US$ Mn) & Y-o-Y Growth (%), 2014–2016,
Figure 74 Cadence Design Systems, Inc. Breakdown of Net Sales, by Geography, 2016
Figure 75 CEVA, Inc., Revenue (US$ Mn) & Y-o-Y Growth (%), 2014–2016,
Figure 76 CEVA, Inc. Breakdown of Net Sales, by Geography, 2016
Figure 77 Imagination Technologies Limited, Revenue (US$ Mn) & Y-o-Y Growth (%), 2014–2016,
Figure 78 Imagination Technologies Limited Breakdown of Net Sales, by Geography, 2016
Figure 79 Mentor, a Siemens Business, Revenue (US$ Mn) & Y-o-Y Growth (%), 2014–2016
Figure 80 Mentor, a Siemens Business Breakdown of Net Sales, by Geography, 2016
Figure 81 Rambus Inc., Revenue (US$ Mn) & Y-o-Y Growth (%), 2014–2016,
Figure 82 Rambus Inc., Breakdown of Net Sales, by Geography, 2016
Figure 83 Synopsys, Inc., Revenue (US$ Mn) & Y-o-Y Growth (%), 2014–2016,
Figure 84 Synopsys, Inc., Breakdown of Net Sales, by Geography, 2016
Copyright © Transparency Market Research, Inc. All Rights reserved
Trust Online

Semiconductor Intellectual Property Market