
Reports
Reports
The global SAP digital services ecosystem market was valued at US$ 75.87 Bn in 2018 and is anticipated to expand at a stable CAGR of 7.9% during the forecast period, according to a new research report published by Transparency Market Research (TMR), titled ‘SAP Digital Services Ecosystem Market – Global Industry Analysis, Size, Share, Growth, Trends, and Forecast, 2019–2027.’ Advantages offered by SAP digital services, increased adoption of ERP solutions among small and medium enterprises (SMEs), and rise in the adoption of SAP digital services in developing economies are prominent factors driving the global SAP digital services ecosystem market. The market in Asia Pacific is likely to expand at a rapid CAGR of 8.6% during the forecast period.
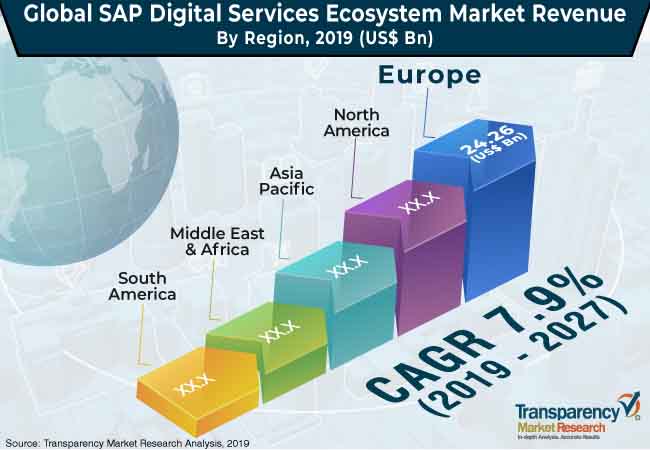
Adoption of SAP digital services is prominent in Europe and North America, while Asia Pacific is anticipated to witness significant growth in the adoption during the forecast period. Moreover, high penetration of cloud based SAP services in major countries of Europe and North America is a major factor driving the market in these countries. Migration toward digital platforms and increasing deployment of SAP S/4HANA are fueling the adoption of cloud database, which is expected to gain traction during the forecast period. Furthermore, adoption of SAP digital services, particularly in human resource management and sales and marketing management, is anticipated to increase during the forecast period. However, high cost associated with the deployment of these services is anticipated to be a restraint of the market in the near future. Still, the impact of cost of solutions and services is anticipated to be significantly low in the next few years, owing to expansion of the SAP partner ecosystem, wherein SAP is focusing on partnering with system implementation partners as well as solution users to deliver extended services ranging from implementation to maintenance.
Accenture, IBM, Deloitte, Capgemini, Tata Consultancy Services Limited, DXC Technology Company, Atos SE, and T-Systems International GmbH, Solutions likely to continue to lead the global SAP digital services ecosystem market
The profiling of top SAP partners, based of revenue generated from SAP services, operating in the global SAP digital services ecosystem market includes key financials, SAP generated revenue, SAP certified employees, SAP partner level, SAP partner engagement type, and headquarters for 2017. Key players operating in the global SAP digital services ecosystem market and profiled in the report are Accenture, International Business Machines Corporation, Deloitte Touche Tohmatsu Limited, Capgemini, Tata Consultancy Services Limited, DXC Technology Company, Infosys Limited, Atos SE, T-Systems International GmbH, Wipro Limited, Cognizant Technology Solutions, Hitachi Systems, Ltd., Itelligence AG, HCL Technologies Limited, NTT DATA, PwC (Pricewaterhousecoopers Llp), Tech Mahindra Limited, All for One Steeb AG, Seidor, OpenText Corp., Allgeier ES, CGI Inc., Birlasoft Limited (KPIT and Subsidiaries), Cisco Systems, Inc. (AppDynamics), FUJITSU LIMITED, ABeam Consulting Ltd., Larsen & Toubro Infotech Ltd, Neoris, EPAM Systems, Inc., SNP SE, Systex Corporation, Cenit AG, SOA PEOPLE SAS, The Hackett Group d/b/a Answerthink, Inc., VIEWNEXT SA, Zensar Technologies Ltd., Ctac N.V., ICM.S S.r.l., CIDEON Software & Services GmbH & Co.KG, OSIsoft Inc., Origo, Pearl Norge AS, Augusta Reeves, Utopia Global Inc., IPS Co., Ltd., Backoffice Associates Llc, AgilityWorks Limited, Advanced Applications GmbH, Computer Systems Integration Ltd., 2BM A/S, Implema AB, APPLIUM SAS, Beijing Neusoft Huiju Information Solution Type Co., Ltd., Excellence Delivered ExD Pvt. Ltd, and Vistex, Inc.
1. Preface
1.1. Market Definition and Scope
1.2. Market Segmentation
1.3. Key Research Objectives
1.4. Research Highlights
2. Assumptions and Research Methodology
3. Executive Summary: Global SAP Digital Services Ecosystem Market
4. Market Overview
4.1. Introduction
4.2. SAP Partner Type and Partner Engagement Type
4.3. Global SAP Digital Services Ecosystem Market Analysis and Forecast, 2017–2027
4.3.1. Market Revenue Projection (US$ Bn)
5. Global SAP Digital Services Ecosystem Market Analysis and Forecast, by Solution Type
5.1. Global SAP Digital Services Ecosystem Market Revenue (US$ Bn) Forecast, by Solution Type, 2017–2027
5.1.1. ERP
5.1.2. CRM
5.1.3. Others
5.2. Global SAP Digital Services Ecosystem Market Attractiveness, by Solution Type
6. Global SAP Digital Services Ecosystem Market Analysis and Forecast, by End-use Industry, by Solution Type
6.1. Global SAP Digital Services Ecosystem Market Revenue (US$ Bn) Forecast, by End-use Industry, by Solution Type, 2017–2027
6.1.1. IT & Telecommunication
6.1.1.1. ERP
6.1.1.2. CRM
6.1.1.3. Others
6.1.2. Aerospace & Defense
6.1.2.1. ERP
6.1.2.2. CRM
6.1.2.3. Others
6.1.3. Manufacturing
6.1.3.1. ERP
6.1.3.2. CRM
6.1.3.3. Others
6.1.4. Oil & Gas
6.1.4.1. ERP
6.1.4.2. CRM
6.1.4.3. Others
6.1.5. Energy & Utility
6.1.5.1. ERP
6.1.5.2. CRM
6.1.5.3. Others
6.1.6. BFSI
6.1.6.1. ERP
6.1.6.2. CRM
6.1.6.3. Others
6.1.7. Healthcare
6.1.7.1. ERP
6.1.7.2. CRM
6.1.7.3. Others
6.1.8. Others
6.1.8.1. ERP
6.1.8.2. CRM
6.1.8.3. Others
6.2. Global SAP Digital Services Ecosystem Market Attractiveness, by End-use Industry
7. Global SAP Digital Services Ecosystem Market Analysis and Forecast, by Region
7.1. Global SAP Digital Services Ecosystem Market Revenue (US$ Bn) Forecast, by Region, 2017–2027
7.1.1. North America
7.1.2. Europe
7.1.3. Asia Pacific
7.1.4. Middle East & Africa
7.1.5. South America
7.2. Global SAP Digital Services Ecosystem Market Attractiveness, by Region
8. North America SAP Digital Services Ecosystem Market Analysis and Forecast
8.1. North America SAP Digital Services Ecosystem Market Revenue (US$ Bn) Forecast, by Solution Type, 2017–2027
8.1.1. ERP
8.1.2. CRM
8.1.3. Others
8.2. North America SAP Digital Services Ecosystem Market Revenue (US$ Bn) Forecast, by End-use Industry, by Solution Type, 2017–2027
8.2.1. IT & Telecommunication
8.2.1.1. ERP
8.2.1.2. CRM
8.2.1.3. Others
8.2.2. Aerospace & Defense
8.2.2.1. ERP
8.2.2.2. CRM
8.2.2.3. Others
8.2.3. Manufacturing
8.2.3.1. ERP
8.2.3.2. CRM
8.2.3.3. Others
8.2.4. Oil & Gas
8.2.4.1. ERP
8.2.4.2. CRM
8.2.4.3. Others
8.2.5. Energy & Utility
8.2.5.1. ERP
8.2.5.2. CRM
8.2.5.3. Others
8.2.6. BFSI
8.2.6.1. ERP
8.2.6.2. CRM
8.2.6.3. Others
8.2.7. Healthcare
8.2.7.1. ERP
8.2.7.2. CRM
8.2.7.3. Others
8.2.8. Others
8.2.8.1. ERP
8.2.8.2. CRM
8.2.8.3. Others
8.3. North America SAP Digital Services Ecosystem Market Revenue (US$ Bn) Forecast, by Country/Sub-region, 2017–2027
8.3.1. The U.S.
8.3.2. Canada
8.3.3. Rest of North America
8.4. North America SAP Digital Services Ecosystem Market Attractiveness Analysis
8.4.1. By Solution Type
8.4.2. By End-use Industry
8.4.3. By Country/Sub-region
9. Europe SAP Digital Services Ecosystem Market Analysis and Forecast
9.1. Europe SAP Digital Services Ecosystem Market Revenue (US$ Bn) Forecast, by Solution Type, 2017–2027
9.1.1. ERP
9.1.2. CRM
9.1.3. Others
9.2. Europe SAP Digital Services Ecosystem Market Revenue (US$ Bn) Forecast, by End-use Industry, by Solution Type, 2017–2027
9.2.1. IT & Telecommunication
9.2.1.1. ERP
9.2.1.2. CRM
9.2.1.3. Others
9.2.2. Aerospace & Defense
9.2.2.1. ERP
9.2.2.2. CRM
9.2.2.3. Others
9.2.3. Manufacturing
9.2.3.1. ERP
9.2.3.2. CRM
9.2.3.3. Others
9.2.4. Oil & Gas
9.2.4.1. ERP
9.2.4.2. CRM
9.2.4.3. Others
9.2.5. Energy & Utility
9.2.5.1. ERP
9.2.5.2. CRM
9.2.5.3. Others
9.2.6. BFSI
9.2.6.1. ERP
9.2.6.2. CRM
9.2.6.3. Others
9.2.7. Healthcare
9.2.7.1. ERP
9.2.7.2. CRM
9.2.7.3. Others
9.2.8. Others
9.2.8.1. ERP
9.2.8.2. CRM
9.2.8.3. Others
9.3. Europe SAP Digital Services Ecosystem Market Revenue (US$ Bn) Forecast, by Country/Sub-region, 2017–2027
9.3.1. Germany
9.3.2. U.K.
9.3.3. France
9.3.4. Rest of Europe
9.4. Europe SAP Digital Services Ecosystem Market Attractiveness Analysis
9.4.1. By Solution Type
9.4.2. By End-use Industry
9.4.3. By Country/Sub-region
10. Asia Pacific SAP Digital Services Ecosystem Market Analysis and Forecast
10.1. Asia Pacific SAP Digital Services Ecosystem Market Revenue (US$ Bn) Forecast, by Solution Type, 2017–2027
10.1.1. ERP
10.1.2. CRM
10.1.3. Others
10.2. Asia Pacific SAP Digital Services Ecosystem Market Revenue (US$ Bn) Forecast, by End-use Industry, by Solution Type, 2017–2027
10.2.1. IT & Telecommunication
10.2.1.1. ERP
10.2.1.2. CRM
10.2.1.3. Others
10.2.2. Aerospace & Defense
10.2.2.1. ERP
10.2.2.2. CRM
10.2.2.3. Others
10.2.3. Manufacturing
10.2.3.1. ERP
10.2.3.2. CRM
10.2.3.3. Others
10.2.4. Oil & Gas
10.2.4.1. ERP
10.2.4.2. CRM
10.2.4.3. Others
10.2.5. Energy & Utility
10.2.5.1. ERP
10.2.5.2. CRM
10.2.5.3. Others
10.2.6. BFSI
10.2.6.1. ERP
10.2.6.2. CRM
10.2.6.3. Others
10.2.7. Healthcare
10.2.7.1. ERP
10.2.7.2. CRM
10.2.7.3. Others
10.2.8. Others
10.2.8.1. ERP
10.2.8.2. CRM
10.2.8.3. Others
10.3. Asia Pacific SAP Digital Services Ecosystem Market Revenue (US$ Bn) Forecast, by Country/Sub-region, 2017–2027
10.3.1. China
10.3.2. Japan
10.3.3. India
10.3.4. Rest of Asia Pacific
10.4. Asia Pacific SAP Digital Services Ecosystem Market Attractiveness Analysis
10.4.1. By Solution Type
10.4.2. By End-use Industry
10.4.3. By Country/Sub-region
11. Middle East & Africa SAP Digital Services Ecosystem Market Analysis and Forecast
11.1. Middle East & Africa SAP Digital Services Ecosystem Market Revenue (US$ Bn) Forecast, by Solution Type, 2017–2027
11.1.1. ERP
11.1.2. CRM
11.1.3. Others
11.2. Middle East & Africa SAP Digital Services Ecosystem Market Revenue (US$ Bn) Forecast, by End-use Industry, by Solution Type, 2017–2027
11.2.1. IT & Telecommunication
11.2.1.1. ERP
11.2.1.2. CRM
11.2.1.3. Others
11.2.2. Aerospace & Defense
11.2.2.1. ERP
11.2.2.2. CRM
11.2.2.3. Others
11.2.3. Manufacturing
11.2.3.1. ERP
11.2.3.2. CRM
11.2.3.3. Others
11.2.4. Oil & Gas
11.2.4.1. ERP
11.2.4.2. CRM
11.2.4.3. Others
11.2.5. Energy & Utility
11.2.5.1. ERP
11.2.5.2. CRM
11.2.5.3. Others
11.2.6. BFSI
11.2.6.1. ERP
11.2.6.2. CRM
11.2.6.3. Others
11.2.7. Healthcare
11.2.7.1. ERP
11.2.7.2. CRM
11.2.7.3. Others
11.2.8. Others
11.2.8.1. ERP
11.2.8.2. CRM
11.2.8.3. Others
11.3. Middle East & Africa SAP Digital Services Ecosystem Market Revenue (US$ Bn) Forecast, by Country/Sub-region, 2017–2027
11.3.1. GCC
11.3.2. South Africa
11.3.3. Rest of Middle East & Africa
11.4. Middle East & Africa SAP Digital Services Ecosystem Market Attractiveness Analysis
11.4.1. By Solution Type
11.4.2. By End-use Industry
11.4.3. By Country/Sub-region
12. South America SAP Digital Services Ecosystem Market Analysis and Forecast
12.1. South America SAP Digital Services Ecosystem Market Revenue (US$ Bn) Forecast, by Solution Type, 2017–2027
12.1.1. ERP
12.1.2. CRM
12.1.3. Others
12.2. South America SAP Digital Services Ecosystem Market Revenue (US$ Bn) Forecast, by End-use Industry, by Solution Type, 2017–2027
12.2.1. IT & Telecommunication
12.2.1.1. ERP
12.2.1.2. CRM
12.2.1.3. Others
12.2.2. Aerospace & Defense
12.2.2.1. ERP
12.2.2.2. CRM
12.2.2.3. Others
12.2.3. Manufacturing
12.2.3.1. ERP
12.2.3.2. CRM
12.2.3.3. Others
12.2.4. Oil & Gas
12.2.4.1. ERP
12.2.4.2. CRM
12.2.4.3. Others
12.2.5. Energy & Utility
12.2.5.1. ERP
12.2.5.2. CRM
12.2.5.3. Others
12.2.6. BFSI
12.2.6.1. ERP
12.2.6.2. CRM
12.2.6.3. Others
12.2.7. Healthcare
12.2.7.1. ERP
12.2.7.2. CRM
12.2.7.3. Others
12.2.8. Others
12.2.8.1. ERP
12.2.8.2. CRM
12.2.8.3. Others
12.3. South America SAP Digital Services Ecosystem Market Revenue (US$ Bn) Forecast, by Country/Sub-region, 2017–2027
12.3.1. Brazil
12.3.2. Rest of South America
12.4. South America SAP Digital Services Ecosystem Market Attractiveness Analysis
12.4.1. By Solution Type
12.4.2. By End-use Industry
12.4.3. By Country/Sub-region
13. Competition Landscape
13.1. Global SAP Digital Services Ecosystem Market Share Analysis, by Company (2017)
13.2. Company Profiles (Details – Overview, Financials, SWOT Analysis, Strategy)
13.2.1. Accenture
13.2.2. International Business Machines Corporation
13.2.3. Deloitte Touche Tohmatsu Limited
13.2.4. Capgemini
13.2.5. Tata Consultancy Services Limited
13.2.6. DXC Technology Company
13.2.7. Infosys Limited
13.2.8. Atos SE
13.2.9. T-Systems International GmbH
13.2.10. Wipro Limited
13.2.11. Cognizant Technology Solutions
13.2.12. Hitachi Systems, Ltd.
13.2.13. Itelligence AG
13.2.14. HCL Technologies Limited
13.2.15. NTT DATA
13.2.16. PwC (Pricewaterhousecoopers Llp)
13.2.17. Tech Mahindra Limited
13.2.18. All for One Steeb AG
13.2.19. Seidor
13.2.20. OpenText Corp.
13.2.21. Allgeier ES
13.2.22. CGI Inc.
13.2.23. Birlasoft Limited (KPIT and Subsidiaries)
13.2.24. Cisco Systems, Inc. (AppDynamics)
13.2.25. FUJITSU LIMITED
13.2.26. ABeam Consulting Ltd.
13.2.27. Larsen & Toubro Infotech Ltd
13.2.28. Neoris
13.2.29. EPAM Systems, Inc.
13.2.30. SNP SE
13.2.31. Systex Corporation
13.2.32. Cenit AG
13.2.33. SOA PEOPLE SAS
13.2.34. The Hackett Group d/b/a Answerthink, Inc.
13.2.35. VIEWNEXT SA
13.2.36. Zensar Technologies Ltd.
13.2.37. Ctac N.V.
13.2.38. ICM.S S.r.l.
13.2.39. CIDEON Software & Services GmbH & Co.KG
13.2.40. OSIsoft Inc.
13.2.41. Origo
13.2.42. Pearl Norge AS
13.2.43. Augusta Reeves
13.2.44. Utopia Global Inc.
13.2.45. IPS Co., Ltd.
13.2.46. Backoffice Associates Llc
13.2.47. AgilityWorks Limited
13.2.48. Advanced Applications GmbH
13.2.49. Computer Systems Integration Ltd.
13.2.50. 2BM A/S
13.2.51. Implema AB
13.2.52. APPLIUM SAS
13.2.53. Beijing Neusoft Huiju Information Solution Type Co., Ltd.
13.2.54. Excellence Delivered ExD Pvt. Ltd
13.2.55. Vistex, Inc.
14. Key Takeaways
List of Tables:
Table 01: Global SAP Digital Services Ecosystem Size (US$ Mn) Forecast, By Solution Type, 2017–2027
Table 02: Global SAP Digital Services Ecosystem Market Revenue (US$ Bn) Forecast, By Industry, By Solution Type (IT and Telecommunication, and Aerospace & Defense), 2017–2027
Table 03: Global SAP Digital Services Ecosystem Market Revenue (US$ Bn) Forecast, By Industry, By Solution Type (Manufacturing, and Oil & Gas), 2017–2027
Table 04: Global SAP Digital Services Ecosystem Market Revenue (US$ Bn) Forecast, By Industry, By Solution Type (Energy and Utility, and BFSI), 2017–2027
Table 05: Global SAP Digital Services Ecosystem Market Revenue (US$ Bn) Forecast, By Industry, By Solution Type (Healthcare, and Others), 2017–2027
Table 06: Global SAP Digital Services Ecosystem Market Revenue (US$ Bn) Forecast, By Region 2017–2027
Table 07: North America SAP Digital Services Ecosystem Market Revenue (US$ Bn) Forecast, By Solution Type, 2017–2027
Table 08: North America SAP Digital Services Ecosystem Market Revenue (US$ Bn) Forecast, by End-use Industry, by Solution Type (IT and Telecommunication, and Aerospace & Defense), 2017–2027
Table 09: North America SAP Digital Services Ecosystem Market Revenue (US$ Bn) Forecast, by End-use Industry, by Solution Type (Manufacturing, and Oil & Gas), 2017–2027
Table 10: North America SAP Digital Services Ecosystem Market Revenue (US$ Bn) Forecast, by End-use Industry, by Solution Type (Energy and Utility, and BFSI), 2017–2027
Table 11: North America SAP Digital Services Ecosystem Market Revenue (US$ Bn) Forecast, by End-use Industry, by Solution Type (Healthcare, and Others), 2017–2027
Table 12: North America SAP Digital Services Ecosystem Market Revenue (US$ Bn) Forecast, By Country 2017–2027
Table 13: Europe SAP Digital Services Ecosystem Market Revenue (US$ Bn) Forecast, By Solution Type, 2017–2027
Table 14: Europe SAP Digital Services Ecosystem Market Revenue (US$ Bn) Forecast, By Industry, By Solution Type (IT and Telecommunication, and Aerospace & Defense), 2017–2027
Table 15: Europe SAP Digital Services Ecosystem Market Revenue (US$ Bn) Forecast, By Industry, By Solution Type (Manufacturing, and Oil & Gas), 2017–2027
Table 16: Europe SAP Digital Services Ecosystem Market Revenue (US$ Bn) Forecast, By Industry, By Solution Type (Energy and Utility, and BFSI), 2017–2027
Table 17: Europe SAP Digital Services Ecosystem Market Revenue (US$ Bn) Forecast, By Industry, By Solution Type (Healthcare, and Others), 2017–2027
Table 18: Europe SAP Digital Services Ecosystem Market Revenue (US$ Bn) Forecast, By Country 2017–2027
Table 19: Asia Pacific SAP Digital Services Ecosystem Market Revenue (US$ Bn) Forecast, By Solution Type, 2017–2027
Table 20: Asia Pacific SAP Digital Services Ecosystem Market Revenue (US$ Bn) Forecast, By Industry, By Solution Type (IT and Telecommunication, and Aerospace & Defense), 2017–2027
Table 21: Asia Pacific SAP Digital Services Ecosystem Market Revenue (US$ Bn) Forecast, By Industry, By Solution Type (Manufacturing, and Oil & Gas), 2017–2027
Table 22: Asia Pacific SAP Digital Services Ecosystem Market Revenue (US$ Bn) Forecast, By Industry, By Solution Type (Energy and Utility, and BFSI), 2017–2027
Table 23: Asia Pacific SAP Digital Services Ecosystem Market Revenue (US$ Bn) Forecast, By Industry, By Solution Type (Healthcare, and Others), 2017–2027
Table 24: Asia Pacific SAP Digital Services Ecosystem Market Revenue (US$ Bn) Forecast, By Country 2017–2027
Table 25: Middle East and Africa SAP Digital Services Ecosystem SAP Digital Services Ecosystem Market Forecast, By Solution Type, 2017–2027
Table 26: Middle East and Africa SAP Digital Services Ecosystem Market Revenue (US$ Bn) Forecast, By Industry, By Solution Type (IT and Telecommunication, and Aerospace & Defense), 2017–2027
Table 27: Middle East and Africa SAP Digital Services Ecosystem Market Revenue (US$ Bn) Forecast, By Industry, By Solution Type (Manufacturing, and Oil & Gas), 2017–2027
Table 28: Middle East and Africa SAP Digital Services Ecosystem Market Revenue (US$ Bn) Forecast, By Industry, By Solution Type (Energy and Utility, and BFSI), 2017–2027
Table 29: Middle East and Africa SAP Digital Services Ecosystem Market Revenue (US$ Bn) Forecast, By Industry, By Solution Type (Healthcare, and Others), 2017–2027
Table 30: Middle East and Africa SAP Digital Services Ecosystem SAP Digital Services Ecosystem Market Forecast, By Country 2017–2027
Table 31: South America SAP Digital Services Ecosystem Market Revenue (US$ Bn) Forecast, By Solution Type, 2017–2027
Table 32: South America SAP Digital Services Ecosystem Market Revenue (US$ Bn) Forecast, By Industry, By Solution Type (IT and Telecommunication, and Aerospace & Defense), 2017–2027
Table 33: South America SAP Digital Services Ecosystem Market Revenue (US$ Bn) Forecast, By Industry, By Solution Type (Manufacturing, and Oil & Gas), 2017–2027
Table 34: South America SAP Digital Services Ecosystem Market Revenue (US$ Bn) Forecast, By Industry, By Solution Type (Energy and Utility, and BFSI), 2017–2027
Table 35: South America SAP Digital Services Ecosystem Market Revenue (US$ Bn) Forecast, By Industry, By Solution Type (Healthcare, and Others), 2017–2027
Table 36: South America SAP Digital Services Ecosystem Market Revenue (US$ Bn) Forecast, By Country 2017–2027
List of Charts:
Figure 01: Global SAP Digital Services Ecosystem Market Overview
Figure 02: Global SAP Digital Services Ecosystem Market, by Solution Type (2018)
Figure 03: Global SAP Digital Services Ecosystem Market, by Region (2027)
Figure 04: Global SAP Digital Services Ecosystem Market, by End-use Industry (2018)
Figure 05: Global SAP Digital Services Ecosystem Market Revenue Forecast, 2017–2027 (US$ Bn)
Figure 06: Global SAP Digital Services Ecosystem Market, Y-o-Y Growth (%), 2018–2027
Figure 07: Global SAP Digital Services Ecosystem Market Attractiveness Analysis, by Solution Type
Figure 08: Global SAP Digital Services Ecosystem Market Attractiveness Analysis, by End-use Industry
Figure 09: Global SAP Digital Services Ecosystem Market Attractiveness Analysis, by Region
Figure 10: North America SAP Digital Services Ecosystem Market Revenue (US$ Bn) Forecast, 2017–2027
Figure 11: North America SAP Digital Services Ecosystem Market Value Share Analysis, by Solution Type, 2019 and 2027
Figure 12: North America SAP Digital Services Ecosystem Market Attractiveness Analysis, by Solution Type
Figure 13: North America SAP Digital Services Ecosystem Market Value Share Analysis, by End-use Industry, 2019 and 2027
Figure 14: North America SAP Digital Services Ecosystem Market Attractiveness Analysis, by End-use Industry
Figure 15: North America SAP Digital Services Ecosystem Market Value Share Analysis, by Country/Sub-region, 2019 and 2027
Figure 16: North America SAP Digital Services Ecosystem Market Attractiveness Analysis, by Country/Sub-region
Figure 17: Europe SAP Digital Services Ecosystem Market Revenue (US$ Bn) Forecast, 2017–2027
Figure 18: Europe SAP Digital Services Ecosystem Market Value Share Analysis, by Solution Type, 2019 and 2027
Figure 19: Europe SAP Digital Services Ecosystem Market Attractiveness Analysis, by Solution Type
Figure 20: Europe SAP Digital Services Ecosystem Market Value Share Analysis, by End-use Industry, 2019 and 2027
Figure 21: Europe SAP Digital Services Ecosystem Market Attractiveness Analysis, by End-use Industry
Figure 22: Europe SAP Digital Services Ecosystem Market Value Share Analysis, by Country/Sub-region, 2019 and 2027
Figure 23: Europe SAP Digital Services Ecosystem Market Attractiveness Analysis, by Country/Sub-region
Figure 24: Asia Pacific SAP Digital Services Ecosystem Market Revenue (US$ Bn) Forecast, 2017–2027
Figure 25: Asia Pacific SAP Digital Services Ecosystem Market Value Share Analysis, by Solution Type, 2019 and 2027
Figure 26: Asia Pacific SAP Digital Services Ecosystem Market Attractiveness Analysis, by Solution Type
Figure 27: Asia Pacific SAP Digital Services Ecosystem Market Value Share Analysis, by End-use Industry, 2019 and 2027
Figure 28: Asia Pacific SAP Digital Services Ecosystem Market Attractiveness Analysis, by End-use Industry
Figure 29: Asia Pacific SAP Digital Services Ecosystem Market Value Share Analysis, by Country/Sub-region, 2019 and 2027
Figure 30: Asia Pacific SAP Digital Services Ecosystem Market Attractiveness Analysis, by Country/Sub-region
Figure 31: Middle East & Africa SAP Digital Services Ecosystem Market Revenue (US$ Bn) Forecast, 2017–2027
Figure 32: Middle East & Africa SAP Digital Services Ecosystem Market Value Share Analysis, by Solution Type, 2019 and 2027
Figure 33: Middle East & Africa SAP Digital Services Ecosystem Market Attractiveness Analysis, by Solution Type
Figure 34: Middle East & Africa SAP Digital Services Ecosystem Market Value Share Analysis, by End-use Industry, 2019 and 2027
Figure 35: Middle East & Africa SAP Digital Services Ecosystem Market Attractiveness Analysis, by End-use Industry
Figure 36: Middle East & Africa SAP Digital Services Ecosystem Market Value Share Analysis, by Country/Sub-region, 2019 and 2027
Figure 37: Middle East & Africa SAP Digital Services Ecosystem Market Attractiveness Analysis, by Country/Sub-region
Figure 38: South America SAP Digital Services Ecosystem Market Revenue (US$ Bn) Forecast, 2017–2027
Figure 39: South America SAP Digital Services Ecosystem Market Value Share Analysis, by Solution Type, 2019 and 2027
Figure 40: South America SAP Digital Services Ecosystem Market Attractiveness Analysis, by Solution Type
Figure 41: South America SAP Digital Services Ecosystem Market Value Share Analysis, by End-use Industry, 2019 and 2027
Figure 42: South America SAP Digital Services Ecosystem Market Attractiveness Analysis, by End-use Industry
Figure 43: South America SAP Digital Services Ecosystem Market Value Share Analysis, by Country/Sub-region, 2019 and 2027
Figure 44: South America SAP Digital Services Ecosystem Market Attractiveness Analysis, by Country/Sub-region
Figure 45: Global SAP Digital Services Ecosystem Market Share Analysis, by Partner Company (2017)
Copyright © Transparency Market Research, Inc. All Rights reserved
Trust Online

SAP Digital Services Ecosystem Market