
Reports
Reports
Refinery Catalysts Market : Overview
Refinery catalysts are widely used in petroleum refineries owing to their property to alter the rate of chemical reactions. Apart from this, it also enhances quality of gasoline products produced through FCC and hydro-processing. Refinery catalysts market are known to minimize the adverse effects of gasoline and diesel on the environment. This is because they help in removing sulfur from crude oil. The growth in the global refinery catalysts market is mainly attributed to stringent government regulations on the use of crude oil products.
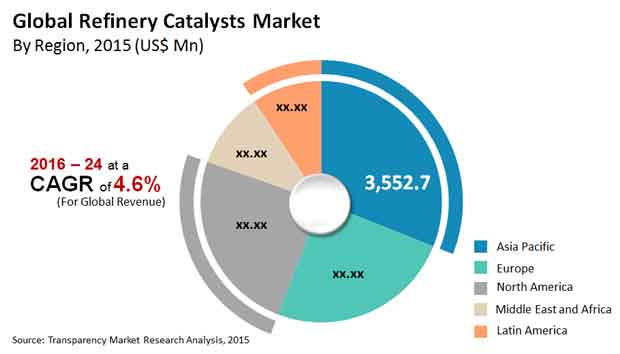
As per a research report by Transparency Market Research, the global refinery catalysts market is likely to reach a valuation of US$11.4 bn in 2015. The market is projected to expand at a steady CAGR of 4.60% from 2016 to 2024. Rising at this CAGR, the global refinery catalysts market is anticipated to reach a valuation US$17.0 bn by the end of the forecast period.
Demand for Hydrocracking Catalysts to Remain High During the Forecast Period
The global refinery catalysts market is classified on the basis of refining unit, material, and physical form. In terms of refining unit, the global refinery catalysts market is segmented into fluid catalytic cracking, hydrocracking, H-oil, hydrotreating, catalytic reforming, and alkylation. Among all them, hydrocracking catalysts segment of the refinery catalyst market is projected to display a highest CAGR during the forecast period. This is because, it has a higher demand across all end user industries owing to its general characteristics. In addition, hydrotreating does not produce coke as a by-product, thereby resulting in the improved conversion of feedstock.
On the basis of material, the global refinery catalysts market is segmented into zeolites, molybdenum, cobalt nickel, others (including platinum, etc.). Among all of them, the cobalt nickel segment accounts for the largest share of the refinery catalyst market. This is because they are primarily used to remove unwanted impurities from diesel and petrol into the environment. Apart from this, they are also used in desulfurization and denitrification processes. As the demand for fuels containing less sulfur content increases, the demand for metals is anticipated to witness steady growth in the near future.
Based on physical form, the global refinery catalysts market is segmented into powders, beads, and extrudates
Asia Pacific to Continue its Dominance in Global Refinery Catalysts Market
In terms of region, the global base oil market has been divided into North America, Europe, Asia Pacific, Middle East & Africa, and Latin America. Among all of them, Asia Pacific is projected to account for the largest market in the overall refinery catalysts market. This is because of the presence of key consumers, which includes countries like India and China. The increase in demand for transportation fuels in these countries have contributed to the growth of the refinery catalyst market in this region.
The leading players operating in the global refinert catalysts market are Sinopec Corp., ExxonMobil Corp., Royal Dutch Shell Plc., and Chevron Corp.
Refinery Catalysts Market to Observe Growth in rising Demand for Transportation Fuel
The increasing demand for various petroleum derivatives is responsible for the rise of the global refinery catalysts market. The said market is also expected to rise due to the rising demand for high-octane fuels. As demand for transportation fuel increases worldwide, the market is expected to observe considerable growth. Strict regulations combined with increasing demand for petroleum and products and chemicals obtained from petroleum is likely to propel growth of the market. In the petroleum refining industry, refinery catalysts are utilized to improve operating performance. Furthermore, the rising demand for high-octane fuel, especially in countries such as the US, India, Japan, Germany, and the UK is expected to positively influence the development of the global refinery catalyst market.
Sustainable Production methods and Technological Advancements are likely to Push Demand in the Market
Zeolites, metals, and chemical compounds are amongst some of the products utilized in the production of refinery catalysts. Manufacturing companies may make hydrocracking refinery catalysts, fluid catalytic cracking refinery catalysts, hydrotreating refinery catalysts, and alkylation refinery catalysts using these processes in different formulations or in conjunction with other chemicals.
Global manufacturers of catalytic processers are extremely focused on catalytic design, which can manage all types of feedstuff, ensuring that hydrocracking and hydrotreating are secure, credible, simple and financially beneficial. Deployment of performance refinery catalyst innovation, patented equipment, and superior process designs all have enabled manufacturers to achieve a competitive advantage over their rivals. Furthermore, companies are gradually using a mix of technological skills and sustainable production methods.
Alternative fuels such as biofuels are expected to be available in conjunction with the implementation of environmental policies and Go Green campaigns initiated by several countries to limit refinery catalysts' market expansion. Asia pacific region is likely to come up as one of the rapidly growing regions in the global refinery catalysts market. The most critical factor ascribed to the overall growth of the regional market is due to the growing population, increased industrialization, stringent regulatory standards, and environmental laws. Continuing oil capacity improvements in the oil refineries of the developing countries of the territory is likely to provide the catalyst refinery market with considerable growth prospects.
1. Preface
1.1. Report Scope and Market Segmentation
1.2. Research Highlights
2. Assumptions and Research Methodology
2.1. Assumptions and Acronyms Used
2.2. Research Methodology
3. Executive Summary
3.1. Market Snapshot, Indicative (US$ Mn)
3.2. Top 3 Trends
4. Market Overview
4.1. Product Overview
4.2. Market Indicators
5. Market Dynamics
5.1. Drivers and Restraints Snapshot Analysis
5.1.1. Drivers
5.1.2. Restraints
5.1.3. Opportunities
5.2. Global Refinery catalysts market Analysis and Forecasts
5.3. Porter’s Analysis
5.3.1. Threat of Substitutes
5.3.2. Bargaining Power of Buyers
5.3.3. Bargaining Power of Suppliers
5.3.4. Threat of New Entrants
5.3.5. Degree of Competition
5.4. Value Chain Analysis
5.5. Refinery Catalysts Market Outlook
6. Global Refinery catalysts market Analysis, by Refining Unit
6.1. Key Findings
6.2. Introduction
6.3. Refining Unit Comparison Matrix
6.4. Global Refinery Catalysts Market Value Share Analysis, by Refining Unit
6.4.1. Fluid Catalytic Cracking
6.4.2. Hydrocracking
6.4.3. H-Oil
6.4.4. Catalytic Reforming
6.4.5. Alkylation
6.4.6. Hydrotreating
6.4.6.1. Naphtha Hydrotreating
6.4.6.2. Distillate Hydrotreating
6.5. Refinery Catalysts Market Attractiveness Analysis, by Refining Unit
6.6. Key Trends
7. Global Refinery catalysts market Value Share Analysis, by Material
7.1. Key Findings
7.2. Introduction
7.3. Material Comparison Matrix
7.4. Global Refinery Catalysts Market Value Share Analysis, by Refining Unit
7.4.1. Zeolites
7.4.2. Molybdenum
7.4.3. Cobalt
7.4.4. Nickel
7.4.5. Others
7.5. Refinery Catalysts Market Attractiveness Analysis, by Material
7.6. Key Trends
8. Global Refinery catalysts market Value Share Analysis, by Physical Form
8.1. Key Findings
8.2. Introduction
8.3. Physical Form Comparison Matrix
8.4. Global Refinery Catalysts Market Value Share Analysis, by Refining Unit
8.4.1. Powders
8.4.2. Beads
8.4.3. Extrudates
8.5. Refinery Catalysts Market Attractiveness Analysis, by Physical Form
8.6. Key Trends
9. Refinery catalysts market Analysis by Region
9.1. Global Refinery catalysts Market Growth Scenario
9.2. Global Refinery catalysts market Value Share Analysis, by Region
9.3. Refinery Catalysts Market Attractiveness Analysis, by Region
10. North America Refinery catalysts market Analysis
10.1. Key Findings
10.2. North America Refinery catalysts market Overview
10.2.1. North America Market Value Share Analysis, By Refining Unit
10.2.2. North America Market Forecast by Refining Unit
10.2.3. North America Market Value Share Analysis, by Material
10.2.4. North America Market Forecast, by Material
10.2.5. North America Market Value Share Analysis, by Physical Form
10.2.6. North America Market Forecast, by Physical Form
10.2.7. North America Market Value Share Analysis, By Country
10.2.8. North America Market Forecast, By Country
10.3. U.S. Refinery Catalysts Market Analysis and Forecast
10.3.1. U.S. Market Forecast, by Refining Unit
10.3.2. U.S. Market Forecast, by Material
10.3.3. U.S. Market Forecast, by Physical Form
10.4. Canada Refinery Catalysts Market Analysis and Forecast
10.4.1. Canada Market Forecast, by Refining Unit
10.4.2. Canada Market Forecast, by Material
10.4.3. Canada Market Forecast, by Physical Form
10.5. North America Market Attractiveness Analysis
10.6. Market Trends
11. Asia Pacific Refinery catalysts market Analysis
11.1. Key Findings
11.2. Asia Pacific Refinery catalysts market Overview
11.2.1. Asia Pacific Market Value Share Analysis, By Refining Unit
11.2.2. Asia Pacific Market Forecast by Refining Unit
11.2.3. Asia Pacific Market Value Share Analysis, by Material
11.2.4. Asia Pacific Market Forecast, by Material
11.2.5. Asia Pacific Market Value Share Analysis, by Physical Form
11.2.6. Asia Pacific Market Forecast, by Physical Form
11.2.7. Asia Pacific Market Value Share Analysis, By Country
11.2.8. Asia Pacific Market Forecast, By Country
11.3. China Refinery Catalysts Market Analysis and Forecast
11.3.1. China Market Forecast, by Refining Unit
11.3.2. China Market Forecast, by Material
11.3.3. China Market Forecast, by Physical Form
11.4. India Refinery Catalysts Market Analysis and Forecast
11.4.1. India Market Forecast, by Refining Unit
11.4.2. India Market Forecast, by Material
11.4.3. India Market Forecast, by Physical Form
11.5. ASEAN Refinery Catalysts Market Analysis and Forecast
11.5.1. ASEAN Market Forecast, by Refining Unit
11.5.2. ASEAN Market Forecast, by Material
11.5.3. ASEAN Market Forecast, by Physical Form
11.6. Rest of Asia pacific Refinery Catalysts Market Analysis and Forecast
11.6.1. Rest of Asia pacific Market Forecast, by Refining Unit
11.6.2. Rest of Asia pacific Market Forecast, by Material
11.6.3. Rest of Asia pacific Market Forecast, by Physical Form
11.7. Asia Pacific Market Attractiveness Analysis
11.8. Market Trends
12. Europe Refinery catalysts market Analysis
12.1. Key Findings
12.2. Europe Refinery catalysts market Overview
12.2.1. Europe Market Value Share Analysis, By Refining Unit
12.2.2. Europe Market Forecast by Refining Unit
12.2.3. Europe Market Value Share Analysis, by Material
12.2.4. Europe Market Forecast, by Material
12.2.5. Europe Market Value Share Analysis, by Physical Form
12.2.6. Europe Market Forecast, by Physical Form
12.2.7. Europe Market Value Share Analysis, By Country
12.2.8. Europe Market Forecast, By Country
12.3. Germany Refinery Catalysts Market Analysis and Forecast
12.3.1. Germany Market Forecast, by Refining Unit
12.3.2. Germany Market Forecast, by Material
12.3.3. Germany Market Forecast, by Physical Form
12.4. France Refinery Catalysts Market Analysis and Forecast
12.4.1. France Market Forecast, by Refining Unit
12.4.2. France Market Forecast, by Material
12.4.3. France Market Forecast, by Physical Form
12.5. Italy Refinery Catalysts Market Analysis and Forecast
12.5.1. Italy Market Forecast, by Refining Unit
12.5.2. Italy Market Forecast, by Material
12.5.3. Italy Market Forecast, by Physical Form
12.6. Spain Refinery Catalysts Market Analysis and Forecast
12.6.1. Spain Market Forecast, by Refining Unit
12.6.2. Spain Market Forecast, by Material
12.6.3. Spain Market Forecast, by Physical Form
12.7. U.K. Refinery Catalysts Market Analysis and Forecast
12.7.1. U.K Market Forecast, by Refining Unit
12.7.2. U.K Market Forecast, by Material
12.7.3. U.K Market Forecast, by Physical Form
12.8. Rest of Europe Refinery Catalysts Market Analysis and Forecast
12.8.1. Rest of Europe Market Forecast, by Refining Unit
12.8.2. Rest of Europe Market Forecast, by Material
12.8.3. Rest of Europe Market Forecast, by Physical Form
12.9. Europe Market Attractiveness Analysis
12.10. Market Trends
13. Latin America Refinery catalysts market Analysis
13.1. Key Findings
13.2. Latin America Refinery catalysts market Overview
13.2.1. Latin America Market Value Share Analysis, By Refining Unit
13.2.2. Latin America Market Forecast by Refining Unit
13.2.3. Latin America Market Value Share Analysis, by Material
13.2.4. Latin America Market Forecast, by Material
13.2.5. Latin America Market Value Share Analysis, by Physical Form
13.2.6. Latin America Market Forecast, by Physical Form
13.2.7. Latin America Market Value Share Analysis, By Country
13.2.8. Latin America Market Forecast, By Country
13.3. Brazil Refinery Catalysts Market Analysis and Forecast
13.3.1. Brazil Market Forecast, by Refining Unit
13.3.2. Brazil Market Forecast, by Material
13.3.3. Brazil Market Forecast, by Physical Form
13.4. Mexico Refinery Catalysts Market Analysis and Forecast
13.4.1. Mexico Market Forecast, by Refining Unit
13.4.2. Mexico Market Forecast, by Material
13.4.3. Mexico Market Forecast, by Physical Form
13.5. Rest of Latin America Refinery Catalysts Market Analysis and Forecast
13.5.1. Rest of Latin America Market Forecast, by Refining Unit
13.5.2. Rest of Latin America Market Forecast, by Material
13.5.3. Rest of Latin America Market Forecast, by Physical Form
13.6. Latin America Market Attractiveness Analysis
13.7. Market Trends
14. Middle East & Africa Refinery catalysts market Analysis
14.1. Key Findings
14.2. Middle East & Africa Refinery catalysts market Overview
14.2.1. Middle East & Africa Market Value Share Analysis, By Refining Unit
14.2.2. Middle East & Africa Market Forecast by Refining Unit
14.2.3. Middle East & Africa Market Value Share Analysis, by Material
14.2.4. Middle East & Africa Market Forecast, by Material
14.2.5. Middle East & Africa Market Value Share Analysis, by Physical Form
14.2.6. Middle East & Africa Market Forecast, by Physical Form
14.2.7. Middle East & Africa Market Value Share Analysis, By Country
14.2.8. Middle East & Africa Market Forecast, By Country
14.3. GCC Refinery Catalysts Market Analysis and Forecast
14.3.1. GCC Market Forecast, by Refining Unit
14.3.2. GCC Market Forecast, by Material
14.3.3. GCC Market Forecast, by Physical Form
14.4. Nigeria Refinery Catalysts Market Analysis and Forecast
14.4.1. Nigeria Market Forecast, by Refining Unit
14.4.2. Nigeria Market Forecast, by Material
14.4.3. Nigeria Market Forecast, by Physical Form
14.5. Rest of Middle East & Africa Refinery Catalysts Market Analysis and Forecast
14.5.1. Rest of Middle East & Africa Market Forecast, by Refining Unit
14.5.2. Rest of Middle East & Africa Market Forecast, by Material
14.5.3. Rest of Middle East & Africa Market Forecast, by Physical Form
14.6. Middle East & Africa Market Attractiveness Analysis
14.7. Market Trends
15. Competition Landscape
15.1. Refinery catalysts market Share Analysis by Company (2015)
15.2. Competition Matrix
15.2.1. Royal Dutch Shell Plc.
15.2.2. ExxonMobil Corporation
15.2.3. BASF SE
15.2.4. Honeywell International Inc.
15.3. Company Profiles
15.3.1. Albemarle Corporation Company Description
15.3.1.1. Business Overview
15.3.1.2. SWOT Analysis
15.3.1.3. Financial Details
15.3.1.4. Strategic Overview
15.3.2. BASF SE
15.3.2.1. Company Description
15.3.2.2. Business Overview
15.3.2.3. SWOT Analysis
15.3.2.4. Financial Details
15.3.2.5. Strategic Overview
15.3.3. Chevron Corporation
15.3.3.1. Company Description
15.3.3.2. Business Overview
15.3.3.3. SWOT Analysis
15.3.3.4. Financial Details
15.3.3.5. Strategic Overview
15.3.4. ExxonMobil Corporation
15.3.4.1. Company Description
15.3.4.2. Business Overview
15.3.4.3. SWOT Analysis
15.3.4.4. Financial Details
15.3.4.5. Strategic Overview
15.3.5. Haldor Topsoe A/S
15.3.5.1. Company Description
15.3.5.2. Business Overview
15.3.5.3. SWOT Analysis
15.3.5.4. Financial Details
15.3.5.5. Strategic Overview
15.3.6. Honeywell International Inc.
15.3.6.1. Company Description
15.3.6.2. Business Overview
15.3.6.3. SWOT Analysis
15.3.6.4. Financial Details
15.3.6.5. Strategic Overview
15.3.7. Johnson Matthey Plc.
15.3.7.1. Company Description
15.3.7.2. Business Overview
15.3.7.3. SWOT Analysis
15.3.7.4. Financial Details
15.3.7.5. Strategic Overview
15.3.8. Royal Dutch Shell plc
15.3.8.1. Company Description
15.3.8.2. Business Overview
15.3.8.3. SWOT Analysis
15.3.8.4. Financial Details
15.3.8.5. Strategic Overview
15.3.9. Sinopec Corporation
15.3.9.1. Company Description
15.3.9.2. Business Overview
15.3.9.3. SWOT Analysis
15.3.9.4. Financial Details
15.3.9.5. Strategic Overview
15.3.10. W. R. Grace & Co.-Conn
15.3.10.1. Company Description
15.3.10.2. Business Overview
15.3.10.3. SWOT Analysis
15.3.10.4. Financial Details
15.3.10.5. Strategic Overview
15.3.11. JGC Catalysts and Che Refinery Catalysts Ltd.
15.3.11.1. Company Description
15.3.11.2. Business Overview
15.3.12. Magma Ceramics & Catalysts
15.3.12.1. Company Description
15.3.12.2. Business Overview
15.3.13. Zeochem AG
15.3.13.1. Company Description
15.3.13.2. Business Overview
15.4. Key Takeaways
List of Tables
Table 01: Global Refinery Catalysts Market Size (US$ Mn) and Volume (Kilo Tons) Forecast, by Refining Unit, 2015–2024
Table 02: Global Refinery Catalysts Market Size (US$ Mn) and Volume (Kilo Tons) Forecast, by Refining Unit, 2015–2024
Table 03: Global Refinery Catalysts Market Size (US$ Mn) and Volume (Kilo Tons) Forecast, by Material, 2015–2024
Table 04: Global Refinery Catalysts Market Size (US$ Mn) and Volume (Kilo Tons) Forecast, by Physical Form, 2015–2024
Table 05: Global Refinery Catalysts Market Size (US$ Mn) and Volume (Kilo Tons) Forecast, by Region , 2015–2024
Table 06: North America Refinery Catalysts Market Size (US$ Mn) and Volume (Kilo Tons) Forecast, by Refining Unit, 2015–2024
Table 07: North America Refinery Catalysts Market Size (US$ Mn) and Volume (Kilo Tons) Forecast, by Refining Unit, 2015–2024
Table 08: North America Refinery Catalysts Market Size (US$ Mn) and Volume (Kilo Tons) Forecast, by Material, 2015–2024
Table 09: North America Refinery Catalysts Market Size (US$ Mn) and Volume (Kilo Tons) Forecast, by Physical Form, 2015–2024
Table 10: North America Refinery Catalysts Market Size (US$ Mn) and Volume (Kilo Tons) Forecast, By Country, 2015–2024
Table 11: U.S. Refinery Catalysts Market Size (US$ Mn) and Volume (Kilo Tons) Forecast, by Refining Unit, 2015–2024
Table 12: U.S. Refinery Catalysts Market Size (US$ Mn) and Volume (Kilo Tons) Forecast, by Refining Unit, 2015–2024
Table 13: U.S. Refinery Catalysts Market Size (US$ Mn) and Volume (Kilo Tons) Forecast, by Material, 2015–2024
Table 14: U.S. Refinery Catalysts Market Size (US$ Mn) and Volume (Kilo Tons) Forecast, by Physical Form, 2015–2024
Table 15: Canada Refinery Catalysts Market Size (US$ Mn) and Volume (Kilo Tons) Forecast, by Refining Unit, 2015–2024
Table 16: Canada Refinery Catalysts Market Size (US$ Mn) and Volume (Kilo Tons) Forecast, by Refining Unit, 2015–2024
Table 17: Canada Refinery Catalysts Market Size (US$ Mn) and Volume (Kilo Tons) Forecast, by Material, 2015–2024
Table 18: Canada Refinery Catalysts Market Size (US$ Mn) and Volume (Kilo Tons) Forecast, by Physical Form, 2015–2024
Table 19: Asia Pacific Refinery Catalysts Market Size (US$ Mn) and Volume (Kilo Tons) Forecast, by Refining Unit, 2015–2024
Table 20: Asia Pacific Refinery Catalysts Market Size (US$ Mn) and Volume (Kilo Tons) Forecast, by Refining Unit, 2015–2024
Table 21: Asia Pacific Refinery Catalysts Market Size (US$ Mn) and Volume (Kilo Tons) Forecast, by Material, 2015–2024
Table 22: Asia Pacific Refinery Catalysts Market Size (US$ Mn) and Volume (Kilo Tons) Forecast, by Physical Form, 2015–2024
Table 23: Asia Pacific Refinery Catalysts Market Size (US$ Mn) and Volume (Kilo Tons) Forecast, by Country, 2015–2024
Table 24: China Refinery Catalysts Market Size (US$ Mn) and Volume (Kilo Tons) Forecast, by Refining Unit, 2015–2024
Table 25: China Refinery Catalysts Market Size (US$ Mn) and Volume (Kilo Tons) Forecast, by Refining Unit, 2015–2024
Table 26: China Refinery Catalysts Market Size (US$ Mn) and Volume (Kilo Tons) Forecast, by Material, 2015–2024
Table 27: China Refinery Catalysts Market Size (US$ Mn) and Volume (Kilo Tons) Forecast, by Physical Form, 2015–2024
Table 28: India Refinery Catalysts Market Size (US$ Mn) and Volume (Kilo Tons) Forecast, by Refining Unit, 2015–2024
Table 29: India Refinery Catalysts Market Size (US$ Mn) and Volume (Kilo Tons) Forecast, by Refining Unit, 2015–2024
Table 30: India Refinery Catalysts Market Size (US$ Mn) and Volume (Kilo Tons) Forecast, by Material, 2015–2024
Table 31: India Refinery Catalysts Market Size (US$ Mn) and Volume (Kilo Tons) Forecast, by Physical Form, 2015–2024
Table 32: ASEAN Refinery Catalysts Market Size (US$ Mn) and Volume (Kilo Tons) Forecast, by Refining Unit, 2015–2024
Table 33: ASEAN Refinery Catalysts Market Size (US$ Mn) and Volume (Kilo Tons) Forecast, by Refining Unit, 2015–2024
Table 34: ASEAN Refinery Catalysts Market Size (US$ Mn) and Volume (Kilo Tons) Forecast, by Material, 2015–2024
Table 35: ASEAN Refinery Catalysts Market Size (US$ Mn) and Volume (Kilo Tons) Forecast, by Physical Form, 2015–2024
Table 36: Rest of Asia Pacific Refinery Catalysts Market Size (US$ Mn) and Volume (Kilo Tons) Forecast, by Refining Unit, 2015–2024
Table 37: Rest of Asia Pacific Refinery Catalysts Market Size (US$ Mn) and Volume (Kilo Tons) Forecast, by Refining Unit, 2015–2024
Table 38: Rest of Asia Pacific Refinery Catalysts Market Size (US$ Mn) and Volume (Kilo Tons) Forecast, by Material, 2015–2024
Table 39: Rest of Asia Pacific Refinery Catalysts Market Size (US$ Mn) and Volume (Kilo Tons) Forecast, by Physical Form, 2015–2024
Table 40: Rest of Asia Pacific Refinery Catalysts Market Size (US$ Mn) and Volume (Kilo Tons) Forecast, by Refining Unit, 2015–2024
Table 41: Rest of Asia Pacific Refinery Catalysts Market Size (US$ Mn) and Volume (Kilo Tons) Forecast, by Refining Unit, 2015–2024
Table 42: Europe Refinery Catalysts Market Size (US$ Mn) and Volume (Kilo Tons) Forecast, by Material, 2015–2024
Table 43: Europe Refinery Catalysts Market Size (US$ Mn) and Volume (Kilo Tons) Forecast, by Physical Form, 2015–2024
Table 44: Europe Refinery Catalysts Market Size (US$ Mn) and Volume (Kilo Tons) Forecast, by Country, 2015–2024
Table 45: Germany Refinery Catalysts Market Size (US$ Mn) and Volume (Kilo Tons) Forecast, by Refining Unit, 2015–2024
Table 46: Germany Refinery Catalysts Market Size (US$ Mn) and Volume (Kilo Tons) Forecast, by Refining Unit, 2015–2024
Table 47: Germany Refinery Catalysts Market Size (US$ Mn) and Volume (Kilo Tons) Forecast, by Material, 2015–2024
Table 48: Germany Refinery Catalysts Market Size (US$ Mn) and Volume (Kilo Tons) Forecast, by Physical Form, 2015–2024
Table 49: France Refinery Catalysts Market Size (US$ Mn) and Volume (Kilo Tons) Forecast, by Refining Unit, 2015–2024
Table 50: France Refinery Catalysts Market Size (US$ Mn) and Volume (Kilo Tons) Forecast, by Refining Unit, 2015–2024
Table 51: France Refinery Catalysts Market Size (US$ Mn) and Volume (Kilo Tons) Forecast, by Material, 2015–2024
Table 52: France Refinery Catalysts Market Size (US$ Mn) and Volume (Kilo Tons) Forecast, by Physical Form, 2015–2024
Table 53: Italy Refinery Catalysts Market Size (US$ Mn) and Volume (Kilo Tons) Forecast, by Refining Unit, 2015–2024
Table 54: Italy Refinery Catalysts Market Size (US$ Mn) and Volume (Kilo Tons) Forecast, by Refining Unit, 2015–2024
Table 55: Italy Refinery Catalysts Market Size (US$ Mn) and Volume (Kilo Tons) Forecast, by Material, 2015–2024
Table 56: Italy Refinery Catalysts Market Size (US$ Mn) and Volume (Kilo Tons) Forecast, by Physical Form, 2015–2024
Table 57: Spain Refinery Catalysts Market Size (US$ Mn) and Volume (Kilo Tons) Forecast, by Refining Unit, 2015–2024
Table 58: Spain Refinery Catalysts Market Size (US$ Mn) and Volume (Kilo Tons) Forecast, by Refining Unit, 2015–2024
Table 59: Spain Refinery Catalysts Market Size (US$ Mn) and Volume (Kilo Tons) Forecast, by Material, 2015–2024
Table 60: Spain Refinery Catalysts Market Size (US$ Mn) and Volume (Kilo Tons) Forecast, by Physical Form, 2015–2024
Table 61: U.K. Refinery Catalysts Market Size (US$ Mn) and Volume (Kilo Tons) Forecast, by Refining Unit, 2015–2024
Table 62: U.K. Refinery Catalysts Market Size (US$ Mn) and Volume (Kilo Tons) Forecast, by Refining Unit, 2015–2024
Table 63: U.K. Refinery Catalysts Market Size (US$ Mn) and Volume (Kilo Tons) Forecast, by Material, 2015–2024
Table 64: U.K. Refinery Catalysts Market Size (US$ Mn) and Volume (Kilo Tons) Forecast, by Physical Form, 2015–2024
Table 65: Rest of Europe Refinery Catalysts Market Size (US$ Mn) and Volume (Kilo Tons) Forecast, by Refining Unit, 2015–2024
Table 66: Rest of Europe Refinery Catalysts Market Size (US$ Mn) and Volume (Kilo Tons) Forecast, by Refining Unit, 2015–2024
Table 67: Rest of Europe Refinery Catalysts Market Size (US$ Mn) and Volume (Kilo Tons) Forecast, by Material, 2015–2024
Table 68: Rest of Europe Refinery Catalysts Market Size (US$ Mn) and Volume (Kilo Tons) Forecast, by Physical Form, 2015–2024
Table 69: Latin America Refinery Catalysts Market Size (US$ Mn) and Volume (Kilo Tons) Forecast, by Refining Unit, 2015–2024
Table 70: Latin America Refinery Catalysts Market Size (US$ Mn) and Volume (Kilo Tons) Forecast, by Refining Unit, 2015–2024
Table 71: Latin America Refinery Catalysts Market Size (US$ Mn) and Volume (Kilo Tons) Forecast, by Material, 2015–2024
Table 72: Latin America Refinery Catalysts Market Size (US$ Mn) and Volume (Kilo Tons) Forecast, by Physical Form, 2015–2024
Table 73: Latin America Refinery Catalysts Market Size (US$ Mn) and Volume (Kilo Tons) Forecast, by Country, 2015–2024
Table 74: Brazil Refinery Catalysts Market Size (US$ Mn) and Volume (Kilo Tons) Forecast, by Refining Unit, 2015–2024
Table 75: Brazil Refinery Catalysts Market Size (US$ Mn) and Volume (Kilo Tons) Forecast, by Refining Unit, 2015–2024
Table 76: Brazil Refinery Catalysts Market Size (US$ Mn) and Volume (Kilo Tons) Forecast, by Material, 2015–2024
Table 77: Brazil Refinery Catalysts Market Size (US$ Mn) and Volume (Kilo Tons) Forecast, by Physical Form, 2015–2024
Table 78: Mexico Refinery Catalysts Market Size (US$ Mn) and Volume (Kilo Tons) Forecast, by Refining Unit, 2015–2024
Table 79: Mexico Refinery Catalysts Market Size (US$ Mn) and Volume (Kilo Tons) Forecast, by Refining Unit, 2015–2024
Table 80: Mexico Refinery Catalysts Market Size (US$ Mn) and Volume (Kilo Tons) Forecast, by Material, 2015–2024
Table 81: Mexico Refinery Catalysts Market Size (US$ Mn) and Volume (Kilo Tons) Forecast, by Physical Form, 2015–2024
Table 82: Rest of Latin America Refinery Catalysts Market Size (US$ Mn) and Volume (Kilo Tons) Forecast, by Refining Unit, 2015–2024
Table 83: Rest of Latin America Refinery Catalysts Market Size (US$ Mn) and Volume (Kilo Tons) Forecast, by Refining Unit, 2015–2024
Table 84: Rest of Latin America Refinery Catalysts Market Size (US$ Mn) and Volume (Kilo Tons) Forecast, by Material, 2015–2024
Table 85: Rest of Latin America Refinery Catalysts Market Size (US$ Mn) and Volume (Kilo Tons) Forecast, by Physical Form, 2015–2024
Table 86: Middle East and Africa Refinery Catalysts Market Size (US$ Mn) and Volume (Kilo Tons) Forecast, by Refining Unit, 2015–2024
Table 87: Middle East and Africa Refinery Catalysts Market Size (US$ Mn) and Volume (Kilo Tons) Forecast, by Refining Unit, 2015–2024
Table 88: Middle East and Africa Refinery Catalysts Market Size (US$ Mn) and Volume (Kilo Tons) Forecast, by Material, 2015–2024
Table 89: Middle East and Africa Refinery Catalysts Market Size (US$ Mn) and Volume (Kilo Tons) Forecast, by Physical Form, 2015–2024
Table 90: Middle East and Africa Refinery Catalysts Market Size (US$ Mn) and Volume (Kilo Tons) Forecast, by Country, 2015–2024
Table 91: GCC Refinery Catalysts Market Size (US$ Mn) and Volume (Kilo Tons) Forecast, by Refining Unit, 2015–2024
Table 92: GCC Refinery Catalysts Market Size (US$ Mn) and Volume (Kilo Tons) Forecast, by Refining Unit, 2015–2024
Table 93: GCC Refinery Catalysts Market Size (US$ Mn) and Volume (Kilo Tons) Forecast, by Material, 2015–2024
Table 94: GCC Refinery Catalysts Market Size (US$ Mn) and Volume (Kilo Tons) Forecast, by Physical Form, 2015–2024
Table 95: Nigeria Refinery Catalysts Market Size (US$ Mn) and Volume (Kilo Tons) Forecast, by Refining Unit, 2015–2024
Table 96: Nigeria Refinery Catalysts Market Size (US$ Mn) and Volume (Kilo Tons) Forecast, by Refining Unit, 2015–2024
Table 97: Nigeria Refinery Catalysts Market Size (US$ Mn) and Volume (Kilo Tons) Forecast, by Material, 2015–2024
Table 98: Nigeria Refinery Catalysts Market Size (US$ Mn) and Volume (Kilo Tons) Forecast, by Physical Form, 2015–2024
Table 99: Rest of Middle East & Africa Refinery Catalysts Market Size (US$ Mn) and Volume (Kilo Tons) Forecast, by Refining Unit, 2015–2024
Table 100: Rest of Middle East & Africa Refinery Catalysts Market Size (US$ Mn) and Volume (Kilo Tons) Forecast, by Refining Unit, 2015–2024
Table 101: Rest of Middle East & Africa Refinery Catalysts Market Size (US$ Mn) and Volume (Kilo Tons) Forecast, by Material, 2015–2024
Table 102: Rest of Middle East & Africa Refinery Catalysts Market Size (US$ Mn) and Volume (Kilo Tons) Forecast, by Physical Form, 2015–2024
List of Figures
Figure 01: Global Refinery Catalysts Volume (Kilo Tons) and Market Size (US$ Mn) Forecast, 2015–2024
Figure 02: Global Refinery Catalysts Average Price (US$/ Unit) 2015–2024
Figure 03: Global Refinery Catalysts Market Value Share Analysis, by Refining Unit, 2016 and 2024
Figure 04: Refinery Catalysts Market Attractiveness Analysis, by Refining Unit
Figure 05: Global Refinery Catalysts Market Value Share Analysis, by Material, 2016 and 2024
Figure 06: Refinery Catalysts Market Attractiveness Analysis, by Material
Figure 07: Global Refinery Catalysts Market Value Share Analysis, by Physical Form, 2016 and 2024
Figure 08: Refinery Catalysts Market Attractiveness Analysis, by Refining Unit
Figure 09: Global Refinery Catalysts Market Value Share Analysis, by Region, 2016 and 2024
Figure 10: Refinery Catalysts Market Attractiveness Analysis, by Region
Figure 11: North America Refinery Catalysts Market Size (US$ Mn) and Volume (Kilo Tons) Forecast, 2015–2024
Figure 12: North America Refinery Catalysts Market Size and Volume Y-o-Y Growth Projection, 2015–2024
Figure 13: North America Market Attractiveness Analysis, By Country
Figure 14: North America Market Value Share Analysis, by Refining Unit, 2016 and 2024
Figure 15: North America Market Value Share Analysis, by Material, 2016 and 2024
Figure 16: North America Market Value Share Analysis, by Physical Form, 2016 and 2024
Figure 17: North America Market Value Share Analysis, By Country, 2016 and 2024
Figure 18: Asia Pacific Refinery Catalysts Market Size (US$ Mn) and Volume (Kilo Tons) Forecast, 2015–2024
Figure 19: Asia Pacific Refinery Catalysts Market Size and Volume Y-o-Y Growth Projection, 2015–2024
Figure 20: Asia Pacific Market Attractiveness Analysis, by Country
Figure 21: Asia Pacific Market Value Share Analysis, by Refining Unit, 2016 and 2024
Figure 22: Asia Pacific Market Value Share Analysis, by Material, 2016 and 2024
Figure 23: Asia Pacific Market Value Share Analysis, by Physical Form, 2016 and 2024
Figure 24: Asia Pacific Market Value Share Analysis, by Country, 2016 and 2024
Figure 25: Europe Refinery Catalysts Market Size (US$ Mn) and Volume (Kilo Tons) Forecast, 2015–2024
Figure 26: Europe Refinery Catalysts Market Size and Volume Y-o-Y Growth Projection, 2015–2024
Figure 27: Europe Market Attractiveness Analysis, by Country
Figure 28: Europe Market Value Share Analysis, by Refining Unit, 2016 and 2024
Figure 29: Europe Market Value Share Analysis, by Material, 2016 and 2024
Figure 30: Rest of Asia Pacific Market Value Share Analysis, by Physical Form, 2016 and 2024
Figure 31: Europe Market Value Share Analysis, by Country, 2016 and 2024
Figure 32: Latin America Refinery Catalysts Market Size (US$ Mn) and Volume (Kilo Tons) Forecast, 2015–2024
Figure 33: Latin America Refinery Catalysts Market Size and Volume Y-o-Y Growth Projection, 2015–2024
Figure 34: Latin America Market Attractiveness Analysis, by Country
Figure 35: Latin America Market Value Share Analysis, by Refining Unit, 2016 and 2024
Figure 36: Latin America Market Value Share Analysis, by Material, 2016 and 2024
Figure 37: Latin America Market Value Share Analysis, by Physical Form, 2016 and 2024
Figure 38: Latin America Market Value Share Analysis, by Country, 2016 and 2024
Figure 39: Middle East & Africa Refinery Catalysts Market Size (US$ Mn) and Volume (Kilo Tons) Forecast, 2015–2024
Figure 40: Middle East & Africa Refinery Catalysts Market Size and Volume Y-o-Y Growth Projections, 2015–2024
Figure 41: Middle East & Africa Market Attractiveness Analysis, By Country
Figure 42: Middle East and Africa Market Value Share Analysis, by Refining Unit, 2016 and 2024
Figure 43: Middle East and Africa Market Value Share Analysis, by Material, 2016 and 2024
Figure 44: Middle East and Africa Market Value Share Analysis, by Material, 2016 and 2024
Figure 45: Middle East and Africa Market Value Share Analysis, by Country, 2016 and 2024
Figure 46: Global Refinery Catalysts Market Share Analysis, by Company (2015)
Copyright © Transparency Market Research, Inc. All Rights reserved
Trust Online

Refinery Catalysts Market