
Reports
Reports
Growing prevalence of various blood diseases such as anemia, myeloma, leukemia and sickle cell anemia has led the hematologists to focus on various detection processes. As demand for comparatively conducting comparatively short diagnosis process is becoming the need of the hour, hematologists are looking for better treatment processes through accurate diagnosis process. With the growing need to detect various blood conditions has further propelled hematologists to focus on enhancing their diagnostic skills. In order to develop successful treatment techniques, hematologist are significantly focusing on early diagnosis of the various hematologist diseases. Bound to these factors, growth of the global hematologist disease treatment market will continue to gain momentum during the forecast period.
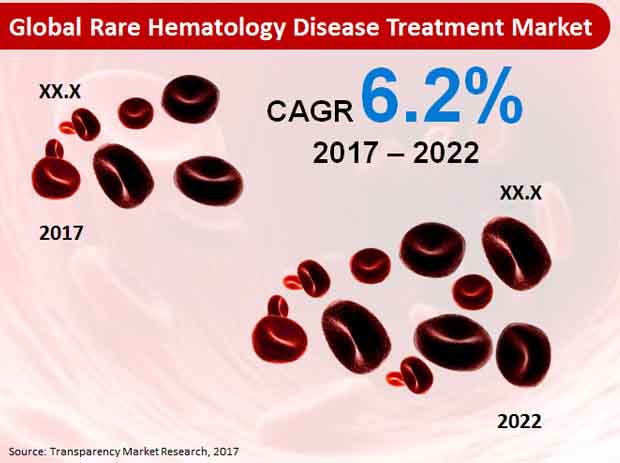
According to Transparency Market Research, the global rare hematology market is expected to represent a value of over US$ 16,000 Mn by the end of 2022.
Market Taxonomy
|
Region |
Treatment Type |
Indication |
Age Group |
|---|---|---|---|
|
North America |
Plasma Derived Factors |
Hemophilia A |
Adult (18+) |
|
Latin America |
Recombinant Factors |
Hemophilia B |
Pediatric (0-17) |
|
Europe |
|
Von Wilebrand Disease |
|
|
Japan |
|
Acquired Hemophilia A |
|
|
APEJ |
|
Others |
|
|
MEA |
|
|
|
(Additional information, including cross-sectional data and country-wise analysis & forecast is available in the report)
Increasing number of Clinical Trials to Encourage Progress
Hematologists are conducting extensive research for genetics and molecular biology in order to gain a better understanding of various rare hematology diseases. The research work is mainly conducted in order to identify the potential biological targets that help in addressing the diseases on the molecular level. The extensive research work has enabled the hematologists to develop the new treatment techniques that enable faster recovery. Hundreds of the final stage clinical trials are stuck in the FDA pipeline to be evaluated and approved. Treatment procedures related to rare hematology diseases include recombinant coagulation Factor VIIa, Eculizumab: hemoglobinuria, Poloxamer 188: sickle cell disease and nonacog beta pegol: hemophilia A & B. Advocacy groups such as International National Hemophilia Foundation, Myeloma Foundation and American Society of Hematology further continue to offer resources and support for the caregivers, patients and clinicians. Bound to these factors, demand for the rare hematology will continue to increase globally.
Inadequate Hematology Data to Inhibit Market Growth
Lack of support from disease-specific foundations for the purpose of research has continued to inhibit growth of the global rare hematology market during the forecast period. According to Kakkis EverLife foundations, majority of the drugs finalized for the treatment of the various rare hematology disorders did not clear the FDA pipeline for treatment. Increasing demand for approved drugs for the treatment of the rare hematology disorders has led to increasing investments in research and development to develop better treatment process. Bound to various factors including the political, social and economic situations, majority of the patient population have been subject to improper management of treatment and their conditions.
Advocacy groups, patients, caregivers and researchers are coming together in order to spread awareness regarding various blood related diseases. Moreover, the drug developers are increasingly benefitting by pool of specific patients as it enabled the identified patient group to register into the clinical trials. Research related to various rare hematology diseases continues to gain momentum in developed countries such as the U.S. The House of Representatives in the U.S passed the 21st Century Cures Act in 2016, which is focused towards integrating the opinions of the patients that would help in designing the clinical trials related to these diseases. Such factors are expected to contribute towards growth of the global rare hematology market.
Adult Age to Represent a Leading Segment
With growing prevalence of blood disorders and bleeding, demand for the recombinant factors continue to increase. On the basis of treatment type, the recombinant factors segment is expected to generate significant revenues, accounting for a value of over US$ 4,000 Mn by the end of 2022. On the other hand, the plasma derived factors treatment type segment is expected to register a robust CAGR throughout the forecast period. Based on age, the adults segment is expected to represent the highest growth in terms of revenue, recording a value of over US$ 3,000 Mn by the end 2017. However, the pediatric age segment is expected to represent the highest CAGR in the global market through 2022.
Competition Tracking
Leading market players operating in the global rare hematology market include Shire plc, Biogen Inc., Novo Nordisk A/S, Bayer Healthcare AG, CSL Behring LLC, Pfizer Inc., PRA Health Sciences, Celgene Corporation, Alexion Pharmaceuticals, Inc. and Amgen Inc.
Chapter 1 Global Outlook
Chapter 2 Global Rare Hematology Disease Treatment Market-Executive Summary
Chapter 3 Global Rare Hematology Disease Treatment Market Overview
3.1 Introduction
3.1.1 Global Rare Hematology Disease Treatment Market Taxonomy
3.1.2 Global Rare Hematology Disease Treatment Market Definition
3.2 Global Rare Hematology Disease Treatment Market Size (US$ Mn) and Forecast, 2012-2022
3.2.1 Global Rare Hematology Disease Treatment Market Y-o-Y Growth
3.3 Global Rare Hematology Disease Treatment Market Dynamics
3.4 Supply Chain
3.5 Cost Structure
3.6 PESTL Analysis
3.7 Product Lifecycle
3.8 Key Regulations
3.9 Biologics License Application (BLA) Products
3.10 List of Distributors
3.11 Key Participants Market Presence (Intensity Map) By Region
Chapter 4 Global Rare Hematology Disease Treatment Market Analysis and Forecast 2012-2022
4.1 Global Rare Hematology Disease Treatment Market Size and Forecast by Treatment Type, 2012-2022
4.1.1 Plasma Derived Factors Market Size and Forecast, 2012-2022
4.1.1.1 Revenue (US$ Mn) Comparison, By Region
4.1.1.2 Market Share Comparison, By Region
4.1.1.3 Y-o-Y growth Comparison, By Region
4.1.2 Recombinant Factors Market Size and Forecast, 2012-2022
4.1.2.1 Revenue (US$ Mn) Comparison, By Region
4.1.2.2 Market Share Comparison, By Region
4.1.2.3 Y-o-Y growth Comparison, By Region
4.2 Global Rare Hematology Disease Treatment Market Size and Forecast by Indication, 2012-2022
4.2.1 Hemophilia A Disease Treatment Market Size and Forecast, 2012-2022
4.2.1.1 Revenue (US$ Mn) Comparison, By Region
4.2.1.2 Market Share Comparison, By Region
4.2.1.3 Y-o-Y growth Comparison, By Region
4.2.2 Hemophilia B Disease Treatment Market Size and Forecast, 2012-2022
4.2.2.1 Revenue (US$ Mn) Comparison, By Region
4.2.2.2 Market Share Comparison, By Region
4.2.2.3 Y-o-Y growth Comparison, By Region
4.2.3 Von Wilebrand Disease Treatment Market Size and Forecast, 2012-2022
4.2.3.1 Revenue (US$ Mn) Comparison, By Region
4.2.3.2 Market Share Comparison, By Region
4.2.3.3 Y-o-Y growth Comparison, By Region
4.2.4 Acquired Hemophilia A Disease Treatment Market Size and Forecast, 2012-2022
4.2.4.1 Revenue (US$ Mn) Comparison, By Region
4.2.4.2 Market Share Comparison, By Region
4.2.4.3 Y-o-Y growth Comparison, By Region
4.2.5 Other Disease Treatment Market Size and Forecast, 2012-2022
4.2.5.1 Revenue (US$ Mn) Comparison, By Region
4.2.5.2 Market Share Comparison, By Region
4.2.5.3 Y-o-Y growth Comparison, By Region
4.3 Global Rare Hematology Disease Treatment Market Size and Forecast by Age Group, 2012-2022
4.3.1 Global Rare Hematology Disease Treatment Market for Adult (18+) Market Size and Forecast, 2012-2022
4.3.1.1 Revenue (US$ Mn) Comparison, By Region
4.3.1.2 Market Share Comparison, By Region
4.3.1.3 Y-o-Y growth Comparison, By Region
4.3.2 Global Rare Hematology Disease Treatment Market for Pediatric (0-17) Market Size and Forecast, 2012-2022
4.3.2.1 Revenue (US$ Mn) Comparison, By Region
4.3.2.2 Market Share Comparison, By Region
4.3.2.3 Y-o-Y growth Comparison, By Region
Chapter 5 North America Rare Hematology Disease Treatment Market Analysis and Forecast, By Country, 2012-2022
5.1 North America Rare Hematology Disease Treatment Market Size and Forecast, 2012-2022
5.1.1 Revenue (US$ Mn) Comparison, By Treatment Type
5.1.2 Revenue (US$ Mn) Comparison, By Indication
5.1.3 Revenue (US$ Mn) Comparison, By Age Group
5.2 US Rare Hematology Disease Treatment Market Size and Forecast, 2012-2022
5.2.1 Revenue (US$ Mn) Comparison, By Treatment Type
5.2.2 Revenue (US$ Mn) Comparison, By Indication
5.2.3 Revenue (US$ Mn) Comparison, By Age Group
5.3 Canada Rare Hematology Disease Treatment Market Size and Forecast, 2012-2022
5.3.1 Revenue (US$ Mn) Comparison, By Treatment Type
5.3.2 Revenue (US$ Mn) Comparison, By Indication
5.3.3 Revenue (US$ Mn) Comparison, By Age Group
Chapter 6 Latin America Rare Hematology Disease Treatment Market Analysis and Forecast, By Country, 2012-2022
6.1 Latin America Rare Hematology Disease Treatment Market Size and Forecast, 2012-2022
6.1.1 Revenue (US$ Mn) Comparison, By Treatment Type
6.1.2 Revenue (US$ Mn) Comparison, By Indication
6.1.3 Revenue (US$ Mn) Comparison, By Age Group
6.2 Brazil Rare Hematology Disease Treatment Market Size and Forecast, 2012-2022
6.2.1 Revenue (US$ Mn) Comparison, By Treatment Type
6.2.2 Revenue (US$ Mn) Comparison, By Indication
6.2.3 Revenue (US$ Mn) Comparison, By Age Group
6.3 Mexico Rare Hematology Disease Treatment Market Size and Forecast, 2012-2022
6.3.1 Revenue (US$ Mn) Comparison, By Treatment Type
6.3.2 Revenue (US$ Mn) Comparison, By Indication
6.3.3 Revenue (US$ Mn) Comparison, By Age Group
6.4 Rest of Latin America Rare Hematology Disease Treatment Market Size and Forecast, 2012-2022
6.4.1 Revenue (US$ Mn) Comparison, By Treatment Type
6.4.2 Revenue (US$ Mn) Comparison, By Indication
6.4.3 Revenue (US$ Mn) Comparison, By Age Group
Chapter 7 Europe Rare Hematology Disease Treatment Market Analysis and Forecast, By Country, 2012-2022
7.1 Europe Rare Hematology Disease Treatment Market Size and Forecast, 2012-2022
7.1.1 Revenue (US$ Mn) Comparison, By Treatment Type
7.1.2 Revenue (US$ Mn) Comparison, By Indication
7.1.3 Revenue (US$ Mn) Comparison, By Age Group
7.2 Germany Rare Hematology Disease Treatment Market Size and Forecast, 2012-2022
7.2.1 Revenue (US$ Mn) Comparison, By Treatment Type
7.2.2 Revenue (US$ Mn) Comparison, By Indication
7.2.3 Revenue (US$ Mn) Comparison, By Age Group
7.3 UK Rare Hematology Disease Treatment Market Size and Forecast, 2012-2022
7.3.1 Revenue (US$ Mn) Comparison, By Treatment Type
7.3.2 Revenue (US$ Mn) Comparison, By Indication
7.3.3 Revenue (US$ Mn) Comparison, By Age Group
7.4 France Rare Hematology Disease Treatment Market Size and Forecast, 2012-2022
7.4.1 Revenue (US$ Mn) Comparison, By Treatment Type
7.4.2 Revenue (US$ Mn) Comparison, By Indication
7.4.3 Revenue (US$ Mn) Comparison, By Age Group
7.5 Spain Rare Hematology Disease Treatment Market Size and Forecast, 2012-2022
7.5.1 Revenue (US$ Mn) Comparison, By Treatment Type
7.5.2 Revenue (US$ Mn) Comparison, By Indication
7.5.3 Revenue (US$ Mn) Comparison, By Age Group
7.6 Italy Rare Hematology Disease Treatment Market Size and Forecast, 2012-2022
7.6.1 Revenue (US$ Mn) Comparison, By Treatment Type
7.6.2 Revenue (US$ Mn) Comparison, By Indication
7.6.3 Revenue (US$ Mn) Comparison, By Age Group
7.7 Rest of Europe Rare Hematology Disease Treatment Market Size and Forecast, 2012-2022
7.7.1 Revenue (US$ Mn) Comparison, By Treatment Type
7.7.2 Revenue (US$ Mn) Comparison, By Indication
7.7.3 Revenue (US$ Mn) Comparison, By Age Group
Chapter 8 Japan Rare Hematology Disease Treatment Market Analysis and Forecast, By Country, 2012-2022
8.1 Japan Rare Hematology Disease Treatment Market Size and Forecast, 2012-2022
8.1.1 Revenue (US$ Mn) Comparison, By Treatment Type
8.1.2 Revenue (US$ Mn) Comparison, By Indication
8.1.3 Revenue (US$ Mn) Comparison, By Age Group
Chapter 9 APEJ Rare Hematology Disease Treatment Market Analysis and Forecast, By Country, 2012-2022
9.1 APEJ Rare Hematology Disease Treatment Market Size and Forecast, 2012-2022
9.1.1 Revenue (US$ Mn) Comparison, By Treatment Type
9.1.2 Revenue (US$ Mn) Comparison, By Indication
9.1.3 Revenue (US$ Mn) Comparison, By Age Group
9.2 China Rare Hematology Disease Treatment Market Size and Forecast, 2012-2022
9.2.1 Revenue (US$ Mn) Comparison, By Treatment Type
9.2.2 Revenue (US$ Mn) Comparison, By Indication
9.2.3 Revenue (US$ Mn) Comparison, By Age Group
9.3 India Rare Hematology Disease Treatment Market Size and Forecast, 2012-2022
9.3.1 Revenue (US$ Mn) Comparison, By Treatment Type
9.3.2 Revenue (US$ Mn) Comparison, By Indication
9.3.3 Revenue (US$ Mn) Comparison, By Age Group
9.4 ASEAN Rare Hematology Disease Treatment Market Size and Forecast, 2012-2022
9.4.1 Revenue (US$ Mn) Comparison, By Treatment Type
9.4.2 Revenue (US$ Mn) Comparison, By Indication
9.4.3 Revenue (US$ Mn) Comparison, By Age Group
9.5 Australia & New Zealand Rare Hematology Disease Treatment Market Size and Forecast, 2012-2022
9.5.1 Revenue (US$ Mn) Comparison, By Treatment Type
9.5.2 Revenue (US$ Mn) Comparison, By Indication
9.5.3 Revenue (US$ Mn) Comparison, By Age Group
9.6 Rest of APEJ Rare Hematology Disease Treatment Market Size and Forecast, 2012-2022
9.6.1 Revenue (US$ Mn) Comparison, By Treatment Type
9.6.2 Revenue (US$ Mn) Comparison, By Indication
9.6.3 Revenue (US$ Mn) Comparison, By Age Group
Chapter 10 MEA Rare Hematology Disease Treatment Market Analysis and Forecast, By Country, 2012-2022
10.1 MEA Rare Hematology Disease Treatment Market Size and Forecast, 2012-2022
10.1.1 Revenue (US$ Mn) Comparison, By Treatment Type
10.1.2 Revenue (US$ Mn) Comparison, By Indication
10.1.3 Revenue (US$ Mn) Comparison, By Age Group
10.2 GCC Countries Rare Hematology Disease Treatment Market Size and Forecast, 2012-2022
10.2.1 Revenue (US$ Mn) Comparison, By Treatment Type
10.2.2 Revenue (US$ Mn) Comparison, By Indication
10.2.3 Revenue (US$ Mn) Comparison, By Age Group
10.3 South Africa Rare Hematology Disease Treatment Market Size and Forecast, 2012-2022
10.3.1 Revenue (US$ Mn) Comparison, By Treatment Type
10.3.2 Revenue (US$ Mn) Comparison, By Indication
10.3.3 Revenue (US$ Mn) Comparison, By Age Group
10.4 Rest of MEA Rare Hematology Disease Treatment Market Size and Forecast, 2012-2022
10.4.1 Revenue (US$ Mn) Comparison, By Treatment Type
10.4.2 Revenue (US$ Mn) Comparison, By Indication
10.4.3 Revenue (US$ Mn) Comparison, By Age Group
Chapter 11 Global Rare Hematology Disease Treatment Market – Competitive Landscape and Company Profiles
11.1 Global Rare Hematology Disease Treatment Market – Company Share Analysis
11.2 Global Rare Hematology Disease Treatment Market – Competitive Landscape
11.3 Global Rare Hematology Disease Treatment Market – Company Profiles
11.3.1 Shire plc
11.3.1.1 Company Overview
11.3.1.2 Product Overview
11.3.1.3 Key Financials
11.3.1.4 Key Developments
11.3.1.5 SWOT Analysis
11.3.2 Biogen Inc.
11.3.2.1 Company Overview
11.3.2.2 Product Overview
11.3.2.3 Key Financials
11.3.2.4 Key Developments
11.3.2.5 SWOT Analysis
11.3.3 Novo Nordisk A/S
11.3.3.1 Company Overview
11.3.3.2 Product Overview
11.3.3.3 Key Financials
11.3.3.4 Key Developments
11.3.3.5 SWOT Analysis
11.3.4 Bayer Healthcare AG
11.3.4.1 Company Overview
11.3.4.2 Product Overview
11.3.5 CSL Behring LLC
11.3.5.1 Company Overview
11.3.5.2 Product Overview
11.3.6 Pfizer Inc.
11.3.6.1 Company Overview
11.3.6.2 Product Overview
11.3.6.3 Key Financials
11.3.6.4 Key Developments
11.3.6.5 SWOT Analysis
11.3.7 PRA Health Sciences
11.3.7.1 Company Overview
11.3.7.2 Product Overview
11.3.7.3 Key Financials
11.3.7.4 Key Developments
11.3.8 Celgene Corporation
11.3.8.1 Company Overview
11.3.8.2 Product Overview
11.3.8.3 Key Financials
11.3.8.4 Key Developments
11.3.8.5 SWOT Analysis
11.3.9 Alexion Pharmaceuticals, Inc.
11.3.9.1 Company Overview
11.3.9.2 Product Overview
11.3.9.3 Key Financials
11.3.9.4 Key Developments
11.3.9.5 SWOT Analysis
11.3.10 Amgen Inc.
11.3.10.1 Company Overview
11.3.10.2 Product Overview
11.3.10.3 Key Financials
11.3.10.4 SWOT Analysis
Chapter 12 TMR Research Methodology
Chapter 13 Disclaimer and Contact information
List of Tables
TABLE 1 Global Rare Hematology Disease Treatment Market Value (US$ Mn), 2012-2016
TABLE 2 Global Rare Hematology Disease Treatment Market Value (US$ Mn), 2017-2022
TABLE 3 Global Rare Hematology Disease Treatment Market Value (US$ Mn) and Y-o-Y, 2015-2022
TABLE 4 Global Plasma Derived Factors Segment Value (US$ Mn), By Region 2012-2016
TABLE 5 Global Plasma Derived Factors Segment Value (US$ Mn), By Region 2017-2022
TABLE 6 Global Plasma Derived Factors Segment Market Share, By Region 2012-2016
TABLE 7 Global Plasma Derived Factors Segment Market Share, By Region 2017-2022
TABLE 8 Global Plasma Derived Factors Segment Y-o-Y, By Region 2015-2022
TABLE 9 Global Recombinant Factors Segment Value (US$ Mn), By Region 2012-2016
TABLE 10 Global Recombinant Factors Segment Value (US$ Mn), By Region 2017-2022
TABLE 11 Global Recombinant Factors Segment Market Share, By Region 2012-2016
TABLE 12 Global Recombinant Factors Segment Market Share, By Region 2017-2022
TABLE 13 Global Recombinant Factors Segment Y-o-Y, By Region 2015-2022
TABLE 14 Global Hemophilia A Disease Treatment Segment Value (US$ Mn), By Region 2012-2016
TABLE 15 Global Hemophilia A Disease Treatment Segment Value (US$ Mn), By Region 2017-2022
TABLE 16 Global Hemophilia A Disease Treatment Segment Market Share, By Region 2012-2016
TABLE 17 Global Hemophilia A Disease Treatment Segment Market Share, By Region 2017-2022
TABLE 18 Global Hemophilia A Disease Treatment Segment Y-o-Y, By Region 2015-2022
TABLE 19 Global Hemophilia B Disease Treatment Segment Value (US$ Mn), By Region 2012-2016
TABLE 20 Global Hemophilia B Disease Treatment Segment Value (US$ Mn), By Region 2017-2022
TABLE 21 Global Hemophilia B Segment Market Share, By Region 2012-2016
TABLE 22 Global Hemophilia B Disease Treatment Segment Market Share, By Region 2017-2022
TABLE 23 Global Hemophilia B Disease Treatment Segment Y-o-Y, By Region 2015-2022
TABLE 24 Global Von Wilebrand Disease Treatment Segment Value (US$ Mn), By Region 2012-2016
TABLE 25 Global Von Wilebrand Disease Treatment Segment Value (US$ Mn), By Region 2017-2022
TABLE 26 Global Von Wilebrand Disease Treatment Segment Market Share, By Region 2012-2016
TABLE 27 Global Von Wilebrand Disease Treatment Segment Market Share, By Region 2017-2022
TABLE 28 Global Von Wilebrand Disease Treatment Segment Y-o-Y, By Region 2015-2022
TABLE 29 Global Acquired Hemophilia A Disease Treatment Segment Value (US$ Mn), By Region 2012-2016
TABLE 30 Global Acquired Hemophilia A Disease Treatment Segment Value (US$ Mn), By Region 2017-2022
TABLE 31 Global Acquired Hemophilia A Disease Treatment Segment Market Share, By Region 2012-2016
TABLE 32 Global Acquired Hemophilia A Disease Treatment Segment Market Share, By Region 2017-2022
TABLE 33 Global Acquired Hemophilia A Disease Treatment Segment Y-o-Y, By Region 2015-2022
TABLE 34 Global Other Disease Treatment Segment Value (US$ Mn), By Region 2012-2016
TABLE 35 Global Other Disease Treatment Segment Value (US$ Mn), By Region 2017-2022
TABLE 36 Global Other Disease Treatment Segment Market Share, By Region 2012-2016
TABLE 37 Global Other Disease Treatment Segment Market Share, By Region 2017-2022
TABLE 38 Global Other Disease Treatment Segment Y-o-Y, By Region 2015-2022
TABLE 39 Global Rare Hematology Disease Treatment Market for Adult (18+) Segment Value (US$ Mn), By Region 2012-2016
TABLE 40 Global Rare Hematology Disease Treatment Market for Adult (18+) Segment Value (US$ Mn), By Region 2017-2022
TABLE 41 Global Rare Hematology Disease Treatment Market for Adult (18+) Segment Market Share, By Region 2012-2016
TABLE 42 Global Rare Hematology Disease Treatment Market for Adult (18+) Segment Market Share, By Region 2017-2022
TABLE 43 Global Rare Hematology Disease Treatment Market for Adult (18+) Segment Y-o-Y, By Region 2015-2022
TABLE 44 Global Rare Hematology Disease Treatment Market for Pediatric (0 -17) Segment Value (US$ Mn), By Region 2012-2016
TABLE 45 Global Rare Hematology Disease Treatment Market for Pediatric (0 -17) Segment Value (US$ Mn), By Region 2017-2022
TABLE 46 Global Rare Hematology Disease Treatment Market for Pediatric (0 -17) Segment Market Share, By Region 2012-2016
TABLE 47 Global Rare Hematology Disease Treatment Market for Pediatric (0 -17) Segment Market Share, By Region 2017-2022
TABLE 48 Global Rare Hematology Disease Treatment Market for Pediatric (0 -17) Segment Y-o-Y, By Region 2015-2022
TABLE 49 North America Current Expenditure on Health, (% of GDP), by Country, 2010 – 2016
TABLE 50 North America Per Capita Health Expenditure (US$ PPP), by Country, 2010-2016
TABLE 51 North America Per Capita Healthcare Expenditure Y-o-Y Growth (in Real terms %), by Country, 2010-2016
TABLE 52 North America Out-of-Pocket Healthcare Expenditure, % of Healthcare Expenditure, by Country, 2010-2016
TABLE 53 North America Per Capita Healthcare Expenditure (at Current Price, in US$), by Country, 2010-2016
TABLE 54 North America Rare Hematology Disease Treatment Market Value (US$ Mn), By Treatment Type 2012-2016
TABLE 55 North America Rare Hematology Disease Treatment Market Value (US$ Mn), By Treatment Type 2017-2022
TABLE 56 North America Rare Hematology Disease Treatment Market Value (US$ Mn), By Indication 2012-2016
TABLE 57 North America Rare Hematology Disease Treatment Market Value (US$ Mn), By Indication 2017-2022
TABLE 58 North America Rare Hematology Disease Treatment Market Value (US$ Mn), By Age Group 2012-2016
TABLE 59 North America Rare Hematology Disease Treatment Market Value (US$ Mn), By Age Group 2017-2022
TABLE 60 US Rare Hematology Disease Treatment Market Value (US$ Mn), By Treatment Type 2012-2016
TABLE 61 US Rare Hematology Disease Treatment Market Value (US$ Mn), By Treatment Type 2017-2022
TABLE 62 US Rare Hematology Disease Treatment Market Value (US$ Mn), By Indication 2012-2016
TABLE 63 US Rare Hematology Disease Treatment Market Value (US$ Mn), By Indication 2017-2022
TABLE 64 US Rare Hematology Disease Treatment Market Value (US$ Mn), By Age Group 2012-2016
TABLE 65 US Rare Hematology Disease Treatment Market Value (US$ Mn), By Age Group 2017-2022
TABLE 66 Canada Rare Hematology Disease Treatment Market Value (US$ Mn), By Treatment Type 2012-2016
TABLE 67 Canada Rare Hematology Disease Treatment Market Value (US$ Mn), By Treatment Type 2017-2022
TABLE 68 Canada Rare Hematology Disease Treatment Market Value (US$ Mn), By Indication 2012-2016
TABLE 69 Canada Rare Hematology Disease Treatment Market Value (US$ Mn), By Indication 2017-2022
TABLE 70 Canada Rare Hematology Disease Treatment Market Value (US$ Mn), By Age Group 2012-2016
TABLE 71 Canada Rare Hematology Disease Treatment Market Value (US$ Mn), By Age Group 2017-2022
TABLE 72 Latin America Current Expenditure on Health, (% of GDP), by Country, 2010 – 2016
TABLE 73 Latin America Per Capita Health Expenditure (US$ PPP), by Country, 2010-2016
TABLE 74 Latin America Per Capita Healthcare Expenditure Y-o-Y Growth (in Real terms %), by Country, 2010-2016
TABLE 75 Latin America Out-of-Pocket Healthcare Expenditure, % of Healthcare Expenditure, by Country, 2010-2016
TABLE 76 Latin America Per Capita Healthcare Expenditure (at Current Price, in US$), by Country, 2010-2016
TABLE 77 Latin America Rare Hematology Disease Treatment Market Value (US$ Mn), By Treatment Type 2012-2016
TABLE 78 Latin America Rare Hematology Disease Treatment Market Value (US$ Mn), By Treatment Type 2017-2022
TABLE 79 Latin America Rare Hematology Disease Treatment Market Value (US$ Mn), By Indication 2012-2016
TABLE 80 Latin America Rare Hematology Disease Treatment Market Value (US$ Mn), By Indication 2017-2022
TABLE 81 Latin America Rare Hematology Disease Treatment Market Value (US$ Mn), By Age Group 2012-2016
TABLE 82 Latin America Rare Hematology Disease Treatment Market Value (US$ Mn), By Age Group 2017-2022
TABLE 83 Brazil Rare Hematology Disease Treatment Market Value (US$ Mn), By Treatment Type 2012-2016
TABLE 84 Brazil Rare Hematology Disease Treatment Market Value (US$ Mn), By Treatment Type 2017-2022
TABLE 85 Brazil Rare Hematology Disease Treatment Market Value (US$ Mn), By Indication 2012-2016
TABLE 86 Brazil Rare Hematology Disease Treatment Market Value (US$ Mn), By Indication 2017-2022
TABLE 87 Brazil Rare Hematology Disease Treatment Market Value (US$ Mn), By Age Group 2012-2016
TABLE 88 Brazil Rare Hematology Disease Treatment Market Value (US$ Mn), By Age Group 2017-2022
TABLE 89 Mexico Rare Hematology Disease Treatment Market Value (US$ Mn), By Treatment Type 2012-2016
TABLE 90 Mexico Rare Hematology Disease Treatment Market Value (US$ Mn), By Treatment Type 2017-2022
TABLE 91 Mexico Rare Hematology Disease Treatment Market Value (US$ Mn), By Indication 2012-2016
TABLE 92 Mexico Rare Hematology Disease Treatment Market Value (US$ Mn), By Indication 2017-2022
TABLE 93 Mexico Rare Hematology Disease Treatment Market Value (US$ Mn), By Age Group 2012-2016
TABLE 94 Mexico Rare Hematology Disease Treatment Market Value (US$ Mn), By Age Group 2017-2022
TABLE 95 Rest of Latin America Rare Hematology Disease Treatment Market Value (US$ Mn), By Treatment Type 2012-2016
TABLE 96 Rest of Latin America Rare Hematology Disease Treatment Market Value (US$ Mn), By Treatment Type 2017-2022
TABLE 97 Rest of Latin America Rare Hematology Disease Treatment Market Value (US$ Mn), By Indication 2012-2016
TABLE 98 Rest of Latin America Rare Hematology Disease Treatment Market Value (US$ Mn), By Indication 2017-2022
TABLE 99 Rest of Latin America Rare Hematology Disease Treatment Market Value (US$ Mn), By Age Group 2012-2016
TABLE 100 Rest of Latin America Rare Hematology Disease Treatment Market Value (US$ Mn), By Age Group 2017-2022
TABLE 101 Europe Current Expenditure on Health, (% of GDP), by Country, 2010 – 2016
TABLE 102 Europe Per Capita Health Expenditure (US$ PPP), by Country, 2010-2016
TABLE 103 Europe Per Capita Healthcare Expenditure Y-o-Y Growth (in Real terms %), by Country, 2010-2016
TABLE 104 Europe Out-of-Pocket Healthcare Expenditure, % of Healthcare Expenditure, by Country, 2010-2016
TABLE 105 Europe Per Capita Healthcare Expenditure (at Current Price, in US$), by Country, 2010-2016
TABLE 106 Europe Rare Hematology Disease Treatment Market Value (US$ Mn), By Treatment Type 2012-2016
TABLE 107 Europe Rare Hematology Disease Treatment Market Value (US$ Mn), By Treatment Type 2017-2022
TABLE 108 Europe Rare Hematology Disease Treatment Market Value (US$ Mn), By Indication 2012-2016
TABLE 109 Europe Rare Hematology Disease Treatment Market Value (US$ Mn), By Indication 2017-2022
TABLE 110 Europe Rare Hematology Disease Treatment Market Value (US$ Mn), By Age Group 2012-2016
TABLE 111 Europe Rare Hematology Disease Treatment Market Value (US$ Mn), By Age Group 2017-2022
TABLE 112 Germany Rare Hematology Disease Treatment Market Value (US$ Mn), By Treatment Type 2012-2016
TABLE 113 Germany Rare Hematology Disease Treatment Market Value (US$ Mn), By Treatment Type 2017-2022
TABLE 114 Germany Rare Hematology Disease Treatment Market Value (US$ Mn), By Indication 2012-2016
TABLE 115 Germany Rare Hematology Disease Treatment Market Value (US$ Mn), By Indication 2017-2022
TABLE 116 Germany Rare Hematology Disease Treatment Market Value (US$ Mn), By Age Group 2012-2016
TABLE 117 Germany Rare Hematology Disease Treatment Market Value (US$ Mn), By Age Group 2017-2022
TABLE 118 UK Rare Hematology Disease Treatment Market Value (US$ Mn), By Treatment Type 2012-2016
TABLE 119 UK Rare Hematology Disease Treatment Market Value (US$ Mn), By Treatment Type 2017-2022
TABLE 120 UK Rare Hematology Disease Treatment Market Value (US$ Mn), By Indication 2012-2016
TABLE 121 UK Rare Hematology Disease Treatment Market Value (US$ Mn), By Indication 2017-2022
TABLE 122 UK Rare Hematology Disease Treatment Market Value (US$ Mn), By Age Group 2012-2016
TABLE 123 UK Rare Hematology Disease Treatment Market Value (US$ Mn), By Age Group 2017-2022
TABLE 124 France Rare Hematology Disease Treatment Market Value (US$ Mn), By Treatment Type 2012-2016
TABLE 125 France Rare Hematology Disease Treatment Market Value (US$ Mn), By Treatment Type 2017-2022
TABLE 126 France Rare Hematology Disease Treatment Market Value (US$ Mn), By Indication 2012-2016
TABLE 127 France Rare Hematology Disease Treatment Market Value (US$ Mn), By Indication 2017-2022
TABLE 128 France Rare Hematology Disease Treatment Market Value (US$ Mn), By Age Group 2012-2016
TABLE 129 France Rare Hematology Disease Treatment Market Value (US$ Mn), By Age Group 2017-2022
TABLE 130 Spain Rare Hematology Disease Treatment Market Value (US$ Mn), By Treatment Type 2012-2016
TABLE 131 Spain Rare Hematology Disease Treatment Market Value (US$ Mn), By Treatment Type 2017-2022
TABLE 132 Spain Rare Hematology Disease Treatment Market Value (US$ Mn), By Indication 2012-2016
TABLE 133 Spain Rare Hematology Disease Treatment Market Value (US$ Mn), By Indication 2017-2022
TABLE 134 Spain Rare Hematology Disease Treatment Market Value (US$ Mn), By Age Group 2012-2016
TABLE 135 Spain Rare Hematology Disease Treatment Market Value (US$ Mn), By Age Group 2017-2022
TABLE 136 Italy Rare Hematology Disease Treatment Market Value (US$ Mn), By Treatment Type 2012-2016
TABLE 137 Italy Rare Hematology Disease Treatment Market Value (US$ Mn), By Treatment Type 2017-2022
TABLE 138 Italy Rare Hematology Disease Treatment Market Value (US$ Mn), By Indication 2012-2016
TABLE 139 Italy Rare Hematology Disease Treatment Market Value (US$ Mn), By Indication 2017-2022
TABLE 140 Italy Rare Hematology Disease Treatment Market Value (US$ Mn), By Age Group 2012-2016
TABLE 141 Italy Rare Hematology Disease Treatment Market Value (US$ Mn), By Age Group 2017-2022
TABLE 142 Rest of Europe Rare Hematology Disease Treatment Market Value (US$ Mn), By Treatment Type 2012-2016
TABLE 143 Rest of Europe Rare Hematology Disease Treatment Market Value (US$ Mn), By Treatment Type 2017-2022
TABLE 144 Rest of Europe Rare Hematology Disease Treatment Market Value (US$ Mn), By Indication 2012-2016
TABLE 145 Rest of Europe Rare Hematology Disease Treatment Market Value (US$ Mn), By Indication 2017-2022
TABLE 146 Rest of Europe Rare Hematology Disease Treatment Market Value (US$ Mn), By Age Group 2012-2016
TABLE 147 Rest of Europe Rare Hematology Disease Treatment Market Value (US$ Mn), By Age Group 2017-2022
TABLE 148 Japan Current Expenditure on Health, (% of GDP), by Country, 2010 – 2016
TABLE 149 Japan Per Capita Health Expenditure (US$ PPP), by Country, 2010-2016
TABLE 150 Japan Per Capita Healthcare Expenditure Y-o-Y Growth (in Real terms %), by Country, 2010-2016
TABLE 151 Japan Out-of-Pocket Healthcare Expenditure, % of Healthcare Expenditure, by Country, 2010-2016
TABLE 152 Japan Per Capita Healthcare Expenditure (at Current Price, in US$), by Country, 2010-2016
TABLE 153 Japan Rare Hematology Disease Treatment Market Value (US$ Mn), By Treatment Type 2012-2016
TABLE 154 Japan Rare Hematology Disease Treatment Market Value (US$ Mn), By Treatment Type 2017-2022
TABLE 155 Japan Rare Hematology Disease Treatment Market Value (US$ Mn), By Indication 2012-2016
TABLE 156 Japan Rare Hematology Disease Treatment Market Value (US$ Mn), By Indication 2017-2022
TABLE 157 Japan Rare Hematology Disease Treatment Market Value (US$ Mn), By Age Group 2012-2016
TABLE 158 Japan Rare Hematology Disease Treatment Market Value (US$ Mn), By Age Group 2017-2022
TABLE 159 APEJ Current Expenditure on Health, (% of GDP), by Country, 2010 – 2016
TABLE 160 APEJ Per Capita Health Expenditure (US$ PPP), by Country, 2010-2016
TABLE 161 APEJ Per Capita Healthcare Expenditure Y-o-Y Growth (in Real terms %), by Country, 2010-2016
TABLE 162 APEJ Out-of-Pocket Healthcare Expenditure, % of Healthcare Expenditure, by Country, 2010-2016
TABLE 163 APEJ Per Capita Healthcare Expenditure (at Current Price, in US$), by Country, 2010-2016
TABLE 164 APEJ Rare Hematology Disease Treatment Market Value (US$ Mn), By Treatment Type 2012-2016
TABLE 165 APEJ Rare Hematology Disease Treatment Market Value (US$ Mn), By Treatment Type 2017-2022
TABLE 166 APEJ Rare Hematology Disease Treatment Market Value (US$ Mn), By Indication 2012-2016
TABLE 167 APEJ Rare Hematology Disease Treatment Market Value (US$ Mn), By Indication 2017-2022
TABLE 168 APEJ Rare Hematology Disease Treatment Market Value (US$ Mn), By Age Group 2012-2016
TABLE 169 APEJ Rare Hematology Disease Treatment Market Value (US$ Mn), By Age Group 2017-2022
TABLE 170 China Rare Hematology Disease Treatment Market Value (US$ Mn), By Treatment Type 2012-2016
TABLE 171 China Rare Hematology Disease Treatment Market Value (US$ Mn), By Treatment Type 2017-2022
TABLE 172 China Rare Hematology Disease Treatment Market Value (US$ Mn), By Indication 2012-2016
TABLE 173 China Rare Hematology Disease Treatment Market Value (US$ Mn), By Indication 2017-2022
TABLE 174 China Rare Hematology Disease Treatment Market Value (US$ Mn), By Age Group 2012-2016
TABLE 175 China Rare Hematology Disease Treatment Market Value (US$ Mn), By Age Group 2017-2022
TABLE 176 India Rare Hematology Disease Treatment Market Value (US$ Mn), By Treatment Type 2012-2016
TABLE 177 India Rare Hematology Disease Treatment Market Value (US$ Mn), By Treatment Type 2017-2022
TABLE 178 India Rare Hematology Disease Treatment Market Value (US$ Mn), By Indication 2012-2016
TABLE 179 India Rare Hematology Disease Treatment Market Value (US$ Mn), By Indication 2017-2022
TABLE 180 India Rare Hematology Disease Treatment Market Value (US$ Mn), By Age Group 2012-2016
TABLE 181 India Rare Hematology Disease Treatment Market Value (US$ Mn), By Age Group 2017-2022
TABLE 182 ASEAN Rare Hematology Disease Treatment Market Value (US$ Mn), By Treatment Type 2012-2016
TABLE 183 ASEAN Rare Hematology Disease Treatment Market Value (US$ Mn), By Treatment Type 2017-2022
TABLE 184 ASEAN Rare Hematology Disease Treatment Market Value (US$ Mn), By Indication 2012-2016
TABLE 185 ASEAN Rare Hematology Disease Treatment Market Value (US$ Mn), By Indication 2017-2022
TABLE 186 ASEAN Rare Hematology Disease Treatment Market Value (US$ Mn), By Age Group 2012-2016
TABLE 187 ASEAN Rare Hematology Disease Treatment Market Value (US$ Mn), By Age Group 2017-2022
TABLE 188 Australia & New Zealand Rare Hematology Disease Treatment Market Value (US$ Mn), By Treatment Type 2012-2016
TABLE 189 Australia & New Zealand Rare Hematology Disease Treatment Market Value (US$ Mn), By Treatment Type 2017-2022
TABLE 190 Australia & New Zealand Rare Hematology Disease Treatment Market Value (US$ Mn), By Indication 2012-2016
TABLE 191 Australia & New Zealand Rare Hematology Disease Treatment Market Value (US$ Mn), By Indication 2017-2022
TABLE 192 Australia & New Zealand Rare Hematology Disease Treatment Market Value (US$ Mn), By Age Group 2012-2016
TABLE 193 Australia & New Zealand Rare Hematology Disease Treatment Market Value (US$ Mn), By Age Group 2017-2022
TABLE 194 Rest of APEJ Rare Hematology Disease Treatment Market Value (US$ Mn), By Treatment Type 2012-2016
TABLE 195 Rest of APEJ Rare Hematology Disease Treatment Market Value (US$ Mn), By Treatment Type 2017-2022
TABLE 196 Rest of APEJ Rare Hematology Disease Treatment Market Value (US$ Mn), By Indication 2012-2016
TABLE 197 Rest of APEJ Rare Hematology Disease Treatment Market Value (US$ Mn), By Indication 2017-2022
TABLE 198 Rest of APEJ Rare Hematology Disease Treatment Market Value (US$ Mn), By Age Group 2012-2016
TABLE 199 Rest of APEJ Rare Hematology Disease Treatment Market Value (US$ Mn), By Age Group 2017-2022
TABLE 200 MEA Current Expenditure on Health, (% of GDP), by Country, 2010 – 2016
TABLE 201 MEA Per Capita Health Expenditure (US$ PPP), by Country, 2010-2016
TABLE 202 MEA Per Capita Healthcare Expenditure Y-o-Y Growth (in Real terms %), by Country, 2010-2016
TABLE 203 MEA Out-of-Pocket Healthcare Expenditure, % of Healthcare Expenditure, by Country, 2010-2016
TABLE 204 MEA Per Capita Healthcare Expenditure (at Current Price, in US$), by Country, 2010-2016
TABLE 205 MEA Rare Hematology Disease Treatment Market Value (US$ Mn), By Treatment Type 2012-2016
TABLE 206 MEA Rare Hematology Disease Treatment Market Value (US$ Mn), By Treatment Type 2017-2022
TABLE 207 MEA Rare Hematology Disease Treatment Market Value (US$ Mn), By Indication 2012-2016
TABLE 208 MEA Rare Hematology Disease Treatment Market Value (US$ Mn), By Indication 2017-2022
TABLE 209 MEA Rare Hematology Disease Treatment Market Value (US$ Mn), By Age Group 2012-2016
TABLE 210 MEA Rare Hematology Disease Treatment Market Value (US$ Mn), By Age Group 2017-2022
TABLE 211 GCC Countries Rare Hematology Disease Treatment Market Value (US$ Mn), By Treatment Type 2012-2016
TABLE 212 GCC Countries Rare Hematology Disease Treatment Market Value (US$ Mn), By Treatment Type 2017-2022
TABLE 213 GCC Countries Rare Hematology Disease Treatment Market Value (US$ Mn), By Indication 2012-2016
TABLE 214 GCC Countries Rare Hematology Disease Treatment Market Value (US$ Mn), By Indication 2017-2022
TABLE 215 GCC Countries Rare Hematology Disease Treatment Market Value (US$ Mn), By Age Group 2012-2016
TABLE 216 GCC Countries Rare Hematology Disease Treatment Market Value (US$ Mn), By Age Group 2017-2022
TABLE 217 South Africa Rare Hematology Disease Treatment Market Value (US$ Mn), By Treatment Type 2012-2016
TABLE 218 South Africa Rare Hematology Disease Treatment Market Value (US$ Mn), By Treatment Type 2017-2022
TABLE 219 South Africa Rare Hematology Disease Treatment Market Value (US$ Mn), By Indication 2012-2016
TABLE 220 South Africa Rare Hematology Disease Treatment Market Value (US$ Mn), By Indication 2017-2022
TABLE 221 South Africa Rare Hematology Disease Treatment Market Value (US$ Mn), By Age Group 2012-2016
TABLE 222 South Africa Rare Hematology Disease Treatment Market Value (US$ Mn), By Age Group 2017-2022
TABLE 223 Rest of MEA Rare Hematology Disease Treatment Market Value (US$ Mn), By Treatment Type 2012-2016
TABLE 224 Rest of MEA Rare Hematology Disease Treatment Market Value (US$ Mn), By Treatment Type 2017-2022
TABLE 225 Rest of MEA Rare Hematology Disease Treatment Market Value (US$ Mn), By Indication 2012-2016
TABLE 226 Rest of MEA Rare Hematology Disease Treatment Market Value (US$ Mn), By Indication 2017-2022
TABLE 227 Rest of MEA Rare Hematology Disease Treatment Market Value (US$ Mn), By Age Group 2012-2016
TABLE 228 Rest of MEA Rare Hematology Disease Treatment Market Value (US$ Mn), By Age Group 2017-202
List of Figures
FIG. 1 Global Rare Hematology Disease Treatment Market Value (US$ Mn), 2012-2016
FIG. 2 Global Rare Hematology Disease Treatment Market Value (US$ Mn) Forecast, 2017-2022
FIG. 3 Global Rare Hematology Disease Treatment Market Value (US$ Mn) and Y-o-Y, 2015-2022
FIG. 4 Global Plasma Derived Factors Segment Market Value (US$ Mn) By Region, 2012-2016
FIG. 5 Global Plasma Derived Factors Segment Market Value (US$ Mn) By Region, 2017-2022
FIG. 6 Global Plasma Derived Factors Segment Y-o-Y Growth Rate, By Region, 2015-2022
FIG. 7 Global Recombinant Factors Segment Market Value (US$ Mn) By Region, 2012-2016
FIG. 8 Global Recombinant Factors Segment Market Value (US$ Mn) By Region, 2017-2022
FIG. 9 Global Recombinant Factors Segment Y-o-Y Growth Rate, By Region, 2015-2022
FIG. 10 Global Hemophilia A Disease Treatment Segment Market Value (US$ Mn) By Region, 2012-2016
FIG. 11 Global Hemophilia A Disease Treatment Segment Market Value (US$ Mn) By Region, 2017-2022
FIG. 12 Global Hemophilia A Disease Treatment Segment Y-o-Y Growth Rate, By Region, 2015-2022
FIG. 13 Global Hemophilia B Disease Treatment Segment Market Value (US$ Mn) By Region, 2012-2016
FIG. 14 Global Hemophilia B Disease Treatment Segment Market Value (US$ Mn) By Region, 2017-2022
FIG. 15 Global Hemophilia B Disease Treatment Segment Y-o-Y Growth Rate, By Region, 2015-2022
FIG. 16 Global Von Wilebrand Disease Treatment Segment Market Value (US$ Mn) By Region, 2012-2016
FIG. 17 Global Von Wilebrand Disease Treatment Segment Market Value (US$ Mn) By Region, 2017-2022
FIG. 18 Global Von Wilebrand Disease Treatment Segment Y-o-Y Growth Rate, By Region, 2015-2022
FIG. 19 Global Acquired Hemophilia A Disease Treatment Segment Market Value (US$ Mn) By Region, 2012-2016
FIG. 20 Global Acquired Hemophilia A Disease Treatment Segment Market Value (US$ Mn) By Region, 2017-2022
FIG. 21 Global Acquired Hemophilia A Disease Treatment Segment Y-o-Y Growth Rate, By Region, 2015-2022
FIG. 22 Global Other Disease Treatment Segment Market Value (US$ Mn) By Region, 2012-2016
FIG. 23 Global Other Disease Treatment Segment Market Value (US$ Mn) By Region, 2017-2022
FIG. 24 Global Other Disease Treatment Segment Y-o-Y Growth Rate, By Region, 2015-2022
FIG. 25 Global Rare Hematology Disease Treatment Market for Adult (18+) Segment Market Value (US$ Mn) By Region, 2012-2016
FIG. 26 Global Rare Hematology Disease Treatment Market for Adult (18+) Segment Market Value (US$ Mn) By Region, 2017-2022
FIG. 27 Global Rare Hematology Disease Treatment Market for Adult (18+) Segment Y-o-Y Growth Rate, By Region, 2015-2022
FIG. 28 Global Rare Hematology Disease Treatment Market for Pediatric (0-17) Segment Market Value (US$ Mn) By Region, 2012-2016
FIG. 29 Global Rare Hematology Disease Treatment Market for Pediatric (0-17) Segment Market Value (US$ Mn) By Region, 2017-2022
FIG. 30 Global Rare Hematology Disease Treatment Market for Pediatric (0-17) Segment Y-o-Y Growth Rate, By Region, 2015-2022
FIG. 31 North America Rare Hematology Disease Treatment Market Value (US$ Mn), By Treatment Type 2012-2016
FIG. 32 North America Rare Hematology Disease Treatment Market Value (US$ Mn), By Treatment Type 2017-2022
FIG. 33 North America Rare Hematology Disease Treatment Market Value (US$ Mn), By Indication 2012-2016
FIG. 34 North America Rare Hematology Disease Treatment Market Value (US$ Mn), By Indication 2017-2022
FIG. 35 North America Rare Hematology Disease Treatment Market Value (US$ Mn), By Age Group 2012-2016
FIG. 36 North America Rare Hematology Disease Treatment Market Value (US$ Mn), By Age Group 2017-2022
FIG. 37 Latin America Rare Hematology Disease Treatment Market Value (US$ Mn), By Treatment Type 2012-2016
FIG. 38 Latin America Rare Hematology Disease Treatment Market Value (US$ Mn), By Treatment Type 2017-2022
FIG. 39 Latin America Rare Hematology Disease Treatment Market Value (US$ Mn), By Indication 2012-2016
FIG. 40 Latin America Rare Hematology Disease Treatment Market Value (US$ Mn), By Indication 2017-2022
FIG. 41 Latin America Rare Hematology Disease Treatment Market Value (US$ Mn), By Age Group 2012-2016
FIG. 42 Latin America Rare Hematology Disease Treatment Market Value (US$ Mn), By Age Group 2017-2022
FIG. 43 Europe Rare Hematology Disease Treatment Market Value (US$ Mn), By Treatment Type 2012-2016
FIG. 44 Europe Rare Hematology Disease Treatment Market Value (US$ Mn), By Treatment Type 2017-2022
FIG. 45 Europe Rare Hematology Disease Treatment Market Value (US$ Mn), By Indication 2012-2016
FIG. 46 Europe Rare Hematology Disease Treatment Market Value (US$ Mn), By Indication 2017-2022
FIG. 47 Europe Rare Hematology Disease Treatment Market Value (US$ Mn), By Age Group 2012-2016
FIG. 48 Europe Rare Hematology Disease Treatment Market Value (US$ Mn), By Age Group 2017-2022
FIG. 49 Japan Rare Hematology Disease Treatment Market Value (US$ Mn), By Treatment Type 2012-2016
FIG. 50 Japan Rare Hematology Disease Treatment Market Value (US$ Mn), By Treatment Type 2017-2022
FIG. 51 Japan Rare Hematology Disease Treatment Market Value (US$ Mn), By Indication 2012-2016
FIG. 52 Japan Rare Hematology Disease Treatment Market Value (US$ Mn), By Indication 2017-2022
FIG. 53 Japan Rare Hematology Disease Treatment Market Value (US$ Mn), By Age Group 2012-2016
FIG. 54 Japan Rare Hematology Disease Treatment Market Value (US$ Mn), By Age Group 2017-2022
FIG. 55 APEJ Rare Hematology Disease Treatment Market Value (US$ Mn), By Treatment Type 2012-2016
FIG. 56 APEJ Rare Hematology Disease Treatment Market Value (US$ Mn), By Treatment Type 2017-2022
FIG. 57 APEJ Rare Hematology Disease Treatment Market Value (US$ Mn), By Indication 2012-2016
FIG. 58 APEJ Rare Hematology Disease Treatment Market Value (US$ Mn), By Indication 2017-2022
FIG. 59 APEJ Rare Hematology Disease Treatment Market Value (US$ Mn), By Age Group 2012-2016
FIG. 60 APEJ Rare Hematology Disease Treatment Market Value (US$ Mn), By Age Group 2017-2022
FIG. 61 MEA Rare Hematology Disease Treatment Market Value (US$ Mn), By Treatment Type 2012-2016
FIG. 62 MEA Rare Hematology Disease Treatment Market Value (US$ Mn), By Treatment Type 2017-2022
FIG. 63 MEA Rare Hematology Disease Treatment Market Value (US$ Mn), By Indication 2012-2016
FIG. 64 MEA Rare Hematology Disease Treatment Market Value (US$ Mn), By Indication 2017-2022
FIG. 65 MEA Rare Hematology Disease Treatment Market Value (US$ Mn), By Age Group 2012-2016
FIG. 66 MEA Rare Hematology Disease Treatment Market Value (US$ Mn), By Age Group 2017-2022
Copyright © Transparency Market Research, Inc. All Rights reserved
Trust Online

Rare Hematology Market