
Reports
Reports
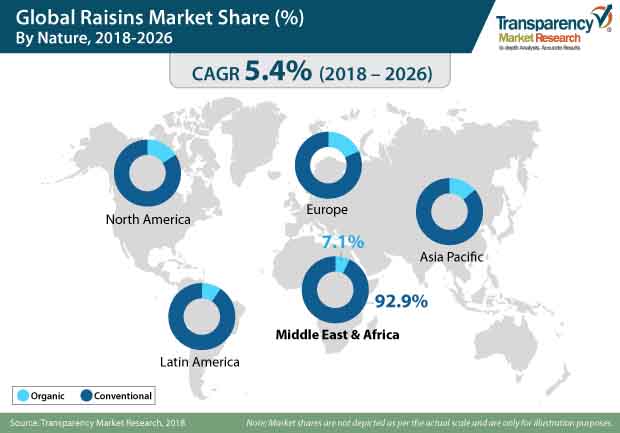
Raisins: A Credible Ingredient for Functional Foods
As raisins continue to become an integral part of the daily food intake, production has been moving away from traditional labor-intensive operations that begin with hand picking of grapes. Sensing an exponential rise in consumption of raisins, in a view of a cloud swirling around functional foods and health consciousness, growers are rapidly mechanizing their production process. Emergence of various raisin varieties and drying methods has also led to broader expansion of the industry from California, which accounts for nearly 40% of the world’s raisin production.
Transparency Market Research (TMR), in its new offering, analyzes how a move from manual to mechanical harvesting of raisins will unfold potential business opportunities for growers. The study also brings to fore credible insights of various aspects and nuances of the raisins market that can arm key stakeholders with vital information to arrive at decisions with clarity.
The Rise and Race of Raisins Market
Fluctuations in economic conditions accompanied by decreased availability of farm labor have brought a sea change in raisins industry. As consumer demand rises and mechanization makes inroads into the production process, raisins market continues to swell. In 2018, worldwide sales of raisins closed in on US$ 2,100 million. More number of players in the market are focusing on capturing the lucrative opportunities arising from global food & beverage sector.
Although a radical shift to healthy diet and lifestyle has been influencing food manufacturers to incorporate raisins and other dried fruits into their products, uncertainty of weather conditions continues to affect production volumes of grapes – thereby creating a considerable manufacturing pressure. This factor is further intensified by decreased availability of agricultural land, prompting manufactures to innovate their harvesting techniques and production processes.
Health Conscious Generation Impacts Raisins Consumption
As the wave of health consciousness has inundated the food & beverages industry with highly nutritious products, raisins market is acquiring a unique position in this space. While raisin consumption remains robust in households, sprung in the number of working individuals has especially spawned innovative offerings with raisins as essential ingredient, across different sectors of the food industry. In addition, natural and functional food ingredients have captured significant consumer attention in the recent past, leading to increased inclusion of raisins in various processed food products, such as breakfast cereals and ready-to-eat meals, which is strongly backed by their high nutritional profile.
Considering these raisin attributes and the subsequent progress of the market, raisin manufacturers are focusing on strengthening the sales of their products through direct distribution channels. Apart from adopting product innovation strategies, key players in the raisins market are emphasizing their participation in various food fairs and conferences as a branding strategy to improve relations with other key stakeholders and solidify their position in the market.
Raisins as Snacks to Align with ‘Let’s Eat Healthy’ Trend
Raisins continue to grow in popularity as health snacks; however, particularly among baby boomers and geriatric population. While the snack trend in raisins market seems to have skipped the millennial generation, leading raisins market players are reinforcing their advertorial strategies to win over this specific consumer cluster. This has been important factor in Sun-Maid’s decision to launch its first ad in over a decade, to draw attention of millennials obsessed with nostalgia. Such a strategic move is likely to set the ball rolling, and influence other stakeholders to invest and up their advertisement game.
Success Strategies to Strengthen Position in Raisins Market
Focus on E-commerce Intensifies
Expansion of customer base continues to be an influencing growth factor of the raisins market, and further stay competitive. Several manufactures are concentrating on adopting alternative distribution channels, especially E-commerce stores. Perpetual rise in the number of online shoppers, favored by the availability of wide-ranging products and ease of selection, has increased the product penetration and led to realignment of the strategies.
Organic Raisins on the Go
As ‘organic’ rapidly emerges as a new norm in health and wellness space, key manufacturers are focused on increasing ‘organic’ production of raisins. Underlying that raisins are gaining popularity in health food sector on account of the recent shift away from products with high saccharine profile, and towards products with natural ingredients, manufactures are redirecting their investments in organic farming of grapes.
The Competitive Landscape
The global raisins market shows a fair level of consolidation. Leading players such as Fruits of Turkey, Anatolia A.S., Lion Raisins, Inc., Sun-Maid Growers of California, and Kiantama Oy collectively account for 51% share of the raisins market.
Considering the nature of the product along with government regulations regarding clean labels, adoption of cleaner practices to deliver best quality products continue to be an influencing factor. Therefore, to stay competitive, many of the raisins market players are focusing on ensuring customer satisfying by offering quality products. In addition to following strict quality management procedures, manufactures have been making greater efforts to widen their product portfolio and strengthen their distribution networks to further accelerate the sales of raisins and other dried fruits.
The business strategies adopted by other key players in the raisins market are closely aligned with the prevailing status-quo in the landscape. With steady expansion of the market, a number of players are showing a duality in their approach – in addition to investing on R&D technologies to maintain the high quality of products, these companies are adopting effective advertisement methods to pave their way into different regions and establish a strong presence. It is highly likely that small-scale companies will continue to make significant investment in R&D and work on low-cost production to raise their revenue share.
The Analyst Viewpoint
Report authors maintain a positive outlook of the raisins market, which is projected to exhibit a CAGR of over 5% during the period, 2018-2026. As functional foods as well as premium products continue to gain substantial demand, manufactures will need to adopt advanced drying methods that not only increase the production but also ensure quality and safety. It is also imperative to note that organic and natural products are gradually penetrating the food and beverage market. Therefore, those market players show a higher-risk appetite and invest to align their business strategies with new trends are likely to be rewarded in the long run.
1. Global Raisins Market - Executive Summary
1.1. Global Raisins Market Country Analysis
1.2. Vertical Specific Market Penetration
1.3. Application – Product Mapping
1.4. Competition Blueprint
1.5. TMR Analysis and Recommendations
2. Market Overview
2.1. Market Introduction
2.2. Market Definition
2.3. Market Taxonomy
3. Market Dynamics
3.1. Macro-economic Factors
3.1.1. Rise in Consumption of Food Items across Globe
3.1.2. Global and Regional Per Capita Food Consumption (kcal per capita per day)
3.1.3. Population of Key Countries
3.1.4. Organic Agriculture Worldwide Statistics, 2017 (Million Hectares)
3.1.4.1. Top 10 Countries with Largest Areas of Organic Agricultural Land, 2016, Million Hectares
3.1.5. Food and Beverage Industry Overview
3.1.6. Global Modern Trade Penetration and Grocery Market by Key Countries
3.1.7. Change in Consumer Price Indexes (Percentage Change) 2018 (Forecast)
3.1.8. Global Retail Dynamics
3.2. Drivers
3.2.1. Economic Drivers
3.2.2. Supply Side Drivers
3.2.3. Demand Side Drivers
3.3. Market Restraints
3.3.1. Fluctuations in Production
3.3.2. Regulatory concerns
3.3.3. Others
3.4. Market Trends
3.5. Manufacturing Process for Raisins- An overview
3.5.1. Technological Overview
3.6. Trend Analysis- Impact on Time Line (2018-2028)
3.7. Forecast Factors – Relevance and Impact
3.8. Key Regulations By Regions
4. Sentiment Analysis
4.1. Consumer Sentiment Analysis
4.1.1. Consumer Buying Pattern
4.1.2. Development of the Specification
4.1.3. Social & Economic Influencers – Factors
4.1.4. Consumer preferences: Historical Scenario and Futuristic Approach
4.1.5. Prime Tendencies
4.1.6. Factors Affecting Consumer Preferences
4.1.7. Impact of labelling, claims, and certifications
4.1.8. Others
4.2. Social Media Sentiment Analysis
4.2.1. Consumer perception for products on social media platforms- Positive and Negative Mentions
4.2.2. Trending Brands
4.2.3. Trending Subject Titles
4.2.4. Others
5. Associated Industry and Key Indicator Assessment
5.1. Parent Industry Overview
5.1.1. Market Size and Forecast
5.1.2. Market Size and Y-o-Y Growth
5.1.3. Absolute $ Opportunity
5.2. Value Chain Analysis
6. Global Raisins Market Pricing Analysis
6.1. Price Point Assessment by Product Type
6.2. Regional Average Pricing Analysis
6.2.1. North America
6.2.2. Latin America
6.2.3. Europe
6.2.4. Asia Pacific
6.2.5. Middle East and Africa
6.3. Price Forecast till 2028
7. Global Raisins Market- Trade Analysis
7.1. Raisins Market- Exports to the World
7.1.1. List of Key Exporters
7.1.2. Key Exporting Countries/Regions- Market Share Analysis (2018E)
7.1.3. Value (US$ Mn) of Export
7.1.4. Volume (Units) of Export
7.2. Raisins Market- Imports to the World
7.2.1. List of Key Importers
7.2.2. Key importing Countries/Regions- Market Share Analysis (2018E)
7.2.3. Value (US$ Mn) of Import
7.2.4. Volume (Units) of Import
7.3. Global Raisins Market- Supply Demand Scenario (Global Production, Sales, Import, Export)
8. Global Raisins Market Analysis and Forecast
8.1. Market Size Analysis and Forecast (2018-2028)
8.1.1. Market Value (US$ Mn) and Volume (Tons) and Y-o-Y Growth
8.1.2. Absolute $ Opportunity
8.2. Global Raisins Market Scenario Forecast (Optimistic, Likely and Conservative Market Conditions)
8.2.1. Forecast Factors and Relevance of Impact
8.2.2. Regional Raisins Market Business Performance Summary
9. Global Raisins Market Analysis By Product Type
9.1. Introduction
9.1.1. Y-o-Y Growth Comparison By Product Type
9.1.2. Basis Point Share (BPS) Analysis By Product Type
9.2. Raisins Market Size (US$ Mn) and Volume (MT) Analysis & Forecast (2018-2028) By Product Type
9.2.1. Natural Seedless
9.2.2. Golden Seedless
9.2.3. Black Currant
9.2.4. Sultana
9.2.5. Muscat
9.2.6. Monukka
9.3. Market Attractiveness Analysis By Product Type
10. Global Raisins Market Analysis By Nature
10.1. Introduction
10.1.1. Y-o-Y Growth Comparison By Nature
10.1.2. Basis Point Share (BPS) Analysis By Nature
10.2. Raisins Market Size (US$ Mn) and Volume (MT) Analysis & Forecast (2018-2028) By Nature
10.2.1. Organic
10.2.2. Conventional
10.3. Market Attractiveness Analysis By Nature
11. Global Raisins Market Analysis By End User
11.1. Introduction
11.1.1. Y-o-Y Growth Comparison By End User
11.1.2. Basis Point Share (BPS) Analysis By End User
11.2. Raisins Market Size (US$ Mn) and Volume (MT) Analysis & Forecast (2018-2028) By End User
11.2.1. Food Industry
11.2.1.1. Bakery
11.2.1.2. Snacks
11.2.1.3. Dairy
11.2.1.4. Ready Meals
11.2.1.5. Confectionaries
11.2.2. Food Service Providers
11.2.3. Households
11.3. Market Attractiveness Analysis By End User
12. Global Raisins Market Analysis By Distribution Channel
12.1. Introduction
12.1.1. Y-o-Y Growth Comparison By Distribution Channel
12.1.2. Basis Point Share (BPS) Analysis By Distribution Channel
12.2. Raisins Market Size (US$ Mn) and Volume (MT) Analysis & Forecast (2018-2028) By Distribution Channel
12.2.1. Direct
12.2.2. Indirect
12.2.2.1. Store Based Retailing
12.2.2.1.1. Hypermarket/ Supermarket
12.2.2.1.2. Specialty Stores
12.2.2.1.3. Convenience Stores
12.2.2.2. Online Retailing
12.3. Market Attractiveness Analysis By End User
13. Global Raisins Market Analysis and Forecast, By Region
13.1. Introduction
13.1.1. Basis Point Share (BPS) Analysis By Region
13.1.2. Y-o-Y Growth Projections By Region
13.2. Raisins Market Size (US$ Mn) and Volume (MT) & Forecast (2018-2028) Analysis By Region
13.2.1. North America
13.2.2. Europe
13.2.3. APAC
13.2.4. Latin America
13.2.5. Middle East and Africa
13.3. Market Attractiveness Analysis By Region
14. North America Raisins Market Analysis and Forecast
14.1. Introduction
14.1.1. Basis Point Share (BPS) Analysis By Country
14.1.2. Y-o-Y Growth Projections By Country
14.2. Raisins Market Size (Value (US$) and Volume (MT) Analysis and Forecast (2018-2028)
14.2.1. Market Attractiveness By Country
14.2.1.1. U.S.
14.2.1.2. Canada
14.2.2. By Nature
14.2.3. By Product Type
14.2.4. By End User
14.2.5. By Distribution Chanel
14.3. Analysis
14.3.1. By Country
14.3.2. By Nature
14.3.3. By Product Type
14.3.4. By End User
14.3.5. By Distribution Chanel
14.4. Drivers and Restraints: Impact Analysis
15. Latin America Raisins Market Analysis and Forecast
15.1. Introduction
15.1.1. Basis Point Share (BPS) Analysis By Country
15.1.2. Y-o-Y Growth Projections By Country
15.1.3. Key Regulations
15.2. Raisins Market Size (Value (US$) and Volume (MT) Analysis and Forecast (2018-2028)
15.2.1. By Country
15.2.1.1. Brazil
15.2.1.2. Chile
15.2.1.3. Peru
15.2.1.4. Rest of Latin America
15.2.2. By Nature
15.2.3. By Product Type
15.2.4. By End User
15.2.5. By Distribution Chanel
15.3. Market Attractiveness Analysis
15.3.1. By Country
15.3.2. By Nature
15.3.3. By Product Type
15.3.4. By End User
15.3.5. By Distribution Chanel
15.4. Drivers and Restraints: Impact Analysis
16. Europe Raisins Market Analysis and Forecast
16.1. Introduction
16.1.1. Basis Point Share (BPS) Analysis By Country
16.1.2. Y-o-Y Growth Projections By Country
16.1.3. Key Regulations
16.2. Raisins Market Size (Value (US$) and Volume (MT) Analysis (2013-2018) and Forecast (2018-2028)
16.2.1. By Country
16.2.1.1. EU5
16.2.1.2. BENELUX
16.2.1.3. Nordic
16.2.1.4. Russia
16.2.1.5. Poland
16.2.1.6. Rest of Europe
16.2.2. By Nature
16.2.3. By Product Type
16.2.4. By End User
16.2.5. By Distribution Chanel
16.3. Market Attractiveness Analysis
16.3.1. By Country
16.3.2. By Nature
16.3.3. By Product Type
16.3.4. By End User
16.3.5. By Distribution Chanel
16.4. Drivers and Restraints: Impact Analysis
17. APAC Raisins Market Analysis and Forecast
17.1. Introduction
17.1.1. Basis Point Share (BPS) Analysis By Country
17.1.2. Y-o-Y Growth Projections By Country
17.1.3. Key Regulations
17.2. Raisins Market Size (Value (US$) and Volume (MT) Analysis (2013-2018) and Forecast (2018-2028)
17.2.1. By Country
17.2.1.1. China
17.2.1.2. India
17.2.1.3. Japan
17.2.1.4. Australia and New Zealand
17.2.1.5. Rest of APAC
17.2.2. By Nature
17.2.3. By Product Type
17.2.4. By End User
17.2.5. By Distribution Chanel
17.3. Market Attractiveness Analysis
17.3.1. By Country
17.3.2. By Nature
17.3.3. By Product Type
17.3.4. By End User
17.3.5. By Distribution Chanel
17.4. Drivers and Restraints: Impact Analysis
18. Middle East and Africa (MEA) RAISINS Market Analysis and Forecast
18.1. Introduction
18.1.1. Basis Point Share (BPS) Analysis By Country
18.1.2. Y-o-Y Growth Projections By Country
18.1.3. Key Regulations
18.2. Raisins Market Size (Value (US$) and Volume (MT) Analysis (2013-2018) and Forecast (2018-2028)
18.2.1. By Country
18.2.1.1. GCC Countries
18.2.1.2. Turkey
18.2.1.3. Iran
18.2.1.4. North America
18.2.1.5. South America
18.2.1.6. Rest of MEA
18.2.2. By Nature
18.2.3. By Product Type
18.2.4. By End User
18.2.5. By Distribution Chanel
18.3. Market Attractiveness Analysis
18.3.1. By Country
18.3.2. By Nature
18.3.3. By Product Type
18.3.4. By End User
18.3.5. By Distribution Chanel
18.4. Drivers and Restraints: Impact Analysis
19. Competition Assessment
19.1. Global Target Market Competition - a Dashboard View
19.2. Global Target Market Structure Analysis
19.3. Global Target Market Company Share Analysis
19.3.1. For Tier 1 Market Players, 2017
19.3.2. Company Market Share Analysis of Top 10 Players, By Region
19.4. Key Participants Market Presence (Intensity Mapping) by Region
20. Brand Assessment
20.1. Brand Identity (Brand as Product, Brand as Organization, Brand as Person, Brand as Symbol)
20.2. Target Audience and Positioning (Demographic Segmentation, Geographic Segmentation)
20.3. Brand Strategy
21. Competition Deep-dive (Manufacturers/Suppliers)
21.1. Bergin Fruit and Nut Company Inc.
21.2. Sun-Maid Growers of California
21.3. Sunbeam Foods Pty Ltd.
21.4. Geobres Nemean Currants and Sultana Raisins S.A.
21.5. Decas Cranberry Products, Inc.
21.6. Kiantama Oy
21.7. Sunsweet Growers Inc.
21.8. Citadelle Maple Syrup Producers’ Cooperative
21.9. Traina Foods, Inc.
21.10. Dole Food Company, Inc.
21.11. Lion Raisins Inc.
21.12. JAB Dried Fruit Products (Pty) Ltd
21.13. N. Sunshine Raisin Corporation
21.14. Montagu Dried Fruit and Nuts (Pty) Ltd
21.15. Vkc Nuts Private Limited
21.16. Viva Bella Orchards Inc.
22. Recommendation- Critical Success Factors
23. Research Methodology
24. Assumptions & Acronyms Used
List of Tables
Table 01: Global Raisins Market Value (US$ Mn) Forecast, By Nature, 2018–2026
Table 02: Global Raisins Market Volume (MT) Forecast, By Nature, 2018–2026
Table 03: Global Raisins Market Value (US$ Mn) Forecast, By Product Type, 2018–2026
Table 04: Global Raisins Market Volume (MT) Forecast, By Product Type, 2018–2026
Table 05: Global Raisins Market Value (US$ Mn) Forecast, By End Use, 2018–2026
Table 06: Global Raisins Market Volume (MT) Forecast, By End Use, 2018–2026
Table 07: Global Raisins Market Value (US$ Mn) Forecast, By Distribution Channel, 2018–2026
Table 08: Global Raisins Market Volume (MT) Forecast, By Distribution Channel, 2018–2026
Table 09: Global Raisins Market Value (US$ Mn) Forecast, By Region, 2018–2026
Table 10: Global Raisins Market Volume (MT) Forecast, By Region, 2018–2026
Table 11: North America Raisins Market Value (US$ Mn) Forecast, By Nature, 2018–2026
Table 12: North America Raisins Market Volume (MT) Forecast, By Nature, 2018–2026
Table 13: North America Raisins Market Value (US$ Mn) Forecast, By Product Type, 2018–2026
Table 14: North America Raisins Market Volume (MT) Forecast, By Product Type, 2018–2026
Table 15: North America Raisins Market Value (US$ Mn) Forecast, By End Use, 2018–2026
Table 16: North America Raisins Market Volume (MT) Forecast, By End Use, 2018–2026
Table 17: North America Raisins Market Value (US$ Mn) Forecast, By Distribution Channel, 2018–2026
Table 18: North America Raisins Market Volume (MT) Forecast, By Distribution Channel, 2018–2026
Table 19: North America Raisins Market Value (US$ Mn) Forecast, By Country, 2018–2026
Table 20: North America Raisins Market Volume (MT) Forecast, By Country, 2018–2026
Table 21: Latin America Raisins Market Value (US$ Mn) Forecast, By Nature, 2018–2026
Table 22: Latin America Raisins Market Volume (MT) Forecast, By Nature, 2018–2026
Table 23: Latin America Raisins Market Value (US$ Mn) Forecast, By Product Type, 2018–2026
Table 24: Latin America Raisins Market Volume (MT) Forecast, By Product Type, 2018–2026
Table 25: Latin America Raisins Market Value (US$ Mn) Forecast, By End Use, 2018–2026
Table 26: Latin America Raisins Market Volume (MT) Forecast, By End Use, 2018–2026
Table 27: Latin America Raisins Market Value (US$ Mn) Forecast, By Distribution Channel, 2018–2026
Table 28: Latin America Raisins Market Volume (MT) Forecast, By Distribution Channel, 2018–2026
Table 29: Latin America Raisins Market Value (US$ Mn) Forecast, By Country, 2018–2026
Table 30: Latin America Raisins Market Volume (MT) Forecast, By Country, 2018–2026
Table 31: Europe Raisins Market Value (US$ Mn) Forecast, By Nature, 2018–2026
Table 32: Europe Raisins Market Volume (MT) Forecast, By Nature, 2018–2026
Table 33: Europe Raisins Market Value (US$ Mn) Forecast, By Product Type, 2018–2026
Table 34: Europe Raisins Market Volume (MT) Forecast, By Product Type, 2018–2026
Table 35: Europe Raisins Market Value (US$ Mn) Forecast, By End Use, 2018–2026
Table 36: Europe Raisins Market Volume (MT) Forecast, By End Use, 2018–2026
Table 37: Europe Raisins Market Value (US$ Mn) Forecast, By Distribution Channel, 2018–2026
Table 38: Europe Raisins Market Volume (MT) Forecast, By Distribution Channel, 2018–2026
Table 39: Europe Raisins Market Value (US$ Mn) Forecast, By Country, 2018–2026
Table 40: Europe Raisins Market Volume (MT) Forecast, By Country, 2018–2026
Table 41: APAC Raisins Market Value (US$ Mn) Forecast, By Nature, 2018–2026
Table 42: APAC Raisins Market Volume (MT) Forecast, By Nature, 2018–2026
Table 43: APAC Raisins Market Value (US$ Mn) Forecast, By Product Type, 2018–2026
Table 44: APAC Raisins Market Volume (MT) Forecast, By Product Type, 2018–2026
Table 45: APAC Raisins Market Value (US$ Mn) Forecast, By End Use, 2018–2026
Table 46: APAC Raisins Market Volume (MT) Forecast, By End Use, 2018–2026
Table 47: APAC Raisins Market Value (US$ Mn) Forecast, By Distribution Channel, 2018–2026
Table 48: APAC Raisins Market Volume (MT) Forecast, By Distribution Channel, 2018–2026
Table 49: APAC Raisins Market Value (US$ Mn) Forecast, By Country, 2018–2026
Table 50: APAC Raisins Market Volume (MT) Forecast, By Country, 2018–2026
Table 51: MEA Raisins Market Value (US$ Mn) Forecast, By Nature, 2018–2026
Table 52: MEA Raisins Market Volume (MT) Forecast, By Nature, 2018–2026
Table 53: MEA Raisins Market Value (US$ Mn) Forecast, By Product Type, 2018–2026
Table 54: MEA Raisins Market Volume (MT) Forecast, By Product Type, 2018–2026
Table 55: MEA Raisins Market Value (US$ Mn) Forecast, By End Use, 2018–2026
Table 56: MEA Raisins Market Volume (MT) Forecast, By End Use, 2018–2026
Table 57: MEA Raisins Market Value (US$ Mn) Forecast, By Distribution Channel, 2018–2026
Table 58: MEA Raisins Market Volume (MT) Forecast, By Distribution Channel, 2018–2026
Table 59: MEA Raisins Market Value (US$ Mn) Forecast, By Country, 2018–2026
Table 60: MEA Raisins Market Volume (MT) Forecast, By Country, 2018–2026
List of Figures
Figure 1: Global Raisins Market Absolute $ Opportunity (US$ Mn), 2018-2028
Figure 2: Global Raisins Market Value (US$ Mn) and Volume (MT), 2013-2017
Figure 3: Global Raisins Market Value (US$ Mn) and Volume (MT) Forecast, 2018-2028
Figure 4: Global Raisins Market Volume (US$ Mn) by Product Type, 2018 & 2028
Figure 5: Global Raisins Market Value (US$ Mn) by Product Type, 2018 & 2028
Figure 6: Global Raisins Market Value Share (%) and BPS Analysis by Product Type, 2018 & 2028
Figure 7: Global Raisins Market Y-o-Y Growth (%) Projections by Product Type, 2018-2028
Figure 8: Global Raisins Market Value (US$ Mn’) Analysis by Nature, 2018 & 2028
Figure 9: Global Raisins Market Volume (MT) Analysis by Nature, 2018 & 2028
Figure 10: Global Raisins Market Value Share (%) and BPS Analysis by Nature, 2018 & 2028
Figure 11: Global Raisins Market Y-o-Y Growth (%) Projections by Nature, 2018-2028
Figure 12: Global Raisins Market Volume (US$ Mn) by End User, 2018 & 2028
Figure 13: Global Raisins Market Value (US$ Mn) by End User, 2018 & 2028
Figure 14: Global Raisins Market Value Share (%) and BPS Analysis by End User, 2018 & 2028
Figure 15: Global Raisins Market Y-o-Y Growth (%) Projections by End User, 2018-2028
Figure 16: Global Raisins Market Volume (US$ Mn) by Distribution Channel, 2018 & 2028
Figure 17: Global Raisins Market Value (US$ Mn) by Distribution Channel, 2018 & 2028
Figure 18: Global Raisins Market Value Share (%) and BPS Analysis by Distribution Channel, 2018 & 2028
Figure 19: Global Raisins Market Y-o-Y Growth (%) Projections by Distribution Channel, 2018-2028
Figure 20: Global Raisins Market Value (MT) Analysis by Region, 2018 & 2028
Figure 21: Global Raisins Market Volume (US$ Mn) Analysis by Region, 2018 & 2028
Figure 22: Global Raisins Market Value Share (%) and BPS Analysis by Region, 2018 & 2028
Figure 23: Global Raisins Market Y-o-Y Growth (%) Projections by Region, 2018-2028
Figure 24: Global Raisins Market Attractiveness Analysis, by Product Type, 2018 & 2028
Figure 25: Global Raisins Market Attractiveness Analysis, by Nature, 2018 & 2028
Figure 26: Global Raisins Market Attractiveness Analysis, by End User, 2018 & 2028
Figure 27: Global Raisins Market Attractiveness Analysis, by Distribution Channel, 2018 & 2028
Figure 28: Global Raisins Market Attractiveness Analysis, by Region, 2018 & 2028
Figure 29: North America Raisins Market Volume (US$ Mn) by Product Type, 2018 & 2028
Figure 30: North America Raisins Market Value (US$ Mn) by Product Type, 2018 & 2028
Figure 31: North America Raisins Market Value Share (%) and BPS Analysis by Product Type, 2018 & 2028
Figure 32: North America Raisins Market Y-o-Y Growth (%) Projections by Product Type, 2018-2028
Figure 33: North America Raisins Market Value (US$ Mn’) Analysis by Nature, 2018 & 2028
Figure 34: North America Raisins Market Volume (MT) Analysis by Nature, 2018 & 2028
Figure 35: North America Raisins Market Value Share (%) and BPS Analysis by Nature, 2018 & 2028
Figure 36: North America Raisins Market Y-o-Y Growth (%) Projections by Nature, 2018-2028
Figure 37: North America Raisins Market Volume (US$ Mn) by End User, 2018 & 2028
Figure 38: North America Raisins Market Value (US$ Mn) by End User, 2018 & 2028
Figure 39: North America Raisins Market Value Share (%) and BPS Analysis by End User, 2018 & 2028
Figure 40: North America Raisins Market Y-o-Y Growth (%) Projections by End User, 2018-2028
Figure 41: North America Raisins Market Volume (US$ Mn) by Distribution Channel, 2018 & 2028
Figure 42: North America Raisins Market Value (US$ Mn) by Distribution Channel, 2018 & 2028
Figure 43: North America Raisins Market Value Share (%) and BPS Analysis by Distribution Channel, 2018 & 2028
Figure 44: North America Raisins Market Y-o-Y Growth (%) Projections by Distribution Channel, 2018-2028
Figure 45: North America Raisins Market Value (MT) Analysis by Country, 2018 & 2028
Figure 46: North America Raisins Market Volume (US$ Mn) Analysis by Country, 2018 & 2028
Figure 47: North America Raisins Market Value Share (%) and BPS Analysis by Country, 2018 & 2028
Figure 48: North America Raisins Market Y-o-Y Growth (%) Projections by Country, 2018-2028
Figure 49: North America Raisins Market Attractiveness Analysis, by Product Type, 2018 & 2028
Figure 50: North America Raisins Market Attractiveness Analysis, by Nature, 2018 & 2028
Figure 51: North America Raisins Market Attractiveness Analysis, by End User, 2018 & 2028
Figure 52: North America Raisins Market Attractiveness Analysis, by Distribution Channel, 2018 & 2028
Figure 53: North America Raisins Market Attractiveness Analysis, by Country, 2018 & 2028
Figure 54: Latin America Raisins Market Volume (US$ Mn) by Product Type, 2018 & 2028
Figure 55: Latin America Raisins Market Value (US$ Mn) by Product Type, 2018 & 2028
Figure 56: Latin America Raisins Market Value Share (%) and BPS Analysis by Product Type, 2018 & 2028
Figure 57: Latin America Raisins Market Y-o-Y Growth (%) Projections by Product Type, 2018-2028
Figure 58: Latin America Raisins Market Value (US$ Mn’) Analysis by Nature, 2018 & 2028
Figure 59: Latin America Raisins Market Volume (MT) Analysis by Nature, 2018 & 2028
Figure 60: Latin America Raisins Market Value Share (%) and BPS Analysis by Nature, 2018 & 2028
Figure 61: Latin America Raisins Market Y-o-Y Growth (%) Projections by Nature, 2018-2028
Figure 62: Latin America Raisins Market Volume (US$ Mn) by End User, 2018 & 2028
Figure 63: Latin America Raisins Market Value (US$ Mn) by End User, 2018 & 2028
Figure 64: Latin America Raisins Market Value Share (%) and BPS Analysis by End User, 2018 & 2028
Figure 65: Latin America Raisins Market Y-o-Y Growth (%) Projections by End User, 2018-2028
Figure 66: Latin America Raisins Market Volume (US$ Mn) by Distribution Channel, 2018 & 2028
Figure 67: Latin America Raisins Market Value (US$ Mn) by Distribution Channel, 2018 & 2028
Figure 68: Latin America Raisins Market Value Share (%) and BPS Analysis by Distribution Channel, 2018 & 2028
Figure 69: Latin America Raisins Market Y-o-Y Growth (%) Projections by Distribution Channel, 2018-2028
Figure 70: Latin America Raisins Market Value (MT) Analysis by Country, 2018 & 2028
Figure 71: Latin America Raisins Market Volume (US$ Mn) Analysis by Country, 2018 & 2028
Figure 72: Latin America Raisins Market Value Share (%) and BPS Analysis by Country, 2018 & 2028
Figure 73: Latin America Raisins Market Y-o-Y Growth (%) Projections by Country, 2018-2028
Figure 74: Latin America Raisins Market Attractiveness Analysis, by Product Type, 2018 & 2028
Figure 75: Latin America Raisins Market Attractiveness Analysis, by Nature, 2018 & 2028
Figure 76: Latin America Raisins Market Attractiveness Analysis, by End User, 2018 & 2028
Figure 77: Latin America Raisins Market Attractiveness Analysis, by Distribution Channel, 2018 & 2028
Figure 78: Latin America Raisins Market Attractiveness Analysis, by Country, 2018 & 2028
Figure 79: Europe Raisins Market Volume (US$ Mn) by Product Type, 2018 & 2028
Figure 80: Europe Raisins Market Value (US$ Mn) by Product Type, 2018 & 2028
Figure 81: Europe Raisins Market Value Share (%) and BPS Analysis by Product Type, 2018 & 2028
Figure 82: Europe Raisins Market Y-o-Y Growth (%) Projections by Product Type, 2018-2028
Figure 83: Europe Raisins Market Value (US$ Mn’) Analysis by Nature, 2018 & 2028
Figure 84: Europe Raisins Market Volume (MT) Analysis by Nature, 2018 & 2028
Figure 85: Europe Raisins Market Value Share (%) and BPS Analysis by Nature, 2018 & 2028
Figure 86: Europe Raisins Market Y-o-Y Growth (%) Projections by Nature, 2018-2028
Figure 87: Europe Raisins Market Volume (US$ Mn) by End User, 2018 & 2028
Figure 88: Europe Raisins Market Value (US$ Mn) by End User, 2018 & 2028
Figure 89: Europe Raisins Market Value Share (%) and BPS Analysis by End User, 2018 & 2028
Figure 90: Europe Raisins Market Y-o-Y Growth (%) Projections by End User, 2018-2028
Figure 91: Europe Raisins Market Volume (US$ Mn) by Distribution Channel, 2018 & 2028
Figure 92: Europe Raisins Market Value (US$ Mn) by Distribution Channel, 2018 & 2028
Figure 93: Europe Raisins Market Value Share (%) and BPS Analysis by Distribution Channel, 2018 & 2028
Figure 94: Europe Raisins Market Y-o-Y Growth (%) Projections by Distribution Channel, 2018-2028
Figure 95: Europe Raisins Market Value (MT) Analysis by Country, 2018 & 2028
Figure 96: Europe Raisins Market Volume (US$ Mn) Analysis by Country, 2018 & 2028
Figure 97: Europe Raisins Market Value Share (%) and BPS Analysis by Country, 2018 & 2028
Figure 98: Europe Raisins Market Y-o-Y Growth (%) Projections by Country, 2018-2028
Figure 99: Europe Raisins Market Attractiveness Analysis, by Product Type, 2018 & 2028
Figure 100: Europe Raisins Market Attractiveness Analysis, by Nature, 2018 & 2028
Figure 101: Europe Raisins Market Attractiveness Analysis, by End User, 2018 & 2028
Figure 102: Europe Raisins Market Attractiveness Analysis, by Distribution Channel, 2018 & 2028
Figure 103: Europe Raisins Market Attractiveness Analysis, by Country, 2018 & 2028
Figure 104: APAC Raisins Market Volume (US$ Mn) by Product Type, 2018 & 2028
Figure 105: APAC Raisins Market Value (US$ Mn) by Product Type, 2018 & 2028
Figure 106: APAC Raisins Market Value Share (%) and BPS Analysis by Product Type, 2018 & 2028
Figure 107: APAC Raisins Market Y-o-Y Growth (%) Projections by Product Type, 2018-2028
Figure 108: APAC Raisins Market Value (US$ Mn’) Analysis by Nature, 2018 & 2028
Figure 109: APAC Raisins Market Volume (MT) Analysis by Nature, 2018 & 2028
Figure 110: APAC Raisins Market Value Share (%) and BPS Analysis by Nature, 2018 & 2028
Figure 111: APAC Raisins Market Y-o-Y Growth (%) Projections by Nature, 2018-2028
Figure 112: APAC Raisins Market Volume (US$ Mn) by End User, 2018 & 2028
Figure 113: APAC Raisins Market Value (US$ Mn) by End User, 2018 & 2028
Figure 114: APAC Raisins Market Value Share (%) and BPS Analysis by End User, 2018 & 2028
Figure 115: APAC Raisins Market Y-o-Y Growth (%) Projections by End User, 2018-2028
Figure 116: APAC Raisins Market Volume (US$ Mn) by Distribution Channel, 2018 & 2028
Figure 117: APAC Raisins Market Value (US$ Mn) by Distribution Channel, 2018 & 2028
Figure 118: APAC Raisins Market Value Share (%) and BPS Analysis by Distribution Channel, 2018 & 2028
Figure 119: APAC Raisins Market Y-o-Y Growth (%) Projections by Distribution Channel, 2018-2028
Figure 120: APAC Raisins Market Value (MT) Analysis by Country, 2018 & 2028
Figure 121: APAC Raisins Market Volume (US$ Mn) Analysis by Country, 2018 & 2028
Figure 122: APAC Raisins Market Value Share (%) and BPS Analysis by Country, 2018 & 2028
Figure 123: APAC Raisins Market Y-o-Y Growth (%) Projections by Country, 2018-2028
Figure 124: APAC Raisins Market Attractiveness Analysis, by Product Type, 2018 & 2028
Figure 125: APAC Raisins Market Attractiveness Analysis, by Nature, 2018 & 2028
Figure 126: APAC Raisins Market Attractiveness Analysis, by End User, 2018 & 2028
Figure 127: APAC Raisins Market Attractiveness Analysis, by Distribution Channel, 2018 & 2028
Figure 128: APAC Raisins Market Attractiveness Analysis, by Country, 2018 & 2028
Figure 129: MEA Raisins Market Volume (US$ Mn) by Product Type, 2018 & 2028
Figure 130: MEA Raisins Market Value (US$ Mn) by Product Type, 2018 & 2028
Figure 131: MEA Raisins Market Value Share (%) and BPS Analysis by Product Type, 2018 & 2028
Figure 132: MEA Raisins Market Y-o-Y Growth (%) Projections by Product Type, 2018-2028
Figure 133: MEA Raisins Market Value (US$ Mn’) Analysis by Nature, 2018 & 2028
Figure 134: MEA Raisins Market Volume (MT) Analysis by Nature, 2018 & 2028
Figure 135: MEA Raisins Market Value Share (%) and BPS Analysis by Nature, 2018 & 2028
Figure 136: MEA Raisins Market Y-o-Y Growth (%) Projections by Nature, 2018-2028
Figure 137: MEA Raisins Market Volume (US$ Mn) by End User, 2018 & 2028
Figure 138: MEA Raisins Market Value (US$ Mn) by End User, 2018 & 2028
Figure 139: MEA Raisins Market Value Share (%) and BPS Analysis by End User, 2018 & 2028
Figure 140: MEA Raisins Market Y-o-Y Growth (%) Projections by End User, 2018-2028
Figure 141: MEA Raisins Market Volume (US$ Mn) by Distribution Channel, 2018 & 2028
Figure 142: MEA Raisins Market Value (US$ Mn) by Distribution Channel, 2018 & 2028
Figure 143: MEA Raisins Market Value Share (%) and BPS Analysis by Distribution Channel, 2018 & 2028
Figure 144: MEA Raisins Market Y-o-Y Growth (%) Projections by Distribution Channel, 2018-2028
Figure 145: MEA Raisins Market Value (MT) Analysis by Country, 2018 & 2028
Figure 146: MEA Raisins Market Volume (US$ Mn) Analysis by Country, 2018 & 2028
Figure 147: MEA Raisins Market Value Share (%) and BPS Analysis by Country, 2018 & 2028
Figure 148: MEA Raisins Market Y-o-Y Growth (%) Projections by Country, 2018-2028
Figure 149: MEA Raisins Market Attractiveness Analysis, by Product Type, 2018 & 2028
Figure 150: MEA Raisins Market Attractiveness Analysis, by Nature, 2018 & 2028
Figure 151: MEA Raisins Market Attractiveness Analysis, by End User, 2018 & 2028
Figure 152: MEA Raisins Market Attractiveness Analysis, by Distribution Channel, 2018 & 2028
Figure 153: MEA Raisins Market Attractiveness Analysis, by Country, 2018 & 2028
Copyright © Transparency Market Research, Inc. All Rights reserved
Trust Online

Raisins Market