Pyrrolidone (2-Pyrrolidone, N-Methylpyrrolidone, N-Vinylpyrrolidone, N-Octylpyrrolidone) Market

Pyrrolidone (2-Pyrrolidone, N-Methylpyrrolidone, N-Vinylpyrrolidone, N-Octylpyrrolidone) Market for Recovery of Pure Hydrocarbons, Paints and Coatings, Desulfurization of Gases, Plastics, Agrochemicals and Other Applications - Global Industry Analysis, Size, Share, Growth, Trends and Forecast, 2014 - 2020

Pyrrolidone is a hygroscopic liquid, which is used in dehumidifying liquids. Due to this property, pyrrolidone is widely used to extract natural gas from the mixture of crude oil. Natural gas obtained in the crude form is dehumidified with the help of pyrrolidone. Demand for pyrrolidone has increased significantly due to rising demand for natural gas in developed as well as the developing economies. Therefore, desulfurization of gases is known to be the major application, followed by agrochemicals and pharmaceuticals, among others. Pyrrolidone is also used in large-scale recovery of hydrocarbons by extractive distillation. Recovery of pure hydrocarbons in petrochemical processing is expected to drive the global pyrrolidone market during the forecast period. On the other hand, pyrrolidone can lead to adverse effects on human health. This factor is anticipated to hamper the growth of the global pyrrolidone market. Increasing demand for pyrrolidone in Asia Pacific and rising demand for pyrrolidone in the pharmaceutical industry across the globe is likely to create higher opportunities for the pyrrolidone market in the near future. 

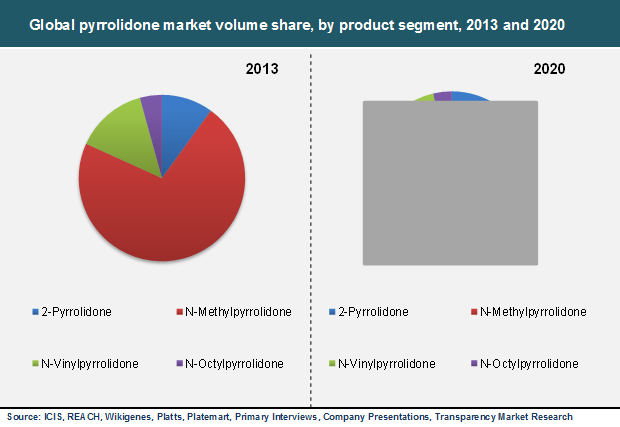
Pyrrolidone is commonly divided into four types: 2-Pyrrolidone, N-Methylpyrrolidone, N-Vinylpyrrolidone, N-Octylpyrrolidone. These are used in a wide range of applications. 2-Pyrrolidone is used as solvent, pharmaceutical drug, and in home and personal care applications, among others. N-Methylpyrrolidone is the largest product segment and accounted for over 70% share of the global pyrrolidone market revenue in 2013. N-Methylpyrrolidone is used in paints and coatings, automobile and plastics industries. N-Vinylpyrrolidone has applications in cosmetic and food & beverage industries. N-Vinylpyrrolidone accounted for the second largest share of the global pyrrolidone market in 2013. The segment is anticipated to grow further during the forecast period due to rising demand for N-Vinylpyrrolidone in the pharmaceutical industry. N-Octylpyrrolidone is used in the manufacture of chemicals, pesticides, fertilizers and textiles finishing, among other applications.

Pyrrolidone is majorly used in the petrochemical industry. It is used in desulfurization of gases and removal of pure hydrocarbons in petrochemical processing. Recovery of pure hydrocarbons in petrochemical processing accounted for approximately 25% of the global pyrrolidone market in 2013. Pyrrolidone is also used in the microelectronic fabrication industry and in the manufacture of various compounds. Compounds manufactured using pyrrolidone include cosmetics, drugs, pigments, fungicides, pesticides and herbicides. Pyrrolidone is widely used as a substitute for chlorinated hydrocarbons. Furthermore, pyrrolidone is used in the manufacture of various types of drugs such as Povidone, Piracetam, Cotinine, Doxapram and Ethosuximide. It is also used as an intermediate in the manufacture of polymers such as polyvinylpyrrolidone. 

Desulfurization of gases and recovery of pure hydrocarbons in petrochemical processing are the major applications of pyrrolidone. Thus, pyrrolidone is extensively used in North America and Europe. However, the market share of pyrrolidone is likely to decline in these regions due to strict regulations by regulatory bodies. Increasing demand for natural gas is anticipated to boost demand for pyrrolidone in developing regions such as Asia Pacific which accounted for over 40% of the market at the end of 2013. Growth in end-user industries such as paints and coatings, agrochemicals and petrochemicals in Asia Pacific is expected to augment demand for pyrrolidone in the near future. Rest of the World (RoW) includes the Middle East, Africa, Australia and Latin America. A large volume of pyrrolidone is utilized in the petrochemical industry in RoW. This is projected to fuel demand for pyrrolidone in the region during the forecast period.

The pyrrolidone market is highly concentrated, with the top five players accounting for more than 55% of the global market in 2013. Key players engaged in the manufacture of pyrrolidone include Ashland Inc, BASF SE, Shandong Qingyun Changxin Chemical Science-Tech Co. Ltd, Mitsubishi Chemical Engineering Corporation, Balaji Amines, Quzhou Jianhua Nanhang Industrial Co., Ltd., NIPPON SHOKUBAI Co. Ltd., and Zhejiang Realsun Chemical Industry Co., Ltd.

Pyrrolidone Market


    Chapter 1 Preface
    1.1 Report description
    1.2 Market segmentation
    1.3 Research scope and assumptions
    1.4 Research methodology
     
    Chapter 2 Executive Summary
    2.1 Global pyrrolidone market estimates and forecast, 2013 – 2020 (Kilo tons) (USD million)
    2.2 Global pyrrolidone market snapshot, 2013 - 2020
     
    Chapter 3 Pyrrolidone Market – Industry Analysis
    3.1 Introduction
    3.2 Value chain analysis
    3.3 Market drivers
          3.3.1 Increasing demand from natural gas sector to boost growth of pyrrolidone market
          3.3.2 Growing demand for plasticizers in end-use industries
          3.3.3 Use of pyrrolidone to recover pure hydrocarbons in petroleum industry to augment growth of pyrrolidone market
    3.4 Market restraints
          3.4.1 Volatile raw material prices to hamper growth of pyrrolidone market
          3.4.2 Strict regulatory framework for the use of phthalate plasticizers limit the pyrrolidone market growth
    3.5 Opportunities
          3.5.1 Increasing demand for natural gas in Asia Pacific to create opportunities for pyrrolidone market
          3.5.2 Rising demand for pyrrolidone in the pharmaceutical industry
    3.6 Porter’s five forces analysis
          3.6.1 Bargaining power of suppliers
          3.6.2 Bargaining power of buyers
          3.6.3 Threat from substitutes
          3.6.4 Threat of new entrants
          3.6.5 Degree of competition
    3.7 Global pyrrolidone market: Company market share analysis (2013)
    3.8 Global pyrrolidone market: Market attractiveness analysis
     
    Chapter 4 Pyrrolidone Market – Product Segment Analysis
    4.1 Global pyrrolidone market: Product segment overview
          4.1.1 Global pyrrolidone market volume share, by product segment, 2013 and 2020
    4.2 2-Pyrrolidone
          4.2.1 Global 2-Pyrrolidone market, 2013 – 2020 (Kilo Tons) (USD Million)
    4.3 N-Methylpyrrolidone
          4.3.1 Global N-Methylpyrrolidone market, 2013 – 2020 (Kilo Tons) (USD Million)
    4.4 N-Vinylpyrrolidone
          4.4.1 Global N-Vinylpyrrolidone market, 2013 – 2020 (Kilo Tons) (USD Million)
    4.5 N-Octylpyrrolidone
          4.5.1 Global pyrrolidone market for N-Octylpyrrolidone, 2013 – 2020 (Kilo Tons) (USD Million)
     
    Chapter 5 Pyrrolidone Market – Application Analysis
    5.1 Global pyrrolidone market: Application overview
          5.1.1 Global pyrrolidone market volume share, by application, 2013 and 2020
    5.2 Recovery of pure hydrocarbons in petrochemical processing
          5.2.1 Global pyrrolidone market for recovery of pure hydrocarbons in petrochemical processing, 2013–2020 (Kilo Tons) (USD Million)
    5.3 Paints and coatings
          5.3.1 Global pyrrolidone market for paints and coatings, 2013 – 2020 (Kilo Tons) (USD Million)
    5.4 Desulfurization of gases
          5.4.1 Global pyrrolidone market for desulfurization of gases, 2013 – 2020 (Kilo Tons) (USD Million)
    5.5 Plastics
          5.5.1 Global pyrrolidone market for plastics, 2013 – 2020 (Kilo Tons) (USD Million)
    5.6 Agrochemicals
          5.6.1 Global pyrrolidone market for agrochemicals, 2013 – 2020 (Kilo Tons) (USD Million)
    5.7 Others (Including pharmaceuticals, electronics, etc.)
          5.7.1 Global pyrrolidone market for other applications, 2013 – 2020 (Kilo Tons) (USD Million)
     
    Chapter 6 Pyrrolidone Market - Regional Analysis
    6.1 Global pyrrolidone market: Regional overview
          6.1.1 Global pyrrolidone volume share, by region, 2013 and 2020
    6.2 North America
          6.2.1 North America pyrrolidone market volume, by product segment, 2013 – 2020 (Kilo Tons)
          6.2.2 North America pyrrolidone market revenue, by product segment, 2013 – 2020 (USD Million)
          6.2.3 North America pyrrolidone market volume, by application, 2013 – 2020 (Kilo Tons)
          6.2.4 North America pyrrolidone market revenue, by application, 2013 – 2020 (USD Million)
    6.3 Europe
          6.3.1 Europe pyrrolidone market volume, by product segment, 2013 – 2020 (Kilo Tons)
          6.3.2 Europe pyrrolidone market revenue, by product segment, 2013 – 2020 (USD Million)
          6.3.3 Europe pyrrolidone market volume, by application, 2013 – 2020 (Kilo Tons)
          6.3.4 Europe pyrrolidone market revenue, by application, 2013 – 2020 (USD Million)
    6.4 Asia Pacific
          6.4.1 Asia Pacific pyrrolidone market volume, by product segment, 2013 – 2020 (Kilo Tons)
          6.4.2 Asia Pacific pyrrolidone market revenue, by product segment, 2013 – 2020 (USD Million)
          6.4.3 Asia Pacific pyrrolidone market volume, by application, 2013 – 2020 (Kilo Tons)
          6.4.4 Asia Pacific pyrrolidone market revenue, by application, 2013 –2020 (USD Million)
    6.5 Rest of the World (RoW)
          6.5.1 RoW pyrrolidone market volume, by product segment, 2013 – 2020 (Kilo Tons)
          6.5.2 RoW pyrrolidone market revenue, by product segment, 2013 – 2020 (USD Million)
          6.5.3 RoW pyrrolidone market volume, by application, 2013 – 2020 (Kilo Tons)
          6.5.4 RoW pyrrolidone market revenue, by application, 2013 – 2020, (USD Million)
     
    Chapter 7 Company Profiles
    7.1 Abtonsmart Chemical Co., Ltd.
          7.1.1 Company overview
          7.1.2 Product portfolio
          7.1.3 Business Strategies
    7.2 Ashland Inc.
          7.2.1 Company overview
          7.2.2 Product portfolio
          7.2.3 Financial overview
          7.2.4 Business strategies
          7.2.5 Recent developments
    7.3 BASF SE
          7.3.1 Company overview
          7.3.2 Product portfolio
          7.3.3 Financial overview
          7.3.4 Business strategies
          7.3.5 Recent developments
    7.4 Balaji Amines
          7.4.1 Company overview
          7.4.2 Product portfolio
          7.4.3 Financial overview
          7.4.4 Business strategies
    7.5 Boai NKY Pharmaceuticals Ltd.
          7.5.1 Company overview
          7.5.2 Product portfolio
          7.5.3 Financial overview
          7.5.4 Business strategies
    7.6 Hefei TNJ Chemical Industry Co., Ltd.
          7.6.1 Company overview
          7.6.2 Product portfolio
          7.6.3 Business strategies
          7.6.4 Recent developments
    7.7 J & K Chemical Ltd.
          7.7.1 Company overview
          7.7.2 Product portfolio
          7.7.3 Business strategies
    7.8 LyondellBasell Industries
          7.8.1 Company overview
          7.8.2 Product portfolio
          7.8.3 Financial overview
          7.8.4 Business strategies
    7.9 Mitsubishi Chemical Engineering Corporation
          7.9.1 Company overview
          7.9.2 Product portfolio
          7.9.3 Business strategies
    7.10 NIPPON SHOKUBAI Co., Ltd.
          7.10.1 Company overview
          7.10.2 Product portfolio
          7.10.3 Financial overview
          7.10.4 Business strategy
    7.11 Puyang Jiahua Chemical Co., Ltd.
          7.11.1 Company overview
          7.11.2 Product portfolio
          7.11.3 Business strategies
    7.12 Quzhou Jianhua Nanhang Industrial Co., Ltd
          7.12.1 Company overview
          7.12.2 Product portfolio
          7.12.3 Business strategies
          7.12.4 Recent developments
    7.13 Shandong Qingyun Changxin Chemical Science-Tech Co., Ltd.
          7.13.1 Company overview
          7.13.2 Product portfolio
          7.13.3 Business strategies
          7.13.4 Recent developments
    7.14 The Dow Chemical Company
          7.14.1 Company overview
          7.14.2 Product portfolio
          7.14.3 Financial overview
          7.14.4 Business strategies
          7.14.5 Recent developments
    7.15 Zhejiang Realsun Chemical Industry Co., Ltd
          7.15.1 Company overview
          7.15.2 Product portfolio
          7.15.3 Business strategies
    List of Tables
     
    TABLE 1 Global pyrrolidone market snapshot, 2013 - 2020
    TABLE 2 Drivers of the global pyrrolidone market: Impact analysis
    TABLE 3 Restraints of global pyrrolidone market: Impact Analysis
    TABLE 4 Production capacities of companies manufacturing pyrrolidone and its derivatives (2012-2013) (Kilo tons)
    TABLE 5 North America pyrrolidone market volume, by product segment, 2013 - 2020 (Kilo Tons)
    TABLE 6 North America pyrrolidone market revenue, by product segment, 2013 – 2020 (USD Million)
    TABLE 7 North America pyrrolidone market volume, by application 2013 – 2020 (Kilo Tons)
    TABLE 8 North America pyrrolidone market revenue, by application, 2013 – 2020, (USD Million)
    TABLE 9 Europe pyrrolidone market volume, by product segment, 2013 - 2020, (Kilo Tons)
    TABLE 10 Europe pyrrolidone market revenue, by product segment, 2013 - 2020 (USD Million)
    TABLE 11 Europe pyrrolidone market volume, by application, 2013 – 2020 (Kilo Tons)
    TABLE 12 Europe pyrrolidone market revenue, by application, 2013 – 2020 (USD Million)
    TABLE 13 Asia Pacific pyrrolidone market volume, by product segment, 2013 – 2020 (Kilo Tons)
    TABLE 14 Asia Pacific pyrrolidone market revenue, by product segment, 2013 - 2020, (USD Million)
    TABLE 15 Asia Pacific pyrrolidone market volume, by application, 2013 – 2020 (Kilo Tons)
    TABLE 16 Asia Pacific pyrrolidone market revenue, by application, 2013 – 2020 (USD Million)
    TABLE 17 RoW pyrrolidone market volume, by product segment, 2013 - 2020, (Kilo Tons)
    TABLE 18 RoW pyrrolidone market revenue, by product segment, 2013 - 2020, (USD Million)
    TABLE 19 RoW pyrrolidone market volume, by application, 2013 – 2020 (Kilo Tons)
    TABLE 20 RoW pyrrolidone market revenue, by application, 2013 – 2020 (USD Million)

    List of Figures


    FIG. 1 Global pyrrolidone market: Market segmentation

    FIG. 2 Global pyrrolidone market estimates and forecast (2013 – 2020) (USD million)

    FIG. 3 Pyrrolidone market: Value chain analysis

    FIG. 4 Global natural gas consumption, 2009-2013, (Billion cubic feet)

    FIG. 5 U.S. Energy consumption by sector, 2012-2020, (quadrillion Btu)

    FIG. 6 Global plasticizers market by volume, 2012 – 2020 (Million tons)

    FIG. 7 Global OPEC crude oil production capacity, 2008 – 2015 (Million barrels per day)

    FIG. 8 Global crude oil price, 2009 – 2014 (USD per barrel)

    FIG. 9 Porter’s five forces analysis for pyrrolidone market

    FIG. 10 Global pyrrolidone market: Company market share analysis (2013)

    FIG. 11 Global pyrrolidone market: Market attractiveness analysis

    FIG. 12 Global pyrrolidone market volume share, by product segment, 2013 and 2020

    FIG. 13 Global 2-Pyrrolidone market, 2013 – 2020 (Kilo Tons) (USD Million)

    FIG. 14 Global N-Methylpyrrolidone market, 2013 – 2020 (Kilo Tons) (USD Million)

    FIG. 15 Global N-Vinylpyrrolidone market, 2013 – 2020 (Kilo Tons) (USD Million)

    FIG. 16 Global pyrrolidone market for N-Octylpyrrolidone, 2013 – 2020 (Kilo tons) (USD Million)

    FIG. 17 Global pyrrolidone market volume share, by application, 2013 and 2020

    FIG. 18 Global pyrrolidone market for recovery of pure hydrocarbons in petrochemical processing, 2013 – 2020 (Kilo Tons) (USD Million)

    FIG. 19 Global pyrrolidone market for paints and coatings, 2013 – 2020 (Kilo Tons) (USD Million)

    FIG. 20 Global pyrrolidone market for desulfurization of gases, 2013 – 2020 (Kilo Tons) (USD Million)

    FIG. 21 Global pyrrolidone market for plastics, 2013 – 2020 (Kilo Tons) (USD Million)

    FIG. 22 Global pyrrolidone market for agrochemicals, 2013 – 2020 (Kilo Tons) (USD Million)

    FIG. 23 Global pyrrolidone market for other applications, 2013 – 2020 (Kilo Tons) (USD Million)

    FIG. 24 Global pyrrolidone market volume share, by region, 2013 and 2020

Copyright © Transparency Market Research, Inc. All Rights reserved