
Reports
Reports
According to Transparency Market Research’s latest market report titled “Push Pull Closures Market: Global Industry Analysis, Size, Share, Growth, Trends and Forecast 2018 – 2027. The push pull closures market stood at US$ 2,295.2 Mn in 2018 and is forecast to register a CAGR of 4.8 % during 2018 – 2027. The push pull closures market is estimated to be valued at US$ 3,507.4 Mn by the end of the forecast period.
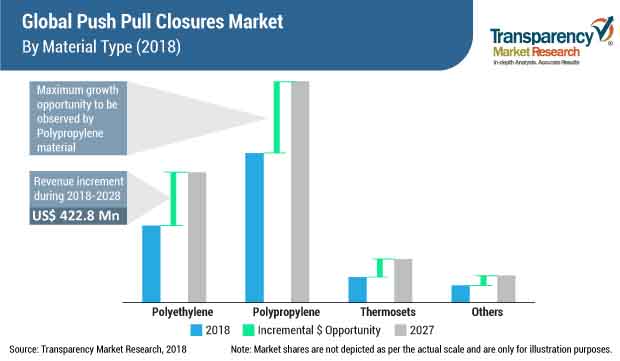
In terms of material type, the polypropylene segment is expected to be most attractive segment in the push pull closures market across the globe. Polypropylene material provides strong barrier properties and its resistance to chemicals makes it a prominent material for push pull closures. As compared to polyethylene, polypropylene provides more moisture resistance. By material type of push pull closures, the polyethylene segment accounts for more than 30% of the market value share in 2018. The demand for push pull closures is primarily driven by PET bottles, HDPE bottles, and metal bottles. Increase in consumer orientation towards hygiene is expected to boost the growth of the global push pull closures market. The rise in the sales of sports bottles will create further growth opportunities for the global push pull closures market.
The rise in the consumption levels of various end-use industries such as food & beverage, pharmaceuticals, & household goods is expected to increase the demand for push pull closures. Increase in consumer spending on convenience products is expected to boost the global push pull closures market. The sports bottles market is increasing at a good CAGR value globally, due to the changing consumer habits. Barrier properties of sports bottles ensure hygiene and are preferred by consumers. The increase in demand for smaller bottles due their compactness drives the push pull closures market. Also, the consumption of push pull closures in food, chemical, and personal care & cosmetics industries has witnessed a significant increase. All the above factors are expected to boost the sales of global push pull closures.
In order to reduce packaging costs and increase the profitability margins, food & beverage manufacturers are opting for closure-less packaging products such as closure-less tetra pack flexible pouches. This factor is creating high competition for push pull closures manufacturers. In today’s global economy, the strict rules and regulations by various governments against the use of plastic may hinder the growth of the global push pull closures market. Overall, the outlook for the global push pull closures market is expected to remain positive, during the forecast period.
The global push pull closures market is segmented by diameter, material, and end-use industry. The beverage industry is expected to dominate the global push pull closures market.
By diameter, the global push pull closures market is segmented into:
By material type, the global push pull closures market is segmented into:
By end-use industry, the global push pull closures market is segmented into:
The Asia Pacific excluding Japan (APEJ) region is estimated to account for the largest share in the global push pull closures market. The MEA region is estimated to contribute a small but rapidly growing market share in the global push pull closures market. The growth in the push pull closure market in Latin America is expected to be moderate during the forecast period.
Key players which have been profiled in the global push pull closures market report include Closure Systems International, Inc. , Mold-Rite Plastics, LLC, Georg MENSHEN GmbH & Co. KG, CL Smith Company, Global Closure Systems, Bericap GmbH and Co KG, Closure Systems International, Inc., O. Berk Company, LLC, Silgan Plastic Closures Solutions, RPC.M&H Plastics. Ltd., Global Closure Systems. , Amcor Limited, United Caps Luxembourg S.A, Jiangsu Changjiang Lids Co., Ltd, and Blackhawk Molding Co. Inc.
Chapter 1. Global Push Pull Closures Market - Executive Summary
Chapter 2. Global Push Pull Closures Market Overview
2.1. Introduction
2.2. Global Push Pull Closures Market Taxonomy
2.2.1. Global Push Pull Closures Market Definition
2.3. Global Economic Outlook
2.4. Global Packaging Industry Outlook
2.5. Global Push Pull Closures Market Size (US$ Mn & Volume (Mn Units)) and Forecast, 2013-2027
2.5.1. Global Push Pull Closures Market Y-o-Y Growth
2.6. Global Push Pull Closures Market Dynamics
2.7. Supply Chain
2.8. Cost Structure
2.9. Pricing Analysis
2.10. Opportunity Assessment
2.11. Forecast Scenario
2.12. Porters Five Forces Analysis
2.13. Macro- Economic Indicators
2.14. Market Positioning Assessment
2.15. Key Participants Market Presence (Intensity Map) By Region
Chapter 3. Global Push Pull Closures Market Analysis and Forecast 2013-2027
3.1. Global Push Pull Closures Market Size and Forecast By By Diameter, 2013-2027
3.1.1. Upto 24 mm Market Size and Forecast, 2013-2027
3.1.1.1. Revenue (US$ Mn) & Volume (Mn Units) Comparison, By Region
3.1.1.2. Market Share Comparison, By Region
3.1.1.3. Y-o-Y growth Comparison, By Region
3.1.2. 24-34 mm Market Size and Forecast, 2013-2027
3.1.2.1. Revenue (US$ Mn) & Volume (Mn Units) Comparison, By Region
3.1.2.2. Market Share Comparison, By Region
3.1.2.3. Y-o-Y growth Comparison, By Region
3.1.3. 34-44mm Market Size and Forecast, 2013-2027
3.1.3.1. Revenue (US$ Mn) & Volume (Mn Units) Comparison, By Region
3.1.3.2. Market Share Comparison, By Region
3.1.3.3. Y-o-Y growth Comparison, By Region
3.1.4. Above 44 mm Market Size and Forecast, 2013-2027
3.1.4.1. Revenue (US$ Mn) & Volume (Mn Units) Comparison, By Region
3.1.4.2. Market Share Comparison, By Region
3.1.4.3. Y-o-Y growth Comparison, By Region
3.2. Global Push Pull Closures Market Size and Forecast By By Material, 2013-2027
3.2.1. PE Market Size and Forecast, 2013-2027
3.2.1.1. Revenue (US$ Mn) & Volume (Mn Units) Comparison, By Region
3.2.1.2. Market Share Comparison, By Region
3.2.1.3. Y-o-Y growth Comparison, By Region
3.2.2. Polypropylene (PP) Market Size and Forecast, 2013-2027
3.2.2.1. Revenue (US$ Mn) & Volume (Mn Units) Comparison, By Region
3.2.2.2. Market Share Comparison, By Region
3.2.2.3. Y-o-Y growth Comparison, By Region
3.2.3. Others (PS,PET) Market Size and Forecast, 2013-2027
3.2.3.1. Revenue (US$ Mn) & Volume (Mn Units) Comparison, By Region
3.2.3.2. Market Share Comparison, By Region
3.2.3.3. Y-o-Y growth Comparison, By Region
3.2.4. Thermosets Market Size and Forecast, 2013-2027
3.2.4.1. Revenue (US$ Mn) & Volume (Mn Units) Comparison, By Region
3.2.4.2. Market Share Comparison, By Region
3.2.4.3. Y-o-Y growth Comparison, By Region
3.3. Global Push Pull Closures Market Size and Forecast By End Use Industry, 2013-2027
3.3.1. Beverages Market Size and Forecast, 2013-2027
3.3.1.1. Revenue (US$ Mn) & Volume (Mn Units) Comparison, By Region
3.3.1.2. Market Share Comparison, By Region
3.3.1.3. Y-o-Y growth Comparison, By Region
3.3.2. Food Market Size and Forecast, 2013-2027
3.3.2.1. Revenue (US$ Mn) & Volume (Mn Units) Comparison, By Region
3.3.2.2. Market Share Comparison, By Region
3.3.2.3. Y-o-Y growth Comparison, By Region
3.3.3. Pharmaceuticals Market Size and Forecast, 2013-2027
3.3.3.1. Revenue (US$ Mn) & Volume (Mn Units) Comparison, By Region
3.3.3.2. Market Share Comparison, By Region
3.3.3.3. Y-o-Y growth Comparison, By Region
3.3.4. Households Market Size and Forecast, 2013-2027
3.3.4.1. Revenue (US$ Mn) & Volume (Mn Units) Comparison, By Region
3.3.4.2. Market Share Comparison, By Region
3.3.4.3. Y-o-Y growth Comparison, By Region
3.3.5. Cosmetic & Personal Care Market Size and Forecast, 2013-2027
3.3.5.1. Revenue (US$ Mn) & Volume (Mn Units) Comparison, By Region
3.3.5.2. Market Share Comparison, By Region
3.3.5.3. Y-o-Y growth Comparison, By Region
3.3.6. Others (Chemicals & Fertilizers) Market Size and Forecast, 2013-2027
3.3.6.1. Revenue (US$ Mn) & Volume (Mn Units) Comparison, By Region
3.3.6.2. Market Share Comparison, By Region
3.3.6.3. Y-o-Y growth Comparison, By Region
Chapter 4. North America Push Pull Closures Market Size and Forecast, 2013-2027
4.1. Revenue (US$ Mn) & Volume (Mn Units) Comparison, By Country
4.2. Revenue (US$ Mn) & Volume (Mn Units) Comparison, By By Diameter
4.3. Revenue (US$ Mn) & Volume (Mn Units) Comparison, By By Material
4.4. Revenue (US$ Mn) & Volume (Mn Units) Comparison, By End Use Industry
Chapter 5. Latin America Push Pull Closures Market Size and Forecast, 2013-2027
5.1. Revenue (US$ Mn) & Volume (Mn Units) Comparison, By Country
5.2. Revenue (US$ Mn) & Volume (Mn Units) Comparison, By By Diameter
5.3. Revenue (US$ Mn) & Volume (Mn Units) Comparison, By By Material
5.4. Revenue (US$ Mn) & Volume (Mn Units) Comparison, By End Use Industry
Chapter 6. Europe Push Pull Closures Market Size and Forecast, 2013-2027
6.1. Revenue (US$ Mn) & Volume (Mn Units) Comparison, By Country
6.2. Revenue (US$ Mn) & Volume (Mn Units) Comparison, By By Diameter
6.3. Revenue (US$ Mn) & Volume (Mn Units) Comparison, By By Material
6.4. Revenue (US$ Mn) & Volume (Mn Units) Comparison, By End Use Industry
Chapter 7. Japan Push Pull Closures Market Size and Forecast, 2013-2027
7.1. Revenue (US$ Mn) & Volume (Mn Units) Comparison, By Country
7.2. Revenue (US$ Mn) & Volume (Mn Units) Comparison, By By Diameter
7.3. Revenue (US$ Mn) & Volume (Mn Units) Comparison, By By Material
7.4. Revenue (US$ Mn) & Volume (Mn Units) Comparison, By End Use Industry
Chapter 8. APEJ Push Pull Closures Market Size and Forecast, 2013-2027
8.1. Revenue (US$ Mn) & Volume (Mn Units) Comparison, By Country
8.2. Revenue (US$ Mn) & Volume (Mn Units) Comparison, By By Diameter
8.3. Revenue (US$ Mn) & Volume (Mn Units) Comparison, By By Material
8.4. Revenue (US$ Mn) & Volume (Mn Units) Comparison, By End Use Industry
Chapter 9. MEA Push Pull Closures Market Size and Forecast, 2013-2027
9.1. Revenue (US$ Mn) & Volume (Mn Units) Comparison, By Country
9.2. Revenue (US$ Mn) & Volume (Mn Units) Comparison, By By Diameter
9.3. Revenue (US$ Mn) & Volume (Mn Units) Comparison, By By Material
9.4. Revenue (US$ Mn) & Volume (Mn Units) Comparison, By End Use Industry
Chapter 10. Global Snap-on Closures Market Company Share, Competition Landscape and Company Profiles
10.1. Company Share Analysis
10.2. Global Snap-on Closures Market: Market Structure
10.3. Competition Landscape
10.4. Company Profiles
10.4.1. Closure Systems International, Inc.
10.4.2. Mold-Rite Plastics, LLC
10.4.3. Georg MENSHEN GmbH & Co. KG
10.4.4. CL Smith Company
10.4.5. Global Closure Systems
10.4.6. Bericap GmbH and Co KG
10.4.7. Closure Systems International, Inc.
10.4.8. O. Berk Company, LLC
10.4.9. Silgan Plastic Closures Solutions
10.4.10. RPC.M&H Plastics. Ltd.
10.4.11. Global Closure Systems.
10.4.12. Amcor Limited
10.4.13. United Caps Luxembourg S.A
10.4.14. Jiangsu Changjiang Lids Co., Ltd
10.4.15. Blackhawk Molding Co. Inc.
Chapter 11. TMR Research Methodology
11.1. To Begin With
11.2. How we Develop Base Year Data
11.3. Overall Approach Explained Visually
11.4. To be Noted
11.5. Average Pricing Methodology
11.6. Forecasting Methodology
11.7. For Profiling Competitors in the Market
List of Tables
TABLE 1 Global Push Pull Closures Market Value (US$ Mn) & Volume (Mn Units), 2013-2018
TABLE 2 Global Push Pull Closures Market Value (US$ Mn) & Volume (Mn Units), 2019-2027
TABLE 3 Global Push Pull Closures Market Value (US$ Mn) & Volume (Mn Units) and Y-o-Y, 2018-2027
TABLE 4 Global Upto 24 mm Segment Value (US$ Mn) & Volume (Mn Units), By Region 2013-2018
TABLE 5 Global Upto 24 mm Segment Value (US$ Mn) & Volume (Mn Units), By Region 2019-2027
TABLE 6 Global Upto 24 mm Segment Market Share, By Region 2013-2018
TABLE 7 Global Upto 24 mm Segment Market Share, By Region 2019-2027
TABLE 8 Global Upto 24 mm Segment Y-o-Y, By Region 2018-2027
TABLE 9 Global 24-34 mm Segment Value (US$ Mn) & Volume (Mn Units), By Region 2013-2018
TABLE 10 Global 24-34 mm Segment Value (US$ Mn) & Volume (Mn Units), By Region 2019-2027
TABLE 11 Global 24-34 mm Segment Market Share, By Region 2013-2018
TABLE 12 Global 24-34 mm Segment Market Share, By Region 2019-2027
TABLE 13 Global 24-34 mm Segment Y-o-Y, By Region 2018-2027
TABLE 14 Global 34-44mm Segment Value (US$ Mn) & Volume (Mn Units), By Region 2013-2018
TABLE 15 Global 34-44mm Segment Value (US$ Mn) & Volume (Mn Units), By Region 2019-2027
TABLE 16 Global 34-44 mm Segment Market Share, By Region 2013-2018
TABLE 17 Global 34-44 mm Segment Market Share, By Region 2019-2027
TABLE 18 Global 34-44 mm Segment Y-o-Y, By Region 2018-2027
TABLE 19 Global Above 44 mm Segment Value (US$ Mn) & Volume (Mn Units), By Region 2013-2018
TABLE 20 Global Above 44 mm Segment Value (US$ Mn) & Volume (Mn Units), By Region 2019-2027
TABLE 21 Global Above 44 mm Segment Market Share, By Region 2013-2018
TABLE 22 Global Above 44 mm Segment Market Share, By Region 2019-2027
TABLE 23 Global Above 44 mm Segment Y-o-Y, By Region 2018-2027
TABLE 24 Global PE Segment Value (US$ Mn) & Volume (Mn Units), By Region 2013-2018
TABLE 25 Global PE Segment Value (US$ Mn) & Volume (Mn Units), By Region 2019-2027
TABLE 26 Global PE Segment Market Share, By Region 2013-2018
TABLE 27 Global PE Segment Market Share, By Region 2019-2027
TABLE 28 Global PE Segment Y-o-Y, By Region 2018-2027
TABLE 29 Global Polypropylene (PP) Segment Value (US$ Mn) & Volume (Mn Units), By Region 2013-2018
TABLE 30 Global Polypropylene (PP) Segment Value (US$ Mn) & Volume (Mn Units), By Region 2019-2027
TABLE 31 Global Polypropylene (PP) Segment Market Share, By Region 2013-2018
TABLE 32 Global Polypropylene (PP) Segment Market Share, By Region 2019-2027
TABLE 33 Global Polypropylene (PP) Segment Y-o-Y, By Region 2018-2027
TABLE 34 Global Others (PS, PET) Segment Value (US$ Mn) & Volume (Mn Units), By Region 2013-2018
TABLE 35 Global Others (PS, PET) Segment Value (US$ Mn) & Volume (Mn Units), By Region 2019-2027
TABLE 36 Global Others (PS, PET) Segment Market Share, By Region 2013-2018
TABLE 37 Global Others (PS, PET) Segment Market Share, By Region 2019-2027
TABLE 38 Global Others (PS, PET) Segment Y-o-Y, By Region 2018-2027
TABLE 39 Global Thermosets Segment Value (US$ Mn) & Volume (Mn Units), By Region 2013-2018
TABLE 40 Global Thermosets Segment Value (US$ Mn) & Volume (Mn Units), By Region 2019-2027
TABLE 41 Global Thermosets Segment Market Share, By Region 2013-2018
TABLE 42 Global Thermosets Segment Market Share, By Region 2019-2027
TABLE 43 Global Thermosets Segment Y-o-Y, By Region 2018-2027
TABLE 44 Global Beverages Segment Value (US$ Mn) & Volume (Mn Units), By Region 2013-2018
TABLE 45 Global Beverages Segment Value (US$ Mn) & Volume (Mn Units), By Region 2019-2027
TABLE 46 Global Beverages Segment Market Share, By Region 2013-2018
TABLE 47 Global Beverages Segment Market Share, By Region 2019-2027
TABLE 48 Global Beverages Segment Y-o-Y, By Region 2018-2027
TABLE 49 Global Food Segment Value (US$ Mn) & Volume (Mn Units), By Region 2013-2018
TABLE 50 Global Food Segment Value (US$ Mn) & Volume (Mn Units), By Region 2019-2027
TABLE 51 Global Food Segment Market Share, By Region 2013-2018
TABLE 52 Global Food Segment Market Share, By Region 2019-2027
TABLE 53 Global Food Segment Y-o-Y, By Region 2018-2027
TABLE 54 Global Pharmaceuticals Segment Value (US$ Mn) & Volume (Mn Units), By Region 2013-2018
TABLE 55 Global Pharmaceuticals Segment Value (US$ Mn) & Volume (Mn Units), By Region 2019-2027
TABLE 56 Global Pharmaceuticals Segment Market Share, By Region 2013-2018
TABLE 57 Global Pharmaceuticals Segment Market Share, By Region 2019-2027
TABLE 58 Global Pharmaceuticals Segment Y-o-Y, By Region 2018-2027
TABLE 59 Global Households Segment Value (US$ Mn) & Volume (Mn Units), By Region 2013-2018
TABLE 60 Global Households Segment Value (US$ Mn) & Volume (Mn Units), By Region 2019-2027
TABLE 61 Global Households Segment Market Share, By Region 2013-2018
TABLE 62 Global Households Segment Market Share, By Region 2019-2027
TABLE 63 Global Households Segment Y-o-Y, By Region 2018-2027
TABLE 64 Global Cosmetic & Personal Care Segment Value (US$ Mn) & Volume (Mn Units), By Region 2013-2018
TABLE 65 Global Cosmetic & Personal Care Segment Value (US$ Mn) & Volume (Mn Units), By Region 2019-2027
TABLE 66 Global Cosmetic & Personal Care Segment Market Share, By Region 2013-2018
TABLE 67 Global Cosmetic & Personal Care Segment Market Share, By Region 2019-2027
TABLE 68 Global Cosmetic & Personal Care Segment Y-o-Y, By Region 2018-2027
TABLE 69 Global Others (Chemicals & Fertilizers) Segment Value (US$ Mn) & Volume (Mn Units), By Region 2013-2018
TABLE 70 Global Others (Chemicals & Fertilizers) Segment Value (US$ Mn) & Volume (Mn Units), By Region 2019-2027
TABLE 71 Global Others (Chemicals & Fertilizers) Segment Market Share, By Region 2013-2018
TABLE 72 Global Others (Chemicals & Fertilizers) Segment Market Share, By Region 2019-2027
TABLE 73 Global Others (Chemicals & Fertilizers) Segment Y-o-Y, By Region 2018-2027
TABLE 74 North America Push Pull Closures Market Value (US$ Mn) & Volume (Mn Units), By Country 2013-2018
TABLE 75 North America Push Pull Closures Market Value (US$ Mn) & Volume (Mn Units), By Country 2019-2027
TABLE 76 North America Push Pull Closures Market Value (US$ Mn) & Volume (Mn Units), By By Diameter 2013-2018
TABLE 77 North America Push Pull Closures Market Value (US$ Mn) & Volume (Mn Units), By By Diameter 2019-2027
TABLE 78 North America Push Pull Closures Market Value (US$ Mn) & Volume (Mn Units), By By Material 2013-2018
TABLE 79 North America Push Pull Closures Market Value (US$ Mn) & Volume (Mn Units), By By Material 2019-2027
TABLE 80 North America Push Pull Closures Market Value (US$ Mn) & Volume (Mn Units), By End Use Industry 2013-2018
TABLE 81 North America Push Pull Closures Market Value (US$ Mn) & Volume (Mn Units), By End Use Industry 2019-2027
TABLE 82 Latin America Push Pull Closures Market Value (US$ Mn) & Volume (Mn Units), By Country 2013-2018
TABLE 83 Latin America Push Pull Closures Market Value (US$ Mn) & Volume (Mn Units), By Country 2019-2027
TABLE 84 Latin America Push Pull Closures Market Value (US$ Mn) & Volume (Mn Units), By By Diameter 2013-2018
TABLE 85 Latin America Push Pull Closures Market Value (US$ Mn) & Volume (Mn Units), By By Diameter 2019-2027
TABLE 86 Latin America Push Pull Closures Market Value (US$ Mn) & Volume (Mn Units), By By Material 2013-2018
TABLE 87 Latin America Push Pull Closures Market Value (US$ Mn) & Volume (Mn Units), By By Material 2019-2027
TABLE 88 Latin America Push Pull Closures Market Value (US$ Mn) & Volume (Mn Units), By End Use Industry 2013-2018
TABLE 89 Latin America Push Pull Closures Market Value (US$ Mn) & Volume (Mn Units), By End Use Industry 2019-2027
TABLE 90 Europe Push Pull Closures Market Value (US$ Mn) & Volume (Mn Units), By Country 2013-2018
TABLE 91 Europe Push Pull Closures Market Value (US$ Mn) & Volume (Mn Units), By Country 2019-2027
TABLE 92 Europe Push Pull Closures Market Value (US$ Mn) & Volume (Mn Units), By By Diameter 2013-2018
TABLE 93 Europe Push Pull Closures Market Value (US$ Mn) & Volume (Mn Units), By By Diameter 2019-2027
TABLE 94 Europe Push Pull Closures Market Value (US$ Mn) & Volume (Mn Units), By By Material 2013-2018
TABLE 95 Europe Push Pull Closures Market Value (US$ Mn) & Volume (Mn Units), By By Material 2019-2027
TABLE 96 Europe Push Pull Closures Market Value (US$ Mn) & Volume (Mn Units), By End Use Industry 2013-2018
TABLE 97 Europe Push Pull Closures Market Value (US$ Mn) & Volume (Mn Units), By End Use Industry 2019-2027
TABLE 98 Japan Push Pull Closures Market Value (US$ Mn) & Volume (Mn Units), By Country 2013-2018
TABLE 99 Japan Push Pull Closures Market Value (US$ Mn) & Volume (Mn Units), By Country 2019-2027
TABLE 100 Japan Push Pull Closures Market Value (US$ Mn) & Volume (Mn Units), By By Diameter 2013-2018
TABLE 101 Japan Push Pull Closures Market Value (US$ Mn) & Volume (Mn Units), By By Diameter 2019-2027
TABLE 102 Japan Push Pull Closures Market Value (US$ Mn) & Volume (Mn Units), By By Material 2013-2018
TABLE 103 Japan Push Pull Closures Market Value (US$ Mn) & Volume (Mn Units), By By Material 2019-2027
TABLE 104 Japan Push Pull Closures Market Value (US$ Mn) & Volume (Mn Units), By End Use Industry 2013-2018
TABLE 105 Japan Push Pull Closures Market Value (US$ Mn) & Volume (Mn Units), By End Use Industry 2019-2027
TABLE 106 APEJ Push Pull Closures Market Value (US$ Mn) & Volume (Mn Units), By Country 2013-2018
TABLE 107 APEJ Push Pull Closures Market Value (US$ Mn) & Volume (Mn Units), By Country 2019-2027
TABLE 108 APEJ Push Pull Closures Market Value (US$ Mn) & Volume (Mn Units), By By Diameter 2013-2018
TABLE 109 APEJ Push Pull Closures Market Value (US$ Mn) & Volume (Mn Units), By By Diameter 2019-2027
TABLE 110 APEJ Push Pull Closures Market Value (US$ Mn) & Volume (Mn Units), By By Material 2013-2018
TABLE 111 APEJ Push Pull Closures Market Value (US$ Mn) & Volume (Mn Units), By By Material 2019-2027
TABLE 112 APEJ Push Pull Closures Market Value (US$ Mn) & Volume (Mn Units), By End Use Industry 2013-2018
TABLE 113 APEJ Push Pull Closures Market Value (US$ Mn) & Volume (Mn Units), By End Use Industry 2019-2027
TABLE 114 MEA Push Pull Closures Market Value (US$ Mn) & Volume (Mn Units), By Country 2013-2018
TABLE 115 MEA Push Pull Closures Market Value (US$ Mn) & Volume (Mn Units), By Country 2019-2027
TABLE 116 MEA Push Pull Closures Market Value (US$ Mn) & Volume (Mn Units), By By Diameter 2013-2018
TABLE 117 MEA Push Pull Closures Market Value (US$ Mn) & Volume (Mn Units), By By Diameter 2019-2027
TABLE 118 MEA Push Pull Closures Market Value (US$ Mn) & Volume (Mn Units), By By Material 2013-2018
TABLE 119 MEA Push Pull Closures Market Value (US$ Mn) & Volume (Mn Units), By By Material 2019-2027
TABLE 120 MEA Push Pull Closures Market Value (US$ Mn) & Volume (Mn Units), By End Use Industry 2013-2018
TABLE 121 MEA Push Pull Closures Market Value (US$ Mn) & Volume (Mn Units), By End Use Industry 2019-2027
List of Figures
FIG. 1 Global Push Pull Closures Market Value (US$ Mn), 2013-2018
FIG. 2 Global Push Pull Closures Market Value (US$ Mn) Forecast, 2019-2027
FIG. 3 Global Push Pull Closures Market Value (US$ Mn) and Y-o-Y, 2018-2027
FIG. 4 Global Upto 24 mm Segment Market Value (US$ Mn) By Region, 2013-2018
FIG. 5 Global Upto 24 mm Segment Market Value (US$ Mn) By Region, 2019-2027
FIG. 6 Global Upto 24 mm Segment Y-o-Y Growth Rate, By Region, 2018-2027
FIG. 7 Global 24-34 mm Segment Market Value (US$ Mn) By Region, 2013-2018
FIG. 8 Global 24-34 mm Segment Market Value (US$ Mn) By Region, 2019-2027
FIG. 9 Global 24-34 mm Segment Y-o-Y Growth Rate, By Region, 2018-2027
FIG. 10 Global 34-44mm Segment Market Value (US$ Mn) By Region, 2013-2018
FIG. 11 Global 34-44mm Segment Market Value (US$ Mn) By Region, 2019-2027
FIG. 12 Global 34-44mm Segment Y-o-Y Growth Rate, By Region, 2018-2027
FIG. 13 Global Above 44 mm Segment Market Value (US$ Mn) By Region, 2013-2018
FIG. 14 Global Above 44 mm Segment Market Value (US$ Mn) By Region, 2019-2027
FIG. 15 Global Above 44 mm Segment Y-o-Y Growth Rate, By Region, 2018-2027
FIG. 16 Global PE Segment Market Value (US$ Mn) By Region, 2013-2018
FIG. 17 Global PE Segment Market Value (US$ Mn) By Region, 2019-2027
FIG. 18 Global PE Segment Y-o-Y Growth Rate, By Region, 2018-2027
FIG. 19 Global Polypropylene (PP) Segment Market Value (US$ Mn) By Region, 2013-2018
FIG. 20 Global Polypropylene (PP) Segment Market Value (US$ Mn) By Region, 2019-2027
FIG. 21 Global Polypropylene (PP) Segment Y-o-Y Growth Rate, By Region, 2018-2027
FIG. 22 Global Others (PS, PET) Segment Market Value (US$ Mn) By Region, 2013-2018
FIG. 23 Global Others (PS, PET) Segment Market Value (US$ Mn) By Region, 2019-2027
FIG. 24 Global Others (PS, PET) Segment Y-o-Y Growth Rate, By Region, 2018-2027
FIG. 25 Global Thermosets Segment Market Value (US$ Mn) By Region, 2013-2018
FIG. 26 Global Thermosets Segment Market Value (US$ Mn) By Region, 2019-2027
FIG. 27 Global Thermosets Segment Y-o-Y Growth Rate, By Region, 2018-2027
FIG. 28 Global Beverages Segment Market Value (US$ Mn) By Region, 2013-2018
FIG. 29 Global Beverages Segment Market Value (US$ Mn) By Region, 2019-2027
FIG. 30 Global Beverages Segment Y-o-Y Growth Rate, By Region, 2018-2027
FIG. 31 Global Food Segment Market Value (US$ Mn) By Region, 2013-2018
FIG. 32 Global Food Segment Market Value (US$ Mn) By Region, 2019-2027
FIG. 33 Global Food Segment Y-o-Y Growth Rate, By Region, 2018-2027
FIG. 34 Global Pharmaceuticals Segment Market Value (US$ Mn) By Region, 2013-2018
FIG. 35 Global Pharmaceuticals Segment Market Value (US$ Mn) By Region, 2019-2027
FIG. 36 Global Pharmaceuticals Segment Y-o-Y Growth Rate, By Region, 2018-2027
FIG. 37 Global Households Segment Market Value (US$ Mn) By Region, 2013-2018
FIG. 38 Global Households Segment Market Value (US$ Mn) By Region, 2019-2027
FIG. 39 Global Households Segment Y-o-Y Growth Rate, By Region, 2018-2027
FIG. 40 Global Cosmetic & Personal Care Segment Market Value (US$ Mn) By Region, 2013-2018
FIG. 41 Global Cosmetic & Personal Care Segment Market Value (US$ Mn) By Region, 2019-2027
FIG. 42 Global Cosmetic & Personal Care Segment Y-o-Y Growth Rate, By Region, 2018-2027
FIG. 43 Global Others (Chemicals & Fertilizers) Segment Market Value (US$ Mn) By Region, 2013-2018
FIG. 44 Global Others (Chemicals & Fertilizers) Segment Market Value (US$ Mn) By Region, 2019-2027
FIG. 45 Global Others (Chemicals & Fertilizers) Segment Y-o-Y Growth Rate, By Region, 2018-2027
FIG. 46 North America Push Pull Closures Market Value (US$ Mn), By Country 2013-2018
FIG. 47 North America Push Pull Closures Market Value (US$ Mn), By Country 2019-2027
FIG. 48 North America Push Pull Closures Market Value (US$ Mn), By By Diameter 2013-2018
FIG. 49 North America Push Pull Closures Market Value (US$ Mn), By By Diameter 2019-2027
FIG. 50 North America Push Pull Closures Market Value (US$ Mn), By By Material 2013-2018
FIG. 51 North America Push Pull Closures Market Value (US$ Mn), By By Material 2019-2027
FIG. 52 North America Push Pull Closures Market Value (US$ Mn), By End Use Industry 2013-2018
FIG. 53 North America Push Pull Closures Market Value (US$ Mn), By End Use Industry 2019-2027
FIG. 54 Latin America Push Pull Closures Market Value (US$ Mn), By Country 2013-2018
FIG. 55 Latin America Push Pull Closures Market Value (US$ Mn), By Country 2019-2027
FIG. 56 Latin America Push Pull Closures Market Value (US$ Mn), By By Diameter 2013-2018
FIG. 57 Latin America Push Pull Closures Market Value (US$ Mn), By By Diameter 2019-2027
FIG. 58 Latin America Push Pull Closures Market Value (US$ Mn), By By Material 2013-2018
FIG. 59 Latin America Push Pull Closures Market Value (US$ Mn), By By Material 2019-2027
FIG. 60 Latin America Push Pull Closures Market Value (US$ Mn), By End Use Industry 2013-2018
FIG. 61 Latin America Push Pull Closures Market Value (US$ Mn), By End Use Industry 2019-2027
FIG. 62 Europe Push Pull Closures Market Value (US$ Mn), By Country 2013-2018
FIG. 63 Europe Push Pull Closures Market Value (US$ Mn), By Country 2019-2027
FIG. 64 Europe Push Pull Closures Market Value (US$ Mn), By By Diameter 2013-2018
FIG. 65 Europe Push Pull Closures Market Value (US$ Mn), By By Diameter 2019-2027
FIG. 66 Europe Push Pull Closures Market Value (US$ Mn), By By Material 2013-2018
FIG. 67 Europe Push Pull Closures Market Value (US$ Mn), By By Material 2019-2027
FIG. 68 Europe Push Pull Closures Market Value (US$ Mn), By End Use Industry 2013-2018
FIG. 69 Europe Push Pull Closures Market Value (US$ Mn), By End Use Industry 2019-2027
FIG. 70 Japan Push Pull Closures Market Value (US$ Mn), By Country 2013-2018
FIG. 71 Japan Push Pull Closures Market Value (US$ Mn), By Country 2019-2027
FIG. 72 Japan Push Pull Closures Market Value (US$ Mn), By By Diameter 2013-2018
FIG. 73 Japan Push Pull Closures Market Value (US$ Mn), By By Diameter 2019-2027
FIG. 74 Japan Push Pull Closures Market Value (US$ Mn), By End Use Industry 2013-2018
FIG. 75 Japan Push Pull Closures Market Value (US$ Mn), By By Material 2019-2027
FIG. 76 Japan Push Pull Closures Market Value (US$ Mn), By End Use Industry 2013-2018
FIG. 77 Japan Push Pull Closures Market Value (US$ Mn), By End Use Industry 2019-2027
FIG. 78 APEJ Push Pull Closures Market Value (US$ Mn), By Country 2013-2018
FIG. 79 APEJ Push Pull Closures Market Value (US$ Mn), By Country 2019-2027
FIG. 80 APEJ Push Pull Closures Market Value (US$ Mn), By By Diameter 2013-2018
FIG. 81 APEJ Push Pull Closures Market Value (US$ Mn), By By Diameter 2019-2027
FIG. 82 APEJ Push Pull Closures Market Value (US$ Mn), By By Material 2013-2018
FIG. 83 APEJ Push Pull Closures Market Value (US$ Mn), By By Material 2019-2027
FIG. 84 APEJ Push Pull Closures Market Value (US$ Mn), By End Use Industry 2013-2018
FIG. 85 APEJ Push Pull Closures Market Value (US$ Mn), By End Use Industry 2019-2027
FIG. 86 MEA Push Pull Closures Market Value (US$ Mn), By Country 2013-2018
FIG. 87 MEA Push Pull Closures Market Value (US$ Mn), By Country 2019-2027
FIG. 88 MEA Push Pull Closures Market Value (US$ Mn), By By Diameter 2013-2018
FIG. 89 MEA Push Pull Closures Market Value (US$ Mn), By By Diameter 2019-2027
FIG. 90 MEA Push Pull Closures Market Value (US$ Mn), By By Material 2013-2018
FIG. 91 MEA Push Pull Closures Market Value (US$ Mn), By By Material 2019-2027
FIG. 92 MEA Push Pull Closures Market Value (US$ Mn), By End Use Industry 2013-2018
FIG. 93 MEA Push Pull Closures Market Value (US$ Mn), By End Use Industry 2019-2027
Copyright © Transparency Market Research, Inc. All Rights reserved
Trust Online

Push Pull Closures Market