
Reports
Reports
Global Public Cloud Business Process Services Market: Snapshot
The global public cloud business process services market is envisaged to gain impetus alongside the fast-progressing cloud business process management (BPM) industry. Companies operating in the market could look to capitalize on a high demand for an absolute solution for all business processes. The market could gain a competitive edge in the coming years with the help of multi-process platforms engaged to provide complete business process solutions. The need for high-value process outcomes is anticipated to be met by the implementation of public cloud business process services. The services could also be adopted in the business ecosphere for creating a network amongst suppliers, distributors, partners, and employees.
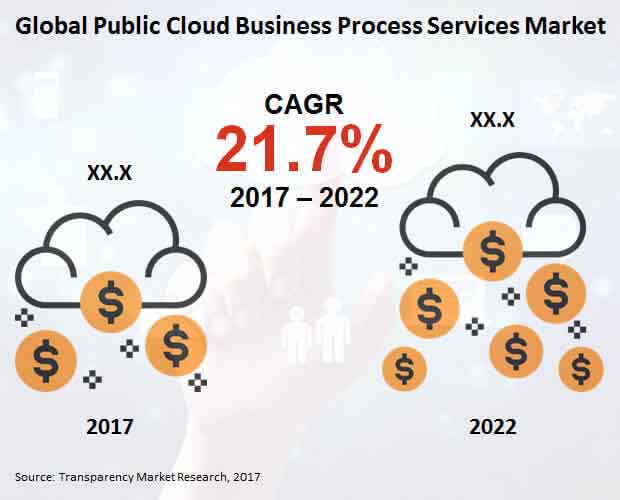
Transparency Market Research (TMR) foresees the global public cloud business process services market to expand at a CAGR of 21.7% during the forecast period 2017–2022. By the final forecast year, the market could be worth a US$139.1 bn. In 2017, it had reached a valuation of US$52.0 bn.
Human Resource Management Services to Attain Overriding Share
The world public cloud business process services market is predicted to be categorized into sundry segments according to process. As a result, the scope of business prospects predominant in the market could be extremely wide and comprehensive. Amongst the various process markets for public cloud business process services, human resource management services are expected to post a lion’s share at an 18.4% CAGR. Annually, the human resource management services market could grow at a US$3.7 bn. Other processes such as cloud payment services, customer management, e-commerce enablement services, finance and accounting services, supply chain management services, and industry operation could also be in the competition to achieve more share in the market.
Two other categories, i.e. vertical and enterprise, are forecasted to make contributions to the world public cloud business process services market. According to the vertical classification, banking, financial services, and insurance (BFSI) and telecommunicating could account for a faster growth in the market. Most telecom and telecommunication technology enterprises are prognosticated to successfully implement cloud business process services. The BFSI sector could implement public cloud business process as a service (BPaaS) to cover specific business requirements while focusing on key parameters. Moreover, public cloud BPaaS could be employed to manage workspace support, training activities, and staff in BFSI.
As per type of enterprise, large enterprises and small and medium enterprises could implement public cloud business process services according to their needs.
Asia Pacific except Japan to Conclude 2022 on High Note
In terms of share, Asia Pacific except Japan (APEJ) could secure a greater percentage of absolute growth in the foreseeable future. By the end of the aforementioned forecast period, the regional market for public cloud business process services could boast of a stunning share of US$58.6 bn. By the same year, North America is projected to exhibit a more than double the share achieved in 2017. Next to rank could be Europe with a decent share estimated to be earned in future. Nonetheless, there could be some expectations placed on other geographical markets such as the Middle East and Africa (MEA) and Japan.
Prominent players such as Accenture PLC, Cognizant Technology Solutions Corporation, Microsoft Corp., IBM Corporation, and Fujitsu Limited could make their presence known in the worldwide public cloud business process services market.
1. Global Public Cloud Business Process Services Market - Executive Summary
2. Global Public Cloud Business Process Services Market Overview
2.1. Introduction
2.1.1. Global Public Cloud Business Process Services Market Taxonomy
2.1.2. Global Public Cloud Business Process Services Market Definition
2.2. Global Public Cloud Business Process Services Market Size (US$ Mn) and Forecast, 2012-2022
2.2.1. Global Public Cloud Business Process Services Market Y-o-Y Growth
2.3. Global Public Cloud Business Process Services Market Dynamics
2.3.1. Drivers
2.3.2. Restraints
2.3.3. Trends
2.4. Supply Chain
2.5. Cost Structure
2.6. Pricing Analysis
2.7. Raw Material Sourcing Strategy and Analysis
2.8. List of Distributors
2.9. Key Participants Market Presence (Intensity Map) By Region
3. Global Public Cloud Business Process Services Market Analysis and Forecast By Process Type
3.1. Global Public Cloud Business Process Services Market Size and Forecast By Process Type, 2012-2022
3.1.1. Cloud Payment Services Public Cloud Business Process Services Market Size and Forecast, 2012-2022
3.1.1.1. Revenue (US$ Mn) Comparison, By Region
3.1.1.2. Market Share Comparison, By Region
3.1.1.3. Y-o-Y growth Comparison, By Region
3.1.2. Customer Management Public Cloud Business Process Services Market Size and Forecast, 2012-2022
3.1.2.1. Revenue (US$ Mn) Comparison, By Region
3.1.2.2. Market Share Comparison, By Region
3.1.2.3. Y-o-Y growth Comparison, By Region
3.1.3. E-commerce Enablement Services Public Cloud Business Process Services Market Size and Forecast, 2012-2022
3.1.3.1. Revenue (US$ Mn) Comparison, By Region
3.1.3.2. Market Share Comparison, By Region
3.1.3.3. Y-o-Y growth Comparison, By Region
3.1.4. Finance & Accounting Services Public Cloud Business Process Services Market Size and Forecast, 2012-2022
3.1.4.1. Revenue (US$ Mn) Comparison, By Region
3.1.4.2. Market Share Comparison, By Region
3.1.4.3. Y-o-Y growth Comparison, By Region
3.1.5. Supply Chain Management Services Public Cloud Business Process Services Market Size and Forecast, 2012-2022
3.1.5.1. Revenue (US$ Mn) Comparison, By Region
3.1.5.2. Market Share Comparison, By Region
3.1.5.3. Y-o-Y growth Comparison, By Region
3.1.6. Industry Operation Public Cloud Business Process Services Market Size and Forecast, 2012-2022
3.1.6.1. Revenue (US$ Mn) Comparison, By Region
3.1.6.2. Market Share Comparison, By Region
3.1.6.3. Y-o-Y growth Comparison, By Region
3.1.7. Human Resource Management Services Public Cloud Business Process Services Market Size and Forecast, 2012-2022
3.1.7.1. Revenue (US$ Mn) Comparison, By Region
3.1.7.2. Market Share Comparison, By Region
3.1.7.3. Y-o-Y growth Comparison, By Region
3.1.8. Other Process Type Public Cloud Business Process Services Market Size and Forecast, 2012-2022
3.1.8.1. Revenue (US$ Mn) Comparison, By Region
3.1.8.2. Market Share Comparison, By Region
3.1.8.3. Y-o-Y growth Comparison, By Region
4. Global Public Cloud Business Process Services Market Analysis and Forecast By Vertical
4.1. Global Public Cloud Business Process Services Market Size and Forecast By Vertical, 2012-2022
4.1.1. Government Public Cloud Business Process Services Market Size and Forecast, 2012-2022
4.1.1.1. Revenue (US$ Mn) Comparison, By Region
4.1.1.2. Market Share Comparison, By Region
4.1.1.3. Y-o-Y growth Comparison, By Region
4.1.2. BFSI Public Cloud Business Process Services Market Size and Forecast, 2012-2022
4.1.2.1. Revenue (US$ Mn) Comparison, By Region
4.1.2.2. Market Share Comparison, By Region
4.1.2.3. Y-o-Y growth Comparison, By Region
4.1.3. Healthcare Public Cloud Business Process Services Market Size and Forecast, 2012-2022
4.1.3.1. Revenue (US$ Mn) Comparison, By Region
4.1.3.2. Market Share Comparison, By Region
4.1.3.3. Y-o-Y growth Comparison, By Region
4.1.4. Telecommunicating Public Cloud Business Process Services Market Size and Forecast, 2012-2022
4.1.4.1. Revenue (US$ Mn) Comparison, By Region
4.1.4.2. Market Share Comparison, By Region
4.1.4.3. Y-o-Y growth Comparison, By Region
4.1.5. Media & Entertainment Public Cloud Business Process Services Market Size and Forecast, 2012-2022
4.1.5.1. Revenue (US$ Mn) Comparison, By Region
4.1.5.2. Market Share Comparison, By Region
4.1.5.3. Y-o-Y growth Comparison, By Region
4.1.6. Energy & Utilities Public Cloud Business Process Services Market Size and Forecast, 2012-2022
4.1.6.1. Revenue (US$ Mn) Comparison, By Region
4.1.6.2. Market Share Comparison, By Region
4.1.6.3. Y-o-Y growth Comparison, By Region
4.1.7. Retail/ Wholesale Public Cloud Business Process Services Market Size and Forecast, 2012-2022
4.1.7.1. Revenue (US$ Mn) Comparison, By Region
4.1.7.2. Market Share Comparison, By Region
4.1.7.3. Y-o-Y growth Comparison, By Region
4.1.8. Manufacturing Public Cloud Business Process Services Market Size and Forecast, 2012-2022
4.1.8.1. Revenue (US$ Mn) Comparison, By Region
4.1.8.2. Market Share Comparison, By Region
4.1.8.3. Y-o-Y growth Comparison, By Region
4.1.9. Transportation Public Cloud Business Process Services Market Size and Forecast, 2012-2022
4.1.9.1. Revenue (US$ Mn) Comparison, By Region
4.1.9.2. Market Share Comparison, By Region
4.1.9.3. Y-o-Y growth Comparison, By Region
4.1.10. Other Verticals Public Cloud Business Process Services Market Size and Forecast, 2012-2022
4.1.10.1.Revenue (US$ Mn) Comparison, By Region
4.1.10.2.Market Share Comparison, By Region
4.1.10.3.Y-o-Y growth Comparison, By Region
5. Global Public Cloud Business Process Services Market Analysis and Forecast By Enterprise
5.1. Global Public Cloud Business Process Services Market Size and Forecast By Enterprise, 2012-2022
5.1.1. Large Enterprise Public Cloud Business Process Services Market Size and Forecast, 2012-2022
5.1.1.1. Revenue (US$ Mn) Comparison, By Region
5.1.1.2. Market Share Comparison, By Region
5.1.1.3. Y-o-Y growth Comparison, By Region
5.1.2. Small & Medium Enterprise Public Cloud Business Process Services Market Size and Forecast, 2012-2022
5.1.2.1. Revenue (US$ Mn) Comparison, By Region
5.1.2.2. Market Share Comparison, By Region
5.1.2.3. Y-o-Y growth Comparison, By Region
6. Global Public Cloud Business Process Services Market Analysis and Forecast By Region
6.1. Global Public Cloud Business Process Services Market Size and Forecast, 2012-2022
6.1.1. North America Public Cloud Business Process Services Market Size and Forecast, 2012-2022
6.1.1.1. Revenue (US$ Mn) Comparison, By Process Type
6.1.1.2. Revenue (US$ Mn) Comparison, By Vertical
6.1.1.3. Revenue (US$ Mn) Comparison, By Enterprise
6.1.2. Latin America Public Cloud Business Process Services Market Size and Forecast, 2012-2022
6.1.2.1. Revenue (US$ Mn) Comparison, By Process Type
6.1.2.2. Revenue (US$ Mn) Comparison, By Vertical
6.1.2.3. Revenue (US$ Mn) Comparison, By Enterprise
6.1.3. Europe Public Cloud Business Process Services Market Size and Forecast, 2012-2022
6.1.3.1. Revenue (US$ Mn) Comparison, By Process Type
6.1.3.2. Revenue (US$ Mn) Comparison, By Vertical
6.1.3.3. Revenue (US$ Mn) Comparison, By Enterprise
6.1.4. Japan Public Cloud Business Process Services Market Size and Forecast, 2012-2022
6.1.4.1. Revenue (US$ Mn) Comparison, By Process Type
6.1.4.2. Revenue (US$ Mn) Comparison, By Vertical
6.1.4.3. Revenue (US$ Mn) Comparison, By Enterprise
6.1.5. APEJ Public Cloud Business Process Services Market Size and Forecast, 2012-2022
6.1.5.1. Revenue (US$ Mn) Comparison, By Process Type
6.1.5.2. Revenue (US$ Mn) Comparison, By Vertical
6.1.5.3. Revenue (US$ Mn) Comparison, By Enterprise
6.1.6. MEA Public Cloud Business Process Services Market Size and Forecast, 2012-2022
6.1.6.1. Revenue (US$ Mn) Comparison, By Process Type
6.1.6.2. Revenue (US$ Mn) Comparison, By Vertical
6.1.6.3. Revenue (US$ Mn) Comparison, By Enterprise
7. North America Public Cloud Business Process Services Market Analysis and Forecast, By Country, 2012-2022
7.1. US Public Cloud Business Process Services Market Size and Forecast, 2012-2022
7.1.1. Revenue (US$ Mn) Comparison, By Process Type
7.1.2. Revenue (US$ Mn) Comparison, By Vertical
7.1.3. Revenue (US$ Mn) Comparison, By Enterprise
7.2. Canada Public Cloud Business Process Services Market Size and Forecast, 2012-2022
7.2.1. Revenue (US$ Mn) Comparison, By Process Type
7.2.2. Revenue (US$ Mn) Comparison, By Vertical
7.2.3. Revenue (US$ Mn) Comparison, By Enterprise
8. Latin America Public Cloud Business Process Services Market Analysis and Forecast, By Country, 2012-2022
8.1. Brazil Public Cloud Business Process Services Market Size and Forecast, 2012-2022
8.1.1. Revenue (US$ Mn) Comparison, By Process Type
8.1.2. Revenue (US$ Mn) Comparison, By Vertical
8.1.3. Revenue (US$ Mn) Comparison, By Enterprise
8.2. Mexico Public Cloud Business Process Services Market Size and Forecast, 2012-2022
8.2.1. Revenue (US$ Mn) Comparison, By Process Type
8.2.2. Revenue (US$ Mn) Comparison, By Vertical
8.2.3. Revenue (US$ Mn) Comparison, By Enterprise
8.3. Argentina Public Cloud Business Process Services Market Size and Forecast, 2012-2022
8.3.1. Revenue (US$ Mn) Comparison, By Process Type
8.3.2. Revenue (US$ Mn) Comparison, By Vertical
8.3.3. Revenue (US$ Mn) Comparison, By Enterprise
9. Europe Public Cloud Business Process Services Market Analysis and Forecast, By Country, 2012-2022
9.1. Germany Public Cloud Business Process Services Market Size and Forecast, 2012-2022
9.1.1. Revenue (US$ Mn) Comparison, By Process Type
9.1.2. Revenue (US$ Mn) Comparison, By Vertical
9.1.3. Revenue (US$ Mn) Comparison, By Enterprise
9.2. UK Public Cloud Business Process Services Market Size and Forecast, 2012-2022
9.2.1. Revenue (US$ Mn) Comparison, By Process Type
9.2.2. Revenue (US$ Mn) Comparison, By Vertical
9.2.3. Revenue (US$ Mn) Comparison, By Enterprise
9.3. France Public Cloud Business Process Services Market Size and Forecast, 2012-2022
9.3.1. Revenue (US$ Mn) Comparison, By Process Type
9.3.2. Revenue (US$ Mn) Comparison, By Vertical
9.3.3. Revenue (US$ Mn) Comparison, By Enterprise
9.4. Spain Public Cloud Business Process Services Market Size and Forecast, 2012-2022
9.4.1. Revenue (US$ Mn) Comparison, By Process Type
9.4.2. Revenue (US$ Mn) Comparison, By Vertical
9.4.3. Revenue (US$ Mn) Comparison, By Enterprise
9.5. Italy Public Cloud Business Process Services Market Size and Forecast, 2012-2022
9.5.1. Revenue (US$ Mn) Comparison, By Process Type
9.5.2. Revenue (US$ Mn) Comparison, By Vertical
9.5.3. Revenue (US$ Mn) Comparison, By Enterprise
9.6. Nordic Public Cloud Business Process Services Market Size and Forecast, 2012-2022
9.6.1. Revenue (US$ Mn) Comparison, By Process Type
9.6.2. Revenue (US$ Mn) Comparison, By Vertical
9.6.3. Revenue (US$ Mn) Comparison, By Enterprise
10. Japan Public Cloud Business Process Services Market Analysis and Forecast, By Country, 2012-2022
10.1. Japan Public Cloud Business Process Services Market Size and Forecast, 2012-2022
10.1.1. Revenue (US$ Mn) Comparison, By Process Type
10.1.2. Revenue (US$ Mn) Comparison, By Vertical
10.1.3. Revenue (US$ Mn) Comparison, By Enterprise
11. APEJ Public Cloud Business Process Services Market Analysis and Forecast, By Country, 2012-2022
11.1. China Public Cloud Business Process Services Market Size and Forecast, 2012-2022
11.1.1. Revenue (US$ Mn) Comparison, By Process Type
11.1.2. Revenue (US$ Mn) Comparison, By Vertical
11.1.3. Revenue (US$ Mn) Comparison, By Enterprise
11.2. India Public Cloud Business Process Services Market Size and Forecast, 2012-2022
11.2.1. Revenue (US$ Mn) Comparison, By Process Type
11.2.2. Revenue (US$ Mn) Comparison, By Vertical
11.2.3. Revenue (US$ Mn) Comparison, By Enterprise
11.3. Malaysia Public Cloud Business Process Services Market Size and Forecast, 2012-2022
11.3.1. Revenue (US$ Mn) Comparison, By Process Type
11.3.2. Revenue (US$ Mn) Comparison, By Vertical
11.3.3. Revenue (US$ Mn) Comparison, By Enterprise
11.4. Thailand Public Cloud Business Process Services Market Size and Forecast, 2012-2022
11.4.1. Revenue (US$ Mn) Comparison, By Process Type
11.4.2. Revenue (US$ Mn) Comparison, By Vertical
11.4.3. Revenue (US$ Mn) Comparison, By Enterprise
11.5. Singapore Public Cloud Business Process Services Market Size and Forecast, 2012-2022
11.5.1. Revenue (US$ Mn) Comparison, By Process Type
11.5.2. Revenue (US$ Mn) Comparison, By Vertical
11.5.3. Revenue (US$ Mn) Comparison, By Enterprise
11.6. Australia Public Cloud Business Process Services Market Size and Forecast, 2012-2022
11.6.1. Revenue (US$ Mn) Comparison, By Process Type
11.6.2. Revenue (US$ Mn) Comparison, By Vertical
11.6.3. Revenue (US$ Mn) Comparison, By Enterprise
12. MEA Public Cloud Business Process Services Market Analysis and Forecast, By Country, 2012-2022
12.1. GCC Countries Public Cloud Business Process Services Market Size and Forecast, 2012-2022
12.1.1. Revenue (US$ Mn) Comparison, By Process Type
12.1.2. Revenue (US$ Mn) Comparison, By Vertical
12.1.3. Revenue (US$ Mn) Comparison, By Enterprise
12.2. South Africa Public Cloud Business Process Services Market Size and Forecast, 2012-2022
12.2.1. Revenue (US$ Mn) Comparison, By Process Type
12.2.2. Revenue (US$ Mn) Comparison, By Vertical
12.2.3. Revenue (US$ Mn) Comparison, By Enterprise
12.3. Nigeria Public Cloud Business Process Services Market Size and Forecast, 2012-2022
12.3.1. Revenue (US$ Mn) Comparison, By Process Type
12.3.2. Revenue (US$ Mn) Comparison, By Vertical
12.3.3. Revenue (US$ Mn) Comparison, By Enterprise
12.4. Israel Public Cloud Business Process Services Market Size and Forecast, 2012-2022
12.4.1. Revenue (US$ Mn) Comparison, By Process Type
12.4.2. Revenue (US$ Mn) Comparison, By Vertical
12.4.3. Revenue (US$ Mn) Comparison, By Enterprise
13. Global Public Cloud Business Process Services Market Competition Landscape and Company Profile
13.1. Company Share Analysis By Region
13.2. Accenture PLC
13.2.1. Company Overview
13.2.2. Public Cloud Business Process Services Market Process Type list
13.2.3. Public Cloud Business Process Services Market Process Type Sales Data and Key Financials
13.2.4. Key Developments
13.2.5. SWOT Analysis
13.3. Cognizant Technology Solutions Corporation
13.3.1. Company Overview
13.3.2. Public Cloud Business Process Services Market Process Type list
13.3.3. Public Cloud Business Process Services Market Process Type Sales Data and Key Financials
13.3.4. Key Developments
13.3.5. SWOT Analysis
13.4. Microsoft Corp.
13.4.1. Company Overview
13.4.2. Public Cloud Business Process Services Market Process Type list
13.4.3. Public Cloud Business Process Services Market Process Type Sales Data and Key Financials
13.4.4. Key Developments
13.4.5. SWOT Analysis
13.5. IBM Corporation
13.5.1. Company Overview
13.5.2. Public Cloud Business Process Services Market Process Type list
13.5.3. Public Cloud Business Process Services Market Process Type Sales Data and Key Financials
13.5.4. Key Developments
13.5.5. SWOT Analysis
13.6. Fujitsu Limited
13.6.1. Company Overview
13.6.2. Public Cloud Business Process Services Market Process Type list
13.6.3. Public Cloud Business Process Services Market Process Type Sales Data and Key Financials
13.6.4. Key Developments
13.6.5. SWOT Analysis
13.8. Oracle Corp.
13.8.1. Company Overview
13.8.2. Public Cloud Business Process Services Market Process Type list
13.8.3. Public Cloud Business Process Services Market Process Type Sales Data and Key Financials
13.8.4. Key Developments
13.8.5. SWOT Analysis
13.9. Amazon Web Services Inc.
13.9.1. Company Overview
13.9.2. Public Cloud Business Process Services Market Process Type list
13.9.3. Public Cloud Business Process Services Market Process Type Sales Data and Key Financials
13.9.4. Key Developments
13.9.5. SWOT Analysis
13.10. Salesforce.Com, Inc
13.10.1. Company Overview
13.10.2. Public Cloud Business Process Services Market Process Type list
13.10.3. Public Cloud Business Process Services Market Process Type Sales Data and Key Financials
13.10.4. Key Developments
13.10.5. SWOT Analysis
13.11. SAP SE
13.11.1. Company Overview
13.11.2. Public Cloud Business Process Services Market Process Type list
13.11.3. Public Cloud Business Process Services Market Process Type Sales Data and Key Financials
13.11.4. Key Developments
13.11.5. SWOT Analysis
13.12. VMware, Inc.
13.12.1. Company Overview
13.12.2. Public Cloud Business Process Services Market Process Type list
13.12.3. Public Cloud Business Process Services Market Process Type Sales Data and Key Financials
13.12.4. Key Developments
13.12.5. SWOT Analysis
14. Research Methodology
15. Secondary and Primary Sources
16. Assumptions and Acronyms
17. Disclaimer
List of Tables
TABLE 1 Global Public Cloud Business Process Services Market Value (US$ Mn), 2012-2016
TABLE 2 Global Public Cloud Business Process Services Market Value (US$ Mn), 2017-2022
TABLE 3 Global Public Cloud Business Process Services Market Value (US$ Mn) and Y-o-Y, 2015-2022
TABLE 4 Global Cloud Payment Services Segment Value (US$ Mn), By Region 2012-2016
TABLE 5 Global Cloud Payment Services Segment Value (US$ Mn), By Region 2017-2022
TABLE 6 Global Cloud Payment Services Segment Market Share, By Region 2012-2016
TABLE 7 Global Cloud Payment Services Segment Market Share, By Region 2017-2022
TABLE 8 Global Cloud Payment Services Segment Y-o-Y, By Region 2015-2022
TABLE 9 Global Customer Management Segment Value (US$ Mn), By Region 2012-2016
TABLE 10 Global Customer Management Segment Value (US$ Mn), By Region 2017-2022
TABLE 11 Global Customer Management Segment Market Share, By Region 2012-2016
TABLE 12 Global Customer Management Segment Market Share, By Region 2017-2022
TABLE 13 Global Customer Management Segment Y-o-Y, By Region 2015-2022
TABLE 14 Global E-commerce Enablement Services Segment Value (US$ Mn), By Region 2012-2016
TABLE 15 Global E-commerce Enablement Services Segment Value (US$ Mn), By Region 2017-2022
TABLE 16 Global E-commerce Enablement Services Segment Market Share, By Region 2012-2016
TABLE 17 Global E-commerce Enablement Services Segment Market Share, By Region 2017-2022
TABLE 18 Global E-commerce Enablement Services Segment Y-o-Y, By Region 2015-2022
TABLE 19 Global Finance & Accounting Services Segment Value (US$ Mn), By Region 2012-2016
TABLE 20 Global Finance & Accounting Services Segment Value (US$ Mn), By Region 2017-2022
TABLE 21 Global Finance & Accounting Services Segment Market Share, By Region 2012-2016
TABLE 22 Global Finance & Accounting Services Segment Market Share, By Region 2017-2022
TABLE 23 Global Finance & Accounting Services Segment Y-o-Y, By Region 2015-2022
TABLE 24 Global Supply Chain Management Services Segment Value (US$ Mn), By Region 2012-2016
TABLE 25 Global Supply Chain Management Services Segment Value (US$ Mn), By Region 2017-2022
TABLE 26 Global Supply Chain Management Services Segment Market Share, By Region 2012-2016
TABLE 27 Global Supply Chain Management Services Segment Market Share, By Region 2017-2022
TABLE 28 Global Supply Chain Management Services Segment Y-o-Y, By Region 2015-2022
TABLE 29 Global Industry Operation Segment Value (US$ Mn), By Region 2012-2016
TABLE 30 Global Industry Operation Segment Value (US$ Mn), By Region 2017-2022
TABLE 31 Global Industry Operation Segment Market Share, By Region 2012-2016
TABLE 32 Global Industry Operation Segment Market Share, By Region 2017-2022
TABLE 33 Global Industry Operation Segment Y-o-Y, By Region 2015-2022
TABLE 34 Global Human Resource Management Services Segment Value (US$ Mn), By Region 2012-2016
TABLE 35 Global Human Resource Management Services Segment Value (US$ Mn), By Region 2017-2022
TABLE 36 Global Human Resource Management Services Segment Market Share, By Region 2012-2016
TABLE 37 Global Human Resource Management Services Segment Market Share, By Region 2017-2022
TABLE 38 Global Human Resource Management Services Segment Y-o-Y, By Region 2015-2022
TABLE 39 Global Other Process Type Segment Value (US$ Mn), By Region 2012-2016
TABLE 40 Global Other Process Type Segment Value (US$ Mn), By Region 2017-2022
TABLE 41 Global Other Process Type Segment Market Share, By Region 2012-2016
TABLE 42 Global Other Process Type Segment Market Share, By Region 2017-2022
TABLE 43 Global Other Process Type Segment Y-o-Y, By Region 2015-2022
TABLE 44 Global Government Segment Value (US$ Mn), By Region 2012-2016
TABLE 45 Global Government Segment Value (US$ Mn), By Region 2017-2022
TABLE 46 Global Government Segment Market Share, By Region 2012-2016
TABLE 47 Global Government Segment Market Share, By Region 2017-2022
TABLE 48 Global Government Segment Y-o-Y, By Region 2015-2022
TABLE 49 Global BFSI Segment Value (US$ Mn), By Region 2012-2016
TABLE 50 Global BFSI Segment Value (US$ Mn), By Region 2017-2022
TABLE 51 Global BFSI Segment Market Share, By Region 2012-2016
TABLE 52 Global BFSI Segment Market Share, By Region 2017-2022
TABLE 53 Global BFSI Segment Y-o-Y, By Region 2015-2022
TABLE 54 Global Healthcare Segment Value (US$ Mn), By Region 2012-2016
TABLE 55 Global Healthcare Segment Value (US$ Mn), By Region 2017-2022
TABLE 56 Global Healthcare Segment Market Share, By Region 2012-2016
TABLE 57 Global Healthcare Segment Market Share, By Region 2017-2022
TABLE 58 Global Healthcare Segment Y-o-Y, By Region 2015-2022
TABLE 59 Global Telecommunicating Segment Value (US$ Mn), By Region 2012-2016
TABLE 60 Global Telecommunicating Segment Value (US$ Mn), By Region 2017-2022
TABLE 61 Global Telecommunicating Segment Market Share, By Region 2012-2016
TABLE 62 Global Telecommunicating Segment Market Share, By Region 2017-2022
TABLE 63 Global Telecommunicating Segment Y-o-Y, By Region 2015-2022
TABLE 64 Global Media & Entertainment Segment Value (US$ Mn), By Region 2012-2016
TABLE 65 Global Media & Entertainment Segment Value (US$ Mn), By Region 2017-2022
TABLE 66 Global Media & Entertainment Segment Market Share, By Region 2012-2016
TABLE 67 Global Media & Entertainment Segment Market Share, By Region 2017-2022
TABLE 68 Global Media & Entertainment Segment Y-o-Y, By Region 2015-2022
TABLE 69 Global Energy & Utilities Segment Value (US$ Mn), By Region 2012-2016
TABLE 70 Global Energy & Utilities Segment Value (US$ Mn), By Region 2017-2022
TABLE 71 Global Energy & Utilities Segment Market Share, By Region 2012-2016
TABLE 72 Global Energy & Utilities Segment Market Share, By Region 2017-2022
TABLE 73 Global Energy & Utilities Segment Y-o-Y, By Region 2015-2022
TABLE 74 Global Retail/ Wholesale Segment Value (US$ Mn), By Region 2012-2016
TABLE 75 Global Retail/ Wholesale Segment Value (US$ Mn), By Region 2017-2022
TABLE 76 Global Retail/ Wholesale Segment Market Share, By Region 2012-2016
TABLE 77 Global Retail/ Wholesale Segment Market Share, By Region 2017-2022
TABLE 78 Global Retail/ Wholesale Segment Y-o-Y, By Region 2015-2022
TABLE 79 Global Manufacturing Segment Value (US$ Mn), By Region 2012-2016
TABLE 80 Global Manufacturing Segment Value (US$ Mn), By Region 2017-2022
TABLE 81 Global Manufacturing Segment Market Share, By Region 2012-2016
TABLE 82 Global Manufacturing Segment Market Share, By Region 2017-2022
TABLE 83 Global Manufacturing Segment Y-o-Y, By Region 2015-2022
TABLE 84 Global Transportation Segment Value (US$ Mn), By Region 2012-2016
TABLE 85 Global Transportation Segment Value (US$ Mn), By Region 2017-2022
TABLE 86 Global Transportation Segment Market Share, By Region 2012-2016
TABLE 87 Global Transportation Segment Market Share, By Region 2017-2022
TABLE 88 Global Transportation Segment Y-o-Y, By Region 2015-2022
TABLE 89 Global Other Verticals Segment Value (US$ Mn), By Region 2012-2016
TABLE 90 Global Other Verticals Segment Value (US$ Mn), By Region 2017-2022
TABLE 91 Global Other Verticals Segment Market Share, By Region 2012-2016
TABLE 92 Global Other Verticals Segment Market Share, By Region 2017-2022
TABLE 93 Global Other Verticals Segment Y-o-Y, By Region 2015-2022
TABLE 94 Global Large Enterprise Segment Value (US$ Mn), By Region 2012-2016
TABLE 95 Global Large Enterprise Segment Value (US$ Mn), By Region 2017-2022
TABLE 96 Global Large Enterprise Segment Market Share, By Region 2012-2016
TABLE 97 Global Large Enterprise Segment Market Share, By Region 2017-2022
TABLE 98 Global Large Enterprise Segment Y-o-Y, By Region 2015-2022
TABLE 99 Global Small & Medium Enterprise Segment Value (US$ Mn), By Region 2012-2016
TABLE 100 Global Small & Medium Enterprise Segment Value (US$ Mn), By Region 2017-2022
TABLE 101 Global Small & Medium Enterprise Segment Market Share, By Region 2012-2016
TABLE 102 Global Small & Medium Enterprise Segment Market Share, By Region 2017-2022
TABLE 103 Global Small & Medium Enterprise Segment Y-o-Y, By Region 2015-2022
TABLE 104 North America Public Cloud Business Process Services Market Value (US$ Mn), By Process Type 2012-2016
TABLE 105 North America Public Cloud Business Process Services Market Value (US$ Mn), By Process Type 2017-2022
TABLE 106 North America Public Cloud Business Process Services Market Value (US$ Mn), By Vertical 2012-2016
TABLE 107 North America Public Cloud Business Process Services Market Value (US$ Mn), By Vertical 2017-2022
TABLE 108 North America Public Cloud Business Process Services Market Value (US$ Mn), By Enterprise 2012-2016
TABLE 109 North America Public Cloud Business Process Services Market Value (US$ Mn), By Enterprise 2017-2022
TABLE 110 Latin America Public Cloud Business Process Services Market Value (US$ Mn), By Process Type 2012-2016
TABLE 111 Latin America Public Cloud Business Process Services Market Value (US$ Mn), By Process Type 2017-2022
TABLE 112 Latin America Public Cloud Business Process Services Market Value (US$ Mn), By Vertical 2012-2016
TABLE 113 Latin America Public Cloud Business Process Services Market Value (US$ Mn), By Vertical 2017-2022
TABLE 114 Latin America Public Cloud Business Process Services Market Value (US$ Mn), By Enterprise 2012-2016
TABLE 115 Latin America Public Cloud Business Process Services Market Value (US$ Mn), By Enterprise 2017-2022
TABLE 116 Europe Public Cloud Business Process Services Market Value (US$ Mn), By Process Type 2012-2016
TABLE 117 Europe Public Cloud Business Process Services Market Value (US$ Mn), By Process Type 2017-2022
TABLE 118 Europe Public Cloud Business Process Services Market Value (US$ Mn), By Vertical 2012-2016
TABLE 119 Europe Public Cloud Business Process Services Market Value (US$ Mn), By Vertical 2017-2022
TABLE 120 Europe Public Cloud Business Process Services Market Value (US$ Mn), By Enterprise 2012-2016
TABLE 121 Europe Public Cloud Business Process Services Market Value (US$ Mn), By Enterprise 2017-2022
TABLE 122 Japan Public Cloud Business Process Services Market Value (US$ Mn), By Process Type 2012-2016
TABLE 123 Japan Public Cloud Business Process Services Market Value (US$ Mn), By Process Type 2017-2022
TABLE 124 Japan Public Cloud Business Process Services Market Value (US$ Mn), By Vertical 2012-2016
TABLE 125 Japan Public Cloud Business Process Services Market Value (US$ Mn), By Vertical 2017-2022
TABLE 126 Japan Public Cloud Business Process Services Market Value (US$ Mn), By Enterprise 2012-2016
TABLE 127 Japan Public Cloud Business Process Services Market Value (US$ Mn), By Enterprise 2017-2022
TABLE 128 APEJ Public Cloud Business Process Services Market Value (US$ Mn), By Process Type 2012-2016
TABLE 129 APEJ Public Cloud Business Process Services Market Value (US$ Mn), By Process Type 2017-2022
TABLE 130 APEJ Public Cloud Business Process Services Market Value (US$ Mn), By Vertical 2012-2016
TABLE 131 APEJ Public Cloud Business Process Services Market Value (US$ Mn), By Vertical 2017-2022
TABLE 132 APEJ Public Cloud Business Process Services Market Value (US$ Mn), By Enterprise 2012-2016
TABLE 133 APEJ Public Cloud Business Process Services Market Value (US$ Mn), By Enterprise 2017-2022
TABLE 134 MEA Public Cloud Business Process Services Market Value (US$ Mn), By Process Type 2012-2016
TABLE 135 MEA Public Cloud Business Process Services Market Value (US$ Mn), By Process Type 2017-2022
TABLE 136 MEA Public Cloud Business Process Services Market Value (US$ Mn), By Vertical 2012-2016
TABLE 137 MEA Public Cloud Business Process Services Market Value (US$ Mn), By Vertical 2017-2022
TABLE 138 MEA Public Cloud Business Process Services Market Value (US$ Mn), By Enterprise 2012-2016
TABLE 139 MEA Public Cloud Business Process Services Market Value (US$ Mn), By Enterprise 2017-2022
TABLE 140 US Public Cloud Business Process Services Market Value (US$ Mn), By Process Type 2012-2016
TABLE 141 US Public Cloud Business Process Services Market Value (US$ Mn), By Process Type 2017-2022
TABLE 142 US Public Cloud Business Process Services Market Value (US$ Mn), By Vertical 2012-2016
TABLE 143 US Public Cloud Business Process Services Market Value (US$ Mn), By Vertical 2017-2022
TABLE 144 US Public Cloud Business Process Services Market Value (US$ Mn), By Enterprise 2012-2016
TABLE 145 US Public Cloud Business Process Services Market Value (US$ Mn), By Enterprise 2017-2022
TABLE 146 Canada Public Cloud Business Process Services Market Value (US$ Mn), By Process Type 2012-2016
TABLE 147 Canada Public Cloud Business Process Services Market Value (US$ Mn), By Process Type 2017-2022
TABLE 148 Canada Public Cloud Business Process Services Market Value (US$ Mn), By Vertical 2012-2016
TABLE 149 Canada Public Cloud Business Process Services Market Value (US$ Mn), By Vertical 2017-2022
TABLE 150 Canada Public Cloud Business Process Services Market Value (US$ Mn), By Enterprise 2012-2016
TABLE 151 Canada Public Cloud Business Process Services Market Value (US$ Mn), By Enterprise 2017-2022
TABLE 152 Brazil Public Cloud Business Process Services Market Value (US$ Mn), By Process Type 2012-2016
TABLE 153 Brazil Public Cloud Business Process Services Market Value (US$ Mn), By Process Type 2017-2022
TABLE 154 Brazil Public Cloud Business Process Services Market Value (US$ Mn), By Vertical 2012-2016
TABLE 155 Brazil Public Cloud Business Process Services Market Value (US$ Mn), By Vertical 2017-2022
TABLE 156 Brazil Public Cloud Business Process Services Market Value (US$ Mn), By Enterprise 2012-2016
TABLE 157 Brazil Public Cloud Business Process Services Market Value (US$ Mn), By Enterprise 2017-2022
TABLE 158 Mexico Public Cloud Business Process Services Market Value (US$ Mn), By Process Type 2012-2016
TABLE 159 Mexico Public Cloud Business Process Services Market Value (US$ Mn), By Process Type 2017-2022
TABLE 160 Mexico Public Cloud Business Process Services Market Value (US$ Mn), By Vertical 2012-2016
TABLE 161 Mexico Public Cloud Business Process Services Market Value (US$ Mn), By Vertical 2017-2022
TABLE 162 Mexico Public Cloud Business Process Services Market Value (US$ Mn), By Enterprise 2012-2016
TABLE 163 Mexico Public Cloud Business Process Services Market Value (US$ Mn), By Enterprise 2017-2022
TABLE 164 Argentina Public Cloud Business Process Services Market Value (US$ Mn), By Process Type 2012-2016
TABLE 165 Argentina Public Cloud Business Process Services Market Value (US$ Mn), By Process Type 2017-2022
TABLE 166 Argentina Public Cloud Business Process Services Market Value (US$ Mn), By Vertical 2012-2016
TABLE 167 Argentina Public Cloud Business Process Services Market Value (US$ Mn), By Vertical 2017-2022
TABLE 168 Argentina Public Cloud Business Process Services Market Value (US$ Mn), By Enterprise 2012-2016
TABLE 169 Argentina Public Cloud Business Process Services Market Value (US$ Mn), By Enterprise 2017-2022
TABLE 170 Germany Public Cloud Business Process Services Market Value (US$ Mn), By Process Type 2012-2016
TABLE 171 Germany Public Cloud Business Process Services Market Value (US$ Mn), By Process Type 2017-2022
TABLE 172 Germany Public Cloud Business Process Services Market Value (US$ Mn), By Vertical 2012-2016
TABLE 173 Germany Public Cloud Business Process Services Market Value (US$ Mn), By Vertical 2017-2022
TABLE 174 Germany Public Cloud Business Process Services Market Value (US$ Mn), By Enterprise 2012-2016
TABLE 175 Germany Public Cloud Business Process Services Market Value (US$ Mn), By Enterprise 2017-2022
TABLE 176 UK Public Cloud Business Process Services Market Value (US$ Mn), By Process Type 2012-2016
TABLE 177 UK Public Cloud Business Process Services Market Value (US$ Mn), By Process Type 2017-2022
TABLE 178 UK Public Cloud Business Process Services Market Value (US$ Mn), By Vertical 2012-2016
TABLE 179 UK Public Cloud Business Process Services Market Value (US$ Mn), By Vertical 2017-2022
TABLE 180 UK Public Cloud Business Process Services Market Value (US$ Mn), By Enterprise 2012-2016
TABLE 181 UK Public Cloud Business Process Services Market Value (US$ Mn), By Enterprise 2017-2022
TABLE 182 France Public Cloud Business Process Services Market Value (US$ Mn), By Process Type 2012-2016
TABLE 183 France Public Cloud Business Process Services Market Value (US$ Mn), By Process Type 2017-2022
TABLE 184 France Public Cloud Business Process Services Market Value (US$ Mn), By Vertical 2012-2016
TABLE 185 France Public Cloud Business Process Services Market Value (US$ Mn), By Vertical 2017-2022
TABLE 186 France Public Cloud Business Process Services Market Value (US$ Mn), By Enterprise 2012-2016
TABLE 187 France Public Cloud Business Process Services Market Value (US$ Mn), By Enterprise 2017-2022
TABLE 188 Spain Public Cloud Business Process Services Market Value (US$ Mn), By Process Type 2012-2016
TABLE 189 Spain Public Cloud Business Process Services Market Value (US$ Mn), By Process Type 2017-2022
TABLE 190 Spain Public Cloud Business Process Services Market Value (US$ Mn), By Vertical 2012-2016
TABLE 191 Spain Public Cloud Business Process Services Market Value (US$ Mn), By Vertical 2017-2022
TABLE 192 Spain Public Cloud Business Process Services Market Value (US$ Mn), By Enterprise 2012-2016
TABLE 193 Spain Public Cloud Business Process Services Market Value (US$ Mn), By Enterprise 2017-2022
TABLE 194 Italy Public Cloud Business Process Services Market Value (US$ Mn), By Process Type 2012-2016
TABLE 195 Italy Public Cloud Business Process Services Market Value (US$ Mn), By Process Type 2017-2022
TABLE 196 Italy Public Cloud Business Process Services Market Value (US$ Mn), By Vertical 2012-2016
TABLE 197 Italy Public Cloud Business Process Services Market Value (US$ Mn), By Vertical 2017-2022
TABLE 198 Italy Public Cloud Business Process Services Market Value (US$ Mn), By Enterprise 2012-2016
TABLE 199 Italy Public Cloud Business Process Services Market Value (US$ Mn), By Enterprise 2017-2022
TABLE 200 Nordic Public Cloud Business Process Services Market Value (US$ Mn), By Process Type 2012-2016
TABLE 201 Nordic Public Cloud Business Process Services Market Value (US$ Mn), By Process Type 2017-2022
TABLE 202 Nordic Public Cloud Business Process Services Market Value (US$ Mn), By Vertical 2012-2016
TABLE 203 Nordic Public Cloud Business Process Services Market Value (US$ Mn), By Vertical 2017-2022
TABLE 204 Nordic Public Cloud Business Process Services Market Value (US$ Mn), By Enterprise 2012-2016
TABLE 205 Nordic Public Cloud Business Process Services Market Value (US$ Mn), By Enterprise 2017-2022
TABLE 206 Japan Public Cloud Business Process Services Market Value (US$ Mn), By Process Type 2012-2016
TABLE 207 Japan Public Cloud Business Process Services Market Value (US$ Mn), By Process Type 2017-2022
TABLE 208 Japan Public Cloud Business Process Services Market Value (US$ Mn), By Vertical 2012-2016
TABLE 209 Japan Public Cloud Business Process Services Market Value (US$ Mn), By Vertical 2017-2022
TABLE 210 Japan Public Cloud Business Process Services Market Value (US$ Mn), By Enterprise 2012-2016
TABLE 211 Japan Public Cloud Business Process Services Market Value (US$ Mn), By Enterprise 2017-2022
TABLE 212 China Public Cloud Business Process Services Market Value (US$ Mn), By Process Type 2012-2016
TABLE 213 China Public Cloud Business Process Services Market Value (US$ Mn), By Process Type 2017-2022
TABLE 214 China Public Cloud Business Process Services Market Value (US$ Mn), By Vertical 2012-2016
TABLE 215 China Public Cloud Business Process Services Market Value (US$ Mn), By Vertical 2017-2022
TABLE 216 China Public Cloud Business Process Services Market Value (US$ Mn), By Enterprise 2012-2016
TABLE 217 China Public Cloud Business Process Services Market Value (US$ Mn), By Enterprise 2017-2022
TABLE 218 India Public Cloud Business Process Services Market Value (US$ Mn), By Process Type 2012-2016
TABLE 219 India Public Cloud Business Process Services Market Value (US$ Mn), By Process Type 2017-2022
TABLE 220 India Public Cloud Business Process Services Market Value (US$ Mn), By Vertical 2012-2016
TABLE 221 India Public Cloud Business Process Services Market Value (US$ Mn), By Vertical 2017-2022
TABLE 222 India Public Cloud Business Process Services Market Value (US$ Mn), By Enterprise 2012-2016
TABLE 223 India Public Cloud Business Process Services Market Value (US$ Mn), By Enterprise 2017-2022
TABLE 224 Malaysia Public Cloud Business Process Services Market Value (US$ Mn), By Process Type 2012-2016
TABLE 225 Malaysia Public Cloud Business Process Services Market Value (US$ Mn), By Process Type 2017-2022
TABLE 226 Malaysia Public Cloud Business Process Services Market Value (US$ Mn), By Vertical 2012-2016
TABLE 227 Malaysia Public Cloud Business Process Services Market Value (US$ Mn), By Vertical 2017-2022
TABLE 228 Malaysia Public Cloud Business Process Services Market Value (US$ Mn), By Enterprise 2012-2016
TABLE 229 Malaysia Public Cloud Business Process Services Market Value (US$ Mn), By Enterprise 2017-2022
TABLE 230 Thailand Public Cloud Business Process Services Market Value (US$ Mn), By Process Type 2012-2016
TABLE 231 Thailand Public Cloud Business Process Services Market Value (US$ Mn), By Process Type 2017-2022
TABLE 232 Thailand Public Cloud Business Process Services Market Value (US$ Mn), By Vertical 2012-2016
TABLE 233 Thailand Public Cloud Business Process Services Market Value (US$ Mn), By Vertical 2017-2022
TABLE 234 Thailand Public Cloud Business Process Services Market Value (US$ Mn), By Enterprise 2012-2016
TABLE 235 Thailand Public Cloud Business Process Services Market Value (US$ Mn), By Enterprise 2017-2022
TABLE 236 Singapore Public Cloud Business Process Services Market Value (US$ Mn), By Process Type 2012-2016
TABLE 237 Singapore Public Cloud Business Process Services Market Value (US$ Mn), By Process Type 2017-2022
TABLE 238 Singapore Public Cloud Business Process Services Market Value (US$ Mn), By Vertical 2012-2016
TABLE 239 Singapore Public Cloud Business Process Services Market Value (US$ Mn), By Vertical 2017-2022
TABLE 240 Singapore Public Cloud Business Process Services Market Value (US$ Mn), By Enterprise 2012-2016
TABLE 241 Singapore Public Cloud Business Process Services Market Value (US$ Mn), By Enterprise 2017-2022
TABLE 242 Australia Public Cloud Business Process Services Market Value (US$ Mn), By Process Type 2012-2016
TABLE 243 Australia Public Cloud Business Process Services Market Value (US$ Mn), By Process Type 2017-2022
TABLE 244 Australia Public Cloud Business Process Services Market Value (US$ Mn), By Vertical 2012-2016
TABLE 245 Australia Public Cloud Business Process Services Market Value (US$ Mn), By Vertical 2017-2022
TABLE 246 Australia Public Cloud Business Process Services Market Value (US$ Mn), By Enterprise 2012-2016
TABLE 247 Australia Public Cloud Business Process Services Market Value (US$ Mn), By Enterprise 2017-2022
TABLE 248 GCC Countries Public Cloud Business Process Services Market Value (US$ Mn), By Process Type 2012-2016
TABLE 249 GCC Countries Public Cloud Business Process Services Market Value (US$ Mn), By Process Type 2017-2022
TABLE 250 GCC Countries Public Cloud Business Process Services Market Value (US$ Mn), By Vertical 2012-2016
TABLE 251 GCC Countries Public Cloud Business Process Services Market Value (US$ Mn), By Vertical 2017-2022
TABLE 252 GCC Countries Public Cloud Business Process Services Market Value (US$ Mn), By Enterprise 2012-2016
TABLE 253 GCC Countries Public Cloud Business Process Services Market Value (US$ Mn), By Enterprise 2017-2022
TABLE 254 South Africa Public Cloud Business Process Services Market Value (US$ Mn), By Process Type 2012-2016
TABLE 255 South Africa Public Cloud Business Process Services Market Value (US$ Mn), By Process Type 2017-2022
TABLE 256 South Africa Public Cloud Business Process Services Market Value (US$ Mn), By Vertical 2012-2016
TABLE 257 South Africa Public Cloud Business Process Services Market Value (US$ Mn), By Vertical 2017-2022
TABLE 258 South Africa Public Cloud Business Process Services Market Value (US$ Mn), By Enterprise 2012-2016
TABLE 259 South Africa Public Cloud Business Process Services Market Value (US$ Mn), By Enterprise 2017-2022
TABLE 260 Nigeria Public Cloud Business Process Services Market Value (US$ Mn), By Process Type 2012-2016
TABLE 261 Nigeria Public Cloud Business Process Services Market Value (US$ Mn), By Process Type 2017-2022
TABLE 262 Nigeria Public Cloud Business Process Services Market Value (US$ Mn), By Vertical 2012-2016
TABLE 263 Nigeria Public Cloud Business Process Services Market Value (US$ Mn), By Vertical 2017-2022
TABLE 264 Nigeria Public Cloud Business Process Services Market Value (US$ Mn), By Enterprise 2012-2016
TABLE 265 Nigeria Public Cloud Business Process Services Market Value (US$ Mn), By Enterprise 2017-2022
TABLE 266 Israel Public Cloud Business Process Services Market Value (US$ Mn), By Process Type 2012-2016
TABLE 267 Israel Public Cloud Business Process Services Market Value (US$ Mn), By Process Type 2017-2022
TABLE 268 Israel Public Cloud Business Process Services Market Value (US$ Mn), By Vertical 2012-2016
TABLE 269 Israel Public Cloud Business Process Services Market Value (US$ Mn), By Vertical 2017-2022
TABLE 270 Israel Public Cloud Business Process Services Market Value (US$ Mn), By Enterprise 2012-2016
TABLE 271 Israel Public Cloud Business Process Services Market Value (US$ Mn), By Enterprise 2017-2022`
List of Figures
FIG. 1 Global Public Cloud Business Process Services Market Value (US$ Mn), 2012-2016
FIG. 2 Global Public Cloud Business Process Services Market Value (US$ Mn) Forecast, 2017-2022
FIG. 3 Global Public Cloud Business Process Services Market Value (US$ Mn) and Y-o-Y, 2015-2022
FIG. 4 Global Cloud Payment Services Segment Market Value (US$ Mn) By Region, 2012-2016
FIG. 5 Global Cloud Payment Services Segment Market Value (US$ Mn) By Region, 2017-2022
FIG. 6 Global Cloud Payment Services Segment Y-o-Y Growth Rate, By Region, 2015-2022
FIG. 7 Global Customer Management Segment Market Value (US$ Mn) By Region, 2012-2016
FIG. 8 Global Customer Management Segment Market Value (US$ Mn) By Region, 2017-2022
FIG. 9 Global Customer Management Segment Y-o-Y Growth Rate, By Region, 2015-2022
FIG. 10 Global E-commerce Enablement Services Segment Market Value (US$ Mn) By Region, 2012-2016
FIG. 11 Global E-commerce Enablement Services Segment Market Value (US$ Mn) By Region, 2017-2022
FIG. 12 Global E-commerce Enablement Services Segment Y-o-Y Growth Rate, By Region, 2015-2022
FIG. 13 Global Finance & Accounting Services Segment Market Value (US$ Mn) By Region, 2012-2016
FIG. 14 Global Finance & Accounting Services Segment Market Value (US$ Mn) By Region, 2017-2022
FIG. 15 Global Finance & Accounting Services Segment Y-o-Y Growth Rate, By Region, 2015-2022
FIG. 16 Global Supply Chain Management Services Segment Market Value (US$ Mn) By Region, 2012-2016
FIG. 17 Global Supply Chain Management Services Segment Market Value (US$ Mn) By Region, 2017-2022
FIG. 18 Global Supply Chain Management Services Segment Y-o-Y Growth Rate, By Region, 2015-2022
FIG. 19 Global Industry Operation Segment Market Value (US$ Mn) By Region, 2012-2016
FIG. 20 Global Industry Operation Segment Market Value (US$ Mn) By Region, 2017-2022
FIG. 21 Global Industry Operation Segment Y-o-Y Growth Rate, By Region, 2015-2022
FIG. 22 Global Human Resource Management Services Segment Market Value (US$ Mn) By Region, 2012-2016
FIG. 23 Global Human Resource Management Services Segment Market Value (US$ Mn) By Region, 2017-2022
FIG. 24 Global Human Resource Management Services Segment Y-o-Y Growth Rate, By Region, 2015-2022
FIG. 25 Global Other Process Type Segment Market Value (US$ Mn) By Region, 2012-2016
FIG. 26 Global Other Process Type Segment Market Value (US$ Mn) By Region, 2017-2022
FIG. 27 Global Other Process Type Segment Y-o-Y Growth Rate, By Region, 2015-2022
FIG. 28 Global Government Segment Market Value (US$ Mn) By Region, 2012-2016
FIG. 29 Global Government Segment Market Value (US$ Mn) By Region, 2017-2022
FIG. 30 Global Government Segment Y-o-Y Growth Rate, By Region, 2015-2022
FIG. 31 Global BFSI Segment Market Value (US$ Mn) By Region, 2012-2016
FIG. 32 Global BFSI Segment Market Value (US$ Mn) By Region, 2017-2022
FIG. 33 Global BFSI Segment Y-o-Y Growth Rate, By Region, 2015-2022
FIG. 34 Global Healthcare Segment Market Value (US$ Mn) By Region, 2012-2016
FIG. 35 Global Healthcare Segment Market Value (US$ Mn) By Region, 2017-2022
FIG. 36 Global Healthcare Segment Y-o-Y Growth Rate, By Region, 2015-2022
FIG. 37 Global Telecommunicating Segment Market Value (US$ Mn) By Region, 2012-2016
FIG. 38 Global Telecommunicating Segment Market Value (US$ Mn) By Region, 2017-2022
FIG. 39 Global Telecommunicating Segment Y-o-Y Growth Rate, By Region, 2015-2022
FIG. 40 Global Media & Entertainment Segment Market Value (US$ Mn) By Region, 2012-2016
FIG. 41 Global Media & Entertainment Segment Market Value (US$ Mn) By Region, 2017-2022
FIG. 42 Global Media & Entertainment Segment Y-o-Y Growth Rate, By Region, 2015-2022
FIG. 43 Global Energy & Utilities Segment Market Value (US$ Mn) By Region, 2012-2016
FIG. 44 Global Energy & Utilities Segment Market Value (US$ Mn) By Region, 2017-2022
FIG. 45 Global Energy & Utilities Segment Y-o-Y Growth Rate, By Region, 2015-2022
FIG. 46 Global Retail/ Wholesale Segment Market Value (US$ Mn) By Region, 2012-2016
FIG. 47 Global Retail/ Wholesale Segment Market Value (US$ Mn) By Region, 2017-2022
FIG. 48 Global Retail/ Wholesale Segment Y-o-Y Growth Rate, By Region, 2015-2022
FIG. 49 Global Manufacturing Segment Market Value (US$ Mn) By Region, 2012-2016
FIG. 50 Global Manufacturing Segment Market Value (US$ Mn) By Region, 2017-2022
FIG. 51 Global Manufacturing Segment Y-o-Y Growth Rate, By Region, 2015-2022
FIG. 52 Global Transportation Segment Market Value (US$ Mn) By Region, 2012-2016
FIG. 53 Global Transportation Segment Market Value (US$ Mn) By Region, 2017-2022
FIG. 54 Global Transportation Segment Y-o-Y Growth Rate, By Region, 2015-2022
FIG. 55 Global Other Verticals Segment Market Value (US$ Mn) By Region, 2012-2016
FIG. 56 Global Other Verticals Segment Market Value (US$ Mn) By Region, 2017-2022
FIG. 57 Global Other Verticals Segment Y-o-Y Growth Rate, By Region, 2015-2022
FIG. 58 Global Large Enterprise Segment Market Value (US$ Mn) By Region, 2012-2016
FIG. 59 Global Large Enterprise Segment Market Value (US$ Mn) By Region, 2017-2022
FIG. 60 Global Large Enterprise Segment Y-o-Y Growth Rate, By Region, 2015-2022
FIG. 61 Global Small & Medium Enterprise Segment Market Value (US$ Mn) By Region, 2012-2016
FIG. 62 Global Small & Medium Enterprise Segment Market Value (US$ Mn) By Region, 2017-2022
FIG. 63 Global Small & Medium Enterprise Segment Y-o-Y Growth Rate, By Region, 2015-2022
FIG. 64 North America Public Cloud Business Process Services Market Value (US$ Mn), By Process Type 2012-2016
FIG. 65 North America Public Cloud Business Process Services Market Value (US$ Mn), By Process Type 2017-2022
FIG. 66 North America Public Cloud Business Process Services Market Value (US$ Mn), By Vertical 2012-2016
FIG. 67 North America Public Cloud Business Process Services Market Value (US$ Mn), By Vertical 2017-2022
FIG. 68 North America Public Cloud Business Process Services Market Value (US$ Mn), By Enterprise 2012-2016
FIG. 69 North America Public Cloud Business Process Services Market Value (US$ Mn), By Enterprise 2017-2022
FIG. 70 Latin America Public Cloud Business Process Services Market Value (US$ Mn), By Process Type 2012-2016
FIG. 71 Latin America Public Cloud Business Process Services Market Value (US$ Mn), By Process Type 2017-2022
FIG. 72 Latin America Public Cloud Business Process Services Market Value (US$ Mn), By Vertical 2012-2016
FIG. 73 Latin America Public Cloud Business Process Services Market Value (US$ Mn), By Vertical 2017-2022
FIG. 74 Latin America Public Cloud Business Process Services Market Value (US$ Mn), By Enterprise 2012-2016
FIG. 75 Latin America Public Cloud Business Process Services Market Value (US$ Mn), By Enterprise 2017-2022
FIG. 76 Europe Public Cloud Business Process Services Market Value (US$ Mn), By Process Type 2012-2016
FIG. 77 Europe Public Cloud Business Process Services Market Value (US$ Mn), By Process Type 2017-2022
FIG. 78 Europe Public Cloud Business Process Services Market Value (US$ Mn), By Vertical 2012-2016
FIG. 79 Europe Public Cloud Business Process Services Market Value (US$ Mn), By Vertical 2017-2022
FIG. 80 Europe Public Cloud Business Process Services Market Value (US$ Mn), By Enterprise 2012-2016
FIG. 81 Europe Public Cloud Business Process Services Market Value (US$ Mn), By Enterprise 2017-2022
FIG. 82 Japan Public Cloud Business Process Services Market Value (US$ Mn), By Process Type 2012-2016
FIG. 83 Japan Public Cloud Business Process Services Market Value (US$ Mn), By Process Type 2017-2022
FIG. 84 Japan Public Cloud Business Process Services Market Value (US$ Mn), By Vertical 2012-2016
FIG. 85 Japan Public Cloud Business Process Services Market Value (US$ Mn), By Vertical 2017-2022
FIG. 86 Japan Public Cloud Business Process Services Market Value (US$ Mn), By Enterprise 2012-2016
FIG. 87 Japan Public Cloud Business Process Services Market Value (US$ Mn), By Enterprise 2017-2022
FIG. 88 APEJ Public Cloud Business Process Services Market Value (US$ Mn), By Process Type 2012-2016
FIG. 89 APEJ Public Cloud Business Process Services Market Value (US$ Mn), By Process Type 2017-2022
FIG. 90 APEJ Public Cloud Business Process Services Market Value (US$ Mn), By Vertical 2012-2016
FIG. 91 APEJ Public Cloud Business Process Services Market Value (US$ Mn), By Vertical 2017-2022
FIG. 92 APEJ Public Cloud Business Process Services Market Value (US$ Mn), By Enterprise 2012-2016
FIG. 93 APEJ Public Cloud Business Process Services Market Value (US$ Mn), By Enterprise 2017-2022
FIG. 94 MEA Public Cloud Business Process Services Market Value (US$ Mn), By Process Type 2012-2016
FIG. 95 MEA Public Cloud Business Process Services Market Value (US$ Mn), By Process Type 2017-2022
FIG. 96 MEA Public Cloud Business Process Services Market Value (US$ Mn), By Vertical 2012-2016
FIG. 97 MEA Public Cloud Business Process Services Market Value (US$ Mn), By Vertical 2017-2022
FIG. 98 MEA Public Cloud Business Process Services Market Value (US$ Mn), By Enterprise 2012-2016
FIG. 99 MEA Public Cloud Business Process Services Market Value (US$ Mn), By Enterprise 2017-2022
Copyright © Transparency Market Research, Inc. All Rights reserved
Trust Online

Public Cloud Business Process Services Market