
Reports
Reports
Global Process Safety System Market: Snapshot
The foremost factor driving the global process safety system market is adoption of safe operational practices in process industries. The deployment of process safety system ensures prevention of explosions, accidental chemical releases, and fires in chemical and other hazardous industries. Further, deployment of process safety system prevents operational disruption due to equipment malfunction, over-temperature, metal fatigue, over-pressure, spills, leaks, and other factors.
On the downside, negligence to adopt contingency measures to combat process pitfalls is challenging the growth of global process safety system market.
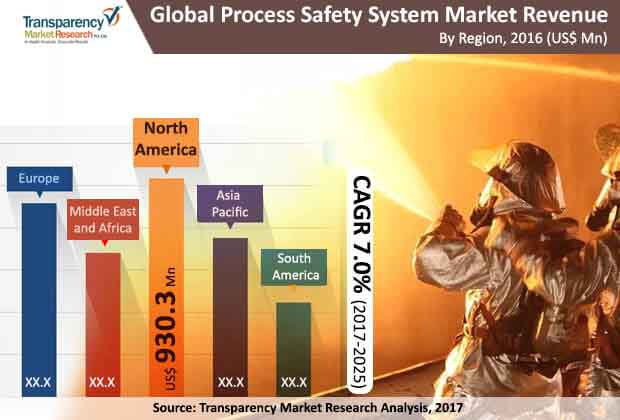
A report by Transparency Market Research (TMR) estimates the global process safety system market to expand at a CAGR of 7.0% between 2017 and 2025, for the market to be evaluated at US$5,287.8 mn by the end of 2025.
Oil and Gas to Remain Attractive End-use Segment due to Ageing of Existing Safety Systems
The global process safety system market is segmented on the basis of component, safety integrity level, application, end-use, and region in this report. The key component segments include hardware, software, and service. In 2016, hardware led the market vis-à-vis revenue followed by service. However, software segment is anticipated to rise at the leading growth rate during the forecast period owing to higher adoption of software by large industries and to enhance operational capabilities and to integrate safety systems in their processes.
On the basis of safety integrity level, the process safety system market is classified into SIL 1, SIL 2, SIL 3, and SIL 4. Of them, in 2016, SIL 1 led the market holding the leading share due to its widespread use in end use industries.
In terms of application, the segments into which the process safety system market is classified are burner management system (BMS), emergency shutdown (ESD), high integrity pressure protection system (HIPPS), turbo machinery control (TMC), and others. The emergency shutdown segment held the leading market share in 2016; going forward the segment is anticipated to display the leading CAGR over the forecast period.
By end-use, the process safety system market is classified into oil and gas, energy and power, chemical, pharmaceutical, food processing, paper and pulp, and others. Among the end users, oil and gas currently holds the leading market share. This is mainly because safety systems in the oil and gas industry are ageing that needs to be replaced by new ones. Nevertheless, end users of process safety system demand safety lifecycle management software to carry out operations safely.
Powered by China and India, Asia Pacific to Report Stellar Growth
In terms of geography, the global process safety system market is bifurcated into North America, Europe, Asia Pacific, the Middle East and Africa, and South America. In 2016, North America stood as the leading regional market for process safety system due to a robust infrastructure and government policies that mandate deployment of safety procedure in process industries for timely alerts. The region is also anticipated to dominate amongst other key regions for process safety system over the forecast period. Moreover, enterprises are opting to adopt process safety system technology due to increased awareness for safety processes. Due to this, process safety incidents have dropped by 4.8% between 2015 and 2016 in the U.S., as reported by BASF.
On the other hand, Asia Pacific process safety system market is anticipated to display stellar growth displaying the leading CAGR over the forecast period. The increasing adoption of process safety system technology by small and medium enterprises in the region is contributing substantially to the growth of this market. Increasing investments for technology-driven processes will account China and India to be at the forefront of adoption of process safety system technology over the forecast period.
Key players in the global process safety system market include General Electric Company, Rockwell Automation Inc., ABB Ltd., Emerson Electric Co., Honeywell International Inc., HIMA Paul Hildebrandt GmbH, Integraph Corporation, Schneider Electric SE, Siemens AG, and Yokogawa Electric Corporation among others.
1. Preface
1.1. Market Definition and Scope
1.2. Market Segmentation
1.3. Key Research Objectives
1.4. Research Highlights
2. Assumptions and Research Methodology
3. Executive Summary : Global Process Safety System Market
4. Market Overview
4.1. Introduction
4.2. Market Dynamics
4.2.1. Drivers
4.2.2. Restraints
4.2.3. Opportunities
4.3. Key Trends
4.4. Global Process Safety System Market Analysis and Forecasts, 2015 – 2025
4.4.1. Market Revenue Projections (US$ Mn)
4.4.2. Market Year-on-Year (Y-o-Y) Growth (Value %)
4.5. Porter’s Five Forces Analysis
4.6. Process Safety System Software Ecosystem Analysis
4.7. Market Outlook
5. Global Process Safety System Market Analysis and Forecasts, By Component
5.1. Definitions
5.2. Process Safety System Market Analysis Forecast, By Component, 2015 – 2025 (US$ Mn)
5.2.1. Hardware
5.2.2. Software
5.2.3. Services
5.3. Component Comparison Matrix
5.4. Market Attractiveness By Component
6. Global Process Safety System Market Analysis and Forecasts, By Safety Integrity Level
6.1. Definitions
6.2. Process Safety System Market Analysis Forecast, By Safety Integrity Level, 2015 – 2025 (US$ Mn)
6.2.1. SIL1
6.2.2. SIL2
6.2.3. SIL3
6.2.4. SIL4
6.3. Component Comparison Matrix
6.4. Market Attractiveness By Component
7. Global Process Safety System Market Analysis and Forecasts, By Application
7.1. Definitions
7.2. Process Safety System Market Analysis Forecast, By Application, 2015 – 2025 (US$ Mn)
7.2.1. Burner management systems (BMS)
7.2.2. Emergency shutdown (ESD)
7.2.3. High integrity pressure protection system (HIPPS)
7.2.4. Turbo machinery control (TMC)
7.2.5. Other
7.3. Application Comparison Matrix
7.4. Market Attractiveness By Application
8. Global Process Safety System Market Analysis and Forecasts, By End-Use
8.1. Overview & Definition
8.2. Key Trends
8.3. Process Safety System Market Analysis Forecast, By End-Use, 2015 – 2025 (US$ Mn)
8.3.1. Oil and Gas
8.3.2. Energy and Power
8.3.3. Chemical
8.3.4. Pharmaceutical
8.3.5. Food Processing
8.3.6. Paper and Pulp
8.3.7. Others (Water and Waste Water Management, Paint and Coating)
8.4. End-Use Comparison Matrix
8.5. Market Attractiveness By End-Use
9. Global Process Safety System Market Analysis and Forecasts, By Region
9.1. Key Findings
9.2. Process Safety System Market Analysis Forecast, By Region, 2015 – 2025 (US$ Mn)
9.2.1. North America
9.2.2. Europe
9.2.3. Asia Pacific
9.2.4. Middle East and Africa
9.2.5. South America
9.3. Market Attractiveness By Region
9.3.1. By Component
9.3.2. By End Use
9.3.3. By Country
10. North America Process Safety System Market Analysis and Forecast
10.1. Key Findings
10.2. Key Trends
10.3. Market Analysis (US$ Mn) Forecast, By Component, 2015 – 2025
10.3.1. Hardware
10.3.2. Software
10.3.3. Service
10.4. Market Analysis (US$ Mn) Forecast, By Safety Integrity Level, 2015 – 2025
10.4.1. SIL1
10.4.2. SIL2
10.4.3. SIL3
10.4.4. SIL4
10.5. Market Analysis (US$ Mn) Forecast, By Application, 2015 – 2025
10.5.1. Burner management systems (BMS)
10.5.2. Emergency shutdown (ESD)
10.5.3. High integrity pressure protection system (HIPPS)
10.5.4. Turbo machinery control (TMC)
10.5.5. Other
10.6. Market Analysis (US$ Mn) Forecast, By End Use, 2015 – 2025
10.6.1. Oil and Gas
10.6.2. Energy and Power
10.6.3. Chemical
10.6.4. Pharmaceutical
10.6.5. Food Processing
10.6.6. Paper and Pulp
10.6.7. Others (Water and Waste Water Management, Paint and Coating)
10.7. Market Analysis (US$ Mn) Forecast, By Country, 2015 – 2025
10.7.1. The U.S.
10.7.2. Canada
10.7.3. Rest of North America
10.8. Market Attractiveness Analysis
10.8.1. By Component
10.8.2. By Safety Integrity Level
10.8.3. By Application
10.8.4. By End-use
10.8.5. By Country
11. Europe Process Safety System Market Analysis and Forecast
11.1. Key Findings
11.2. Key Trends
11.3. Market Analysis (US$ Mn) Forecast, By Component, 2015 – 2025
11.3.1. Hardware
11.3.2. Software
11.3.3. Service
11.4. Market Analysis (US$ Mn) Forecast, By Safety Integrity Level, 2015 – 2025
11.4.1. SIL1
11.4.2. SIL2
11.4.3. SIL3
11.4.4. SIL4
11.5. Market Analysis (US$ Mn) Forecast, By Application, 2015 – 2025
11.5.1. Burner management systems (BMS)
11.5.2. Emergency shutdown (ESD)
11.5.3. High integrity pressure protection system (HIPPS)
11.5.4. Turbo machinery control (TMC)
11.5.5. Other
11.6. Market Analysis (US$ Mn) Forecast, By End Use, 2015 – 2025
11.6.1. Oil and Gas
11.6.2. Energy and Power
11.6.3. Chemical
11.6.4. Pharmaceutical
11.6.5. Food Processing
11.6.6. Paper and Pulp
11.6.7. Others (Water and Waste Water Management, Paint and Coating)
11.7. Market Analysis (US$ Mn) Forecast, By Country, 2015 – 2025
11.7.1. The U.K.
11.7.2. France
11.7.3. Germany
11.7.4. Rest of Europe
11.8. Market Attractiveness Analysis
11.8.1. By Component
11.8.2. By Safety Integrity Level
11.8.3. By Application
11.8.4. By End-use
11.8.5. By Country
12. Asia-Pacific Process Safety System Market Analysis and Forecast
12.1. Key Findings
12.2. Key Trends
12.3. Market Analysis (US$ Mn) Forecast, By Component, 2015 – 2025
12.3.1. Hardware
12.3.2. Software
12.3.3. Service
12.4. Market Analysis (US$ Mn) Forecast, By Safety Integrity Level, 2015 – 2025
12.4.1. SIL1
12.4.2. SIL2
12.4.3. SIL3
12.4.4. SIL4
12.5. Market Analysis (US$ Mn) Forecast, By Application, 2015 – 2025
12.5.1. Burner management systems (BMS)
12.5.2. Emergency shutdown (ESD)
12.5.3. High integrity pressure protection system (HIPPS)
12.5.4. Turbo machinery control (TMC)
12.5.5. Other
12.6. Market Analysis (US$ Mn) Forecast, By End Use, 2015 – 2025
12.6.1. Oil and Gas
12.6.2. Energy and Power
12.6.3. Chemical
12.6.4. Pharmaceutical
12.6.5. Food Processing
12.6.6. Paper and Pulp
12.6.7. Others (Water and Waste Water Management, Paint and Coating)
12.7. Market Analysis (US$ Mn) Forecast, By Country, 2015 – 2025
12.7.1. China
12.7.2. Japan
12.7.3. India
12.7.4. Rest of APAC
12.8. Market Attractiveness Analysis
12.8.1. By Component
12.8.2. By Safety Integrity Level
12.8.3. By Application
12.8.4. By End-use
12.8.5. By Country
13. Middle East & Africa Process Safety System Market Analysis and Forecast
13.1. Key Findings
13.2. Key Trends
13.3. Market Analysis (US$ Mn) Forecast, By Component, 2015 – 2025
13.3.1. Hardware
13.3.2. Software
13.3.3. Service
13.4. Market Analysis (US$ Mn) Forecast, By Safety Integrity Level, 2015 – 2025
13.4.1. SIL1
13.4.2. SIL2
13.4.3. SIL3
13.4.4. SIL4
13.5. Market Analysis (US$ Mn) Forecast, By Application, 2015 – 2025
13.5.1. Burner management systems (BMS)
13.5.2. Emergency shutdown (ESD)
13.5.3. High integrity pressure protection system (HIPPS)
13.5.4. Turbo machinery control (TMC)
13.5.5. Other
13.6. Market Analysis (US$ Mn) Forecast, By End Use, 2015 – 2025
13.6.1. Oil and Gas
13.6.2. Energy and Power
13.6.3. Chemical
13.6.4. Pharmaceutical
13.6.5. Food Processing
13.6.6. Paper and Pulp
13.6.7. Others (Water and Waste Water Management, Paint and Coating)
13.7. Market Analysis (US$ Mn) Forecast, By Country, 2015 – 2025
13.7.1. GCC Countries
13.7.2. South Africa
13.7.3. Rest of MEA
13.8. Market Attractiveness Analysis
13.8.1. By Component
13.8.2. By Safety Integrity Level
13.8.3. By Application
13.8.4. By End-use
13.8.5. By Country
14. South America Process Safety System Market Analysis and Forecast
14.1. Key Findings
14.2. Key Trends
14.3. Market Analysis (US$ Mn) Forecast, By Component, 2015 – 2025
14.3.1. Hardware
14.3.2. Software
14.3.3. Service
14.4. Market Analysis (US$ Mn) Forecast, By Safety Integrity Level, 2015 – 2025
14.4.1. SIL1
14.4.2. SIL2
14.4.3. SIL3
14.4.4. SIL4
14.5. Market Analysis (US$ Mn) Forecast, By Application, 2015 – 2025
14.5.1. Burner management systems (BMS)
14.5.2. Emergency shutdown (ESD)
14.5.3. High integrity pressure protection system (HIPPS)
14.5.4. Turbo machinery control (TMC)
14.5.5. Other
14.6. Market Analysis (US$ Mn) Forecast, By End Use, 2015 – 2025
14.6.1. Oil and Gas
14.6.2. Energy and Power
14.6.3. Chemical
14.6.4. Pharmaceutical
14.6.5. Food Processing
14.6.6. Paper and Pulp
14.6.7. Others (Water and Waste Water Management, Paint and Coating)
14.7. Market Analysis (US$ Mn) Forecast, By Country, 2015 – 2025
14.7.1. Brazil
14.7.2. Rest of South America
14.8. Market Attractiveness Analysis
14.8.1. By Component
14.8.2. By Safety Integrity Level
14.8.3. By Application
14.8.4. By End-use
14.8.5. By Country
15. Competition Landscape
15.1. Market Player – Competition Matrix
15.2. Company Profiles (Details – Overview, Financials, SWOT, Strategy)
15.2.1. ABB Ltd.
15.2.1.1. Company Details and Description (HQ, Foundation Year, Revenue, Employee Strength)
15.2.1.2. Business Overview
15.2.1.3. SWOT Analysis
15.2.1.4. Strategic Overview
15.2.2. Emerson Electric Co.
15.2.2.1. Company Details and Description (HQ, Foundation Year, Revenue, Employee Strength)
15.2.2.2. Business Overview
15.2.2.3. SWOT Analysis
15.2.2.4. Strategic Overview
15.2.3. General Electric
15.2.3.1. Company Details and Description (HQ, Foundation Year, Revenue, Employee Strength)
15.2.3.2. Business Overview
15.2.3.3. SWOT Analysis
15.2.3.4. Strategic Overview
15.2.4. HIMA Paul Hildebrandt GmbH
15.2.4.1. Company Details and Description (HQ, Foundation Year, Revenue, Employee Strength)
15.2.4.2. Business Overview
15.2.4.3. SWOT Analysis
15.2.4.4. Strategic Overview
15.2.5. Honeywell International Inc.
15.2.5.1. Company Details and Description (HQ, Foundation Year, Revenue, Employee Strength)
15.2.5.2. Business Overview
15.2.5.3. SWOT Analysis
15.2.5.4. Strategic Overview
15.2.6. Intergraph Corporation
15.2.6.1. Company Details and Description (HQ, Foundation Year, Revenue, Employee Strength)
15.2.6.2. Business Overview
15.2.6.3. SWOT Analysis
15.2.6.4. Strategic Overview
15.2.7. Rockwell Automation Inc.
15.2.7.1. Company Details and Description (HQ, Foundation Year, Revenue, Employee Strength)
15.2.7.2. Business Overview
15.2.7.3. SWOT Analysis
15.2.7.4. Strategic Overview
15.2.8. Schneider Electric
15.2.8.1. Company Details and Description (HQ, Foundation Year, Revenue, Employee Strength)
15.2.8.2. Business Overview
15.2.8.3. SWOT Analysis
15.2.8.4. Strategic Overview
15.2.9. Siemens AG
15.2.9.1. Company Details and Description (HQ, Foundation Year, Revenue, Employee Strength)
15.2.9.2. Business Overview
15.2.9.3. SWOT Analysis
15.2.9.4. Strategic Overview
15.2.10. Yokogawa Electric Corp
15.2.10.1. Company Details and Description (HQ, Foundation Year, Revenue, Employee Strength)
15.2.10.2. Business Overview
15.2.10.3. SWOT Analysis
15.2.10.4. Strategic Overview
16. Key Takeaways
List of Tables
Table 1: Global Optical Character Recognition Market Analysis and Forecast, By Type, 2015 – 2025 (US$ Mn)
Table 2: Optical Character Recognition Market Analysis, By Type, Software
Table 3: Optical Character Recognition Market Analysis, By Type, Service
Table 4: Global Optical Character Recognition Market Analysis and Forecast, By Type, Software 2015 – 2025 (US$ Mn)
Table 5: Optical Character Recognition Market Analysis, By Software, Desktop based OCR
Table 6: Optical Character Recognition Market Analysis, By Software, Mobile based OCR
Table 7: Optical Character Recognition Market Analysis, By Software, Cloud based OCR
Table 8: Optical Character Recognition Market Analysis, By Software, Others
Table 9: Global Optical Character Recognition Market Analysis and Forecast, By Software, By Cloud-based, 2015 – 2025 (US$ Mn)
Table 10: Optical Character Recognition Market Analysis, By Cloud based OCR, Multi-tenant cloud
Table 11: Optical Character Recognition Market Analysis, By Cloud based OCR, Private cloud
Table 12: Global Optical Character Recognition Market Analysis and Forecast, By Type, Service, 2015 – 2025 (US$ Mn)
Table 13: Optical Character Recognition Market Analysis, By Service, Consulting
Table 14: Optical Character Recognition Market Analysis, By Service, Outsourcing
Table 15: Optical Character Recognition Market Analysis, By Service, Implementation & Integration
Table 16: Global Optical Character Recognition Market Analysis and Forecast, By End-use, 2015 – 2025 (US$ Mn)
Table 17: Optical Character Recognition Market Analysis, By End-use, Retail
Table 18: Optical Character Recognition Market Analysis, By End-use, Government
Table 19: Optical Character Recognition Market Analysis, By End-use, BFSI
Table 20: Optical Character Recognition Market Analysis, By End-use, Education
Table 21: Optical Character Recognition Market Analysis, By End-use, Transport & Logistics
Table 22: Optical Character Recognition Market Analysis, By End-use, Healthcare
Table 23: Optical Character Recognition Market Analysis, By End-use, Media & Entertainment
Table 24: Optical Character Recognition Market Analysis, By End-use, IT & Telecom
Table 25: Optical Character Recognition Market Analysis, By End-use, Manufacturing
Table 26: Global Optical Character Recognition Market Analysis and Forecast, By Region, 2015 – 2025 (US$ Mn)
Table 27: North America Optical Character Recognition Market Size Forecast, By Type, 2015–2025 (US$ Mn)
Table 28: North America Optical Character Recognition Market Analysis, By Type
Table 29: North America Optical Character Recognition Market Size Forecast, By End-user, 2015–2025 (US$ Mn)
Table 30: North America Optical Character Recognition Market Analysis, By End-use
Table 31: North America Optical Character Recognition Market Size (US$ Mn) Forecast, By Country, 2015 - 2025
Table 32: Europe Optical Character Recognition Market Size Forecast, By Type, 2015–2025 (US$ Mn)
Table 33: Europe Optical Character Recognition Market Analysis, By Type
Table 34: Europe Optical Character Recognition Market Size Forecast, By End-use, 2015–2025 (US$ Mn)
Table 35: Europe Optical Character Recognition Market Analysis, By End-use
Table 36: Europe Optical Character Recognition Market Size (US$ Mn) Forecast, By Country, 2015 - 2025
Table 14: Asia-Pacific Optical Character Recognition Market Size Forecast, By Type, 2015–2025 (US$ Mn)
Table 37: Asia-Pacific Optical Character Recognition Market Analysis, By Type
Table 38: Asia-Pacific Optical Character Recognition Market Size Forecast, By End-use, 2015–2025 (US$ Mn)
Table 39: Asia-Pacific Optical Character Recognition Market Analysis, By End-use
Table 40: Asia-Pacific Optical Character Recognition Market Size (US$ Mn) Forecast, By Country, 2015 - 2025
Table 41: Middle East & Africa Optical Character Recognition Market Size Forecast, By Type, 2015–2025 (US$ Mn)
Table 42: Middle East & Africa Optical Character Recognition Market Analysis, By Type
Table 43: Middle East & Africa Optical Character Recognition Market Size Forecast, By End-user, 2015–2025 (US$ Mn)
Table 44: Middle East & Africa Optical Character Recognition Market Analysis, By End-use
Table 45: Middle East & Africa Optical Character Recognition Market Size (US$ Mn) Forecast, By Country, 2015 - 2025
Table 46: South America Optical Character Recognition Market Size Forecast, By Type, 2015–2025 (US$ Mn)
Table 47: South America Optical Character Recognition Market Analysis, By Type
Table 48: South America Optical Character Recognition Market Size Forecast, By End-user, 2015–2025 (US$ Mn)
Table 49: South America Optical Character Recognition Market Analysis, By End-use
Table 50: South America Optical Character Recognition Market Size (US$ Mn) Forecast, By Country, 2015 - 2025
List of Figures
Figure 1: Global Optical Character Recognition Market Analysis and (US$ Mn) Forecast, 2015–2025
Figure 2: Global Optical Character Recognition Market Value Share (Value %), By End-use, 2017
Figure 3: Global Optical Character Recognition Market Value Share (Value %) By Type, 2017
Figure 4: Global Optical Character Recognition Market Value Share (Value %) By Software Type, 2017
Figure 5: Global Optical Character Recognition Market Value Share Analysis, by Type, 2017 and 2025
Figure 6: Optical Character Recognition Market Size (US$ Mn) Forecast By Type, Software
Figure 7: Optical Character Recognition Market Size (US$ Mn) Forecast By Type, Service
Figure 8: Global Optical Character Recognition Market Value Share Analysis, by Type, Software 2017 and 2025
Figure 9: Optical Character Recognition Market Size (US$ Mn) Forecast By Software, Desktop based OCR
Figure 10: Optical Character Recognition Market Size (US$ Mn) Forecast By Software, Mobile based OCR
Figure 11: Optical Character Recognition Market Size (US$ Mn) Forecast By Software, Cloud based OCR
Figure 12: Optical Character Recognition Market Size (US$ Mn) Forecast By Software, Others
Figure 13: Global Optical Character Recognition Market Value Share Analysis, by Software, by Cloud-based,2017 and 2025
Figure 14: Optical Character Recognition Market Size (US$ Mn) Forecast By Cloud based OCR, Multi-tenant cloud
Figure 15: Optical Character Recognition Market Size (US$ Mn) Forecast By Cloud based OCR, Private
Figure 16: Global Optical Character Recognition Market Value Share Analysis, by Type, Service, 2017 and 2025
Figure 17: Optical Character Recognition Market Size (US$ Mn) Forecast By Service, Consulting
Figure 18: Optical Character Recognition Market Size (US$ Mn) Forecast By Service, Outsourcing
Figure 19: Optical Character Recognition Market Size (US$ Mn) Forecast By Service, Implementation & Integration
Figure 20: Global Optical Character Recognition Comparison Matrix, By Type
Figure 21: Global Optical Character Recognition Market Attractiveness Analysis, by Type
Figure 22: Global Optical Character Recognition Market Attractiveness Analysis, by Software
Figure 23: Global Optical Character Recognition Market Value Share Analysis, by End-use , 2017 and 2025
Figure 24: Optical Character Recognition Market Size (US$ Mn) Forecast By End-use, Retail
Figure 25: Optical Character Recognition Market Size (US$ Mn) Forecast By End-use, Government
Figure 26: Optical Character Recognition Market Size (US$ Mn) Forecast By End-use, BFSI
Figure 27: Optical Character Recognition Market Size (US$ Mn) Forecast By End-use, Education
Figure 28: Optical Character Recognition Market Size (US$ Mn) Forecast By End-use, Transport & Logistics
Figure 29: Optical Character Recognition Market Size (US$ Mn) Forecast By End-use, Healthcare
Figure 30: Optical Character Recognition Market Size (US$ Mn) Forecast By End-use, Media & Entertainment
Figure 31: Optical Character Recognition Market Size (US$ Mn) Forecast By End-use, IT & Telecom
Figure 32: Optical Character Recognition Market Size (US$ Mn) Forecast By End-use, Manufacturing
Figure 33: Global Optical Character Recognition Comparison Matrix by End-use
Figure 34: Optical Character Recognition Market Attractiveness Analysis, by End-use
Figure 35: Global Optical Character Recognition Market Value Share Analysis, by Region, 2017 and 2025
Figure 36: Optical Character Recognition Market Attractiveness Analysis, by Region
Figure 37: North America Optical Character Recognition Market Revenue (US$ Mn) Forecast, 2017 – 2025
Figure 38: North America Optical Character Recognition Market Revenue and Y-O-Y Growth Projection, 2017 – 2025
Figure 39: North America Optical Character Recognition Market Revenue Share Analysis, By Type, 2017 and 2025
Figure 40: North America Optical Character Recognition Market Value Share Analysis, By End-use, 2017 and 2025
Figure 41: North America Optical Character Recognition Market Attractiveness Analysis, By Type
Figure 42: North America Optical Character Recognition Market Attractiveness Analysis, By Country
Figure 43: North America Optical Character Recognition Market Attractiveness Analysis, By End-use
Figure 44: Europe Optical Character Recognition Market Revenue (US$ Mn) Forecast, 2017 – 2025
Figure 45: Europe Optical Character Recognition Market Revenue and Y-O-Y Growth Projection, 2017 – 2025
Figure 46: Europe Optical Character Recognition Market Revenue Share Analysis, By Type, 2017 and 2025
Figure 47: Europe Optical Character Recognition Market Value Share Analysis, By End-use, 2017 and 2025
Figure 48: Europe Optical Character Recognition Market Attractiveness Analysis, By Type
Figure 49: Europe Optical Character Recognition Market Attractiveness Analysis, By Country
Figure 50: Europe Optical Character Recognition Market Attractiveness Analysis, By End-use
Figure 51: Asia-pacific Optical Character Recognition Market Revenue (US$ Mn) Forecast, 2017 – 2025
Figure 52: Asia-Pacific Optical Character Recognition Market Revenue and Y-O-Y Growth Projection, 2017 – 2025
Figure 53: Asia-Pacific Optical Character Recognition Market Revenue Share Analysis, By Type, 2017 and 2025
Figure 54: Asia-Pacific Optical Character Recognition Market Value Share Analysis, By End-use, 2017 and 2025
Figure 55: Asia-Pacific Optical Character Recognition Market Attractiveness Analysis, By Type
Figure 56: Asia-Pacific Optical Character Recognition Market Attractiveness Analysis, By Country
Figure 57: Asia-Pacific Optical Character Recognition Market Attractiveness Analysis, By End-use
Figure 58: Middle East & Africa Optical Character Recognition Market Revenue (US$ Mn) Forecast, 2017 – 2025
Figure 59: Middle East & Africa Optical Character Recognition Market Revenue and Y-O-Y Growth Projection, 2017 – 2025
Figure 60: Middle East & Africa Optical Character Recognition Market Revenue Share Analysis, By Type, 2017 and 2025
Figure 61: Middle East & Africa Optical Character Recognition Market Value Share Analysis, By End-use, 2017 and 2025
Figure 62: Middle East & Africa Optical Character Recognition Market Attractiveness Analysis, By Type
Figure 63: Middle East & Africa Optical Character Recognition Market Attractiveness Analysis, By Country
Figure 64: Middle East & Africa Optical Character Recognition Market Attractiveness Analysis, By End-use
Figure 65: South America Optical Character Recognition Market Revenue (US$ Mn) Forecast, 2017 – 2025
Figure 66: South America Optical Character Recognition Market Revenue and Y-O-Y Growth Projection, 2017 – 2025
Figure 67: South America Optical Character Recognition Market Revenue Share Analysis, By Type, 2017 and 2025
Figure 68: South America Optical Character Recognition Market Value Share Analysis, By End-use, 2017 and 2025
Figure 69: South America Optical Character Recognition Market Attractiveness Analysis, By Type
Figure 70: South America Optical Character Recognition Market Attractiveness Analysis, By Country
Figure 71: South America Optical Character Recognition Market Attractiveness Analysis, By End-use
Copyright © Transparency Market Research, Inc. All Rights reserved
Trust Online

Process Safety System Market