
Reports
Reports
Probiotic Ingredients Market – The Era of ‘Customization’
Product innovation has been a regular feature in the food and beverage industry, as manufacturers continue to approach consumer health woes head-on. Since consumers leading a demanding lifestyle put their health concerns on the back burner, probiotic ingredients have been the on-the-go nutrition boosters. With 'capsuled health' taking over the 'health in the plate' ideology, probiotic ingredients sales have remained steady in developed countries, with sales in developing countries complementing overall revenues.
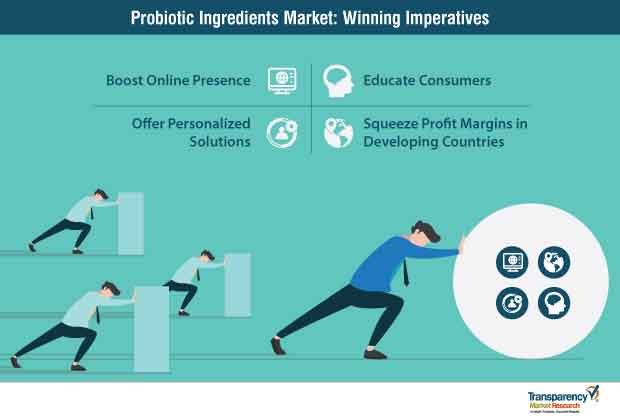
Customization, being the new business adage, comes into play as market players look to consolidate. This has unlocked a free space for probiotic ingredients manufacturers to expend their efforts towards the development of ailment-specific products, thereby implementing a strong customer acquisition strategy. However, the probiotic ingredients market is yet to explore its full potential in developing countries. This, when looked through a manufacturer’s lens, could serve as a crucial business opportunity for expansion, if picked up well with a thoughtful marketing campaign.
Sensing the obvious and the latent potential of the probiotic ingredients market, Transparency Market Research (TMR) carried out extensive research by taking a macroscopic as well as a microscopic view of the landscape. The insights presented in the report can help stakeholders in gaining a better understanding of the market.
Probiotic Ingredients Market: Expanding Applications Present New Opportunities
Probiotic ingredients market, currently valued at nearly US$ 4,200 Mn in 2018, is on a steady course, however, in some pockets, growth has plateaued as novel, and arguably safer, and alternatives have emerged.
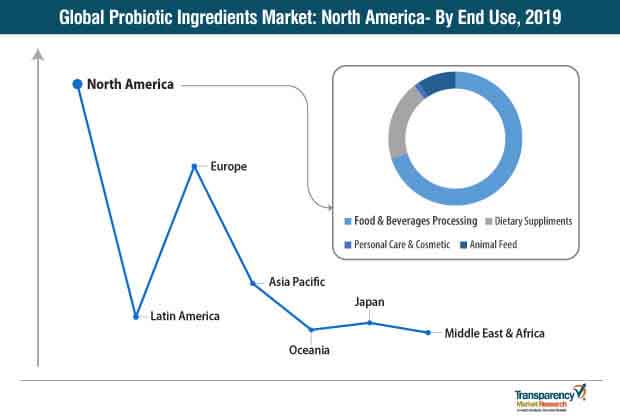
Food and beverage manufacturers are being considerate of the fact that, consumer liking is fickle, and only food products with a blend of health and taste will make it to the table. This has been popularizing the use of probiotic ingredients in almost all the F&B segments, encompassing but not confined to infant nutrition, cultured dairy products, bakery & confectionery, breakfast solutions, and snacks & bars. In the recent past, growing adoption in dietary supplements, personal care & cosmetics, and animal feed in probiotic ingredients, has created new opportunities for manufacturers.
‘Preventive’ rather than ‘reactive’ – consumer sentiment that drove probiotic and functional food sales in the developed world – is also becoming increasingly palpable in many developing countries of Asia Pacific. Average consumer spending on health and wellness products has witnessed an increase, especially among some of the fastest growing economies in the region. Stakeholders have responded by broadening their portfolio, and this has been backed by strategic marketing campaigns focusing on ‘more information less sales’. The surge in demand has been felt all across the supply chain, and ingredient suppliers are witnessing a period of bullishness.
Probiotic Ingredients Manufacturers Benefitting from Convergence of Food and Pharmaceuticals
In recent times, the convergence of ‘food-pharma’ industry has been directed towards enhancing a consumer’s general health condition. Keeping the consumers at the center, in future, the intersection will blur the point of separation between these differing landscapes. The surge in the consumption of probiotic ingredients-infused food and beverages products as 'one attack to defend health' is being witnessed among consumers, which has encouraged the food and pharma companies to progress towards developing flavorful products. The availability of probiotic ingredients in multiple forms is likely to offer the ease to the food and beverages manufacturers to blend it to further foster product innovation.
Traditionally, probiotic ingredients in the powdered form have acquired a majority of the market share. However, a dramatic shift towards the 'health in a pill' concept and the growth in the consumption of dietary supplements as a ‘preventive measure’ has offered a center stage to capsules. Currently, capsules remain the preferred consumable form of probiotic ingredients. However, the stick pack segment is expected to gain speed with time, and is likely to grow at a significant pace over the course of the forecast period.
For years, probiotic demand has been attributed to favorable consumer ‘perception’. Consumers, without looking too much into the actual health benefits of probiotics, led to a demand boom. However, in the last few years, as scientific evidence has been forthcoming, and usually, unfavorable to probiotic industry, a significant section has now started looking elsewhere. For example, a study published by National Center for Complementary and Integrative Health (NCCIH) shows that a specific type of Lactobacillus remains safe in healthy adults age 65 and older, however, all probiotics would not necessarily be safe for people in this batch of age. ‘Perception’ is now driving consumers away from probiotics, towards products where scientific literature is relatively convincing.
Probiotic Ingredients Market – Graze-worthy Opportunities on the Greener Meadows of Developing Countries
In the probiotic ingredients market, the business game intensifies as a varied batch of players play to acquire a significant market share. Customization and ailment-specific product development remain the top game plans of manufacturers operating in the dietary supplement landscape. This has led to the increase in the number of marketing and distribution partnership in the probiotics ingredients market.
However, in developing regions such as Asia Pacific, where literature leading to education regarding the benefits of probiotic ingredients is inadequate, players can shift their manufacturing-distributor partnership to the top gear and accelerate with expansion opportunities. Since consumers in such regions exhibit skeptical behavior towards novel products, squeezing profit margins by reducing prices could help manufacturers form their initial base of consumers.
Competition Intensity – Fragmented
The probiotic ingredients market remains fragmented, with numerous partakers at play at varying levels. Chr. Hansen holds a major revenue chunk of the probiotic ingredients market (nearly 15%), with Probi AB and Lallemand following, respectively. The big shots account for approximately 20-22% share of the probiotic ingredients market, with research and development activities being their key differentiating strategy.
With a view towards strengthening the product portfolio, launching novel products and filing patents help them gain the desired exposure in the probiotic ingredients market. For example, Chr. Hansen A/S announced the launch of a uniquely developed multi-strain probiotic product – Galli Pro Fit, which limits the growth of pathogens, improves gut health, and enhances the immunity of poultry animals.
However, the strategies of regional players differ to those of global players. Regional players occupy nearly 33-35% share of the probiotic ingredients market. Sensing the enormous potential of emerging countries, this batch of players diligently work towards expanding their customer base by developing customized products. For instance, Novozymes A/S inaugurated an Innovation and Technology Center in Istanbul to focus on the development of enzymes, to reduce food wastage in the MEA region.
With the adoption of multiple strategies, the probiotic ingredients market is likely to scale new highs by the end of the foreseeable timeframe.
The Analyst Viewpoint
The authors of the report foresee the probiotic ingredients market in bright light through to 2027. Manufacturers who develop customized probiotic ingredients are expected to gain higher sales prospects, as they put end-user industries’ demand at the center. Limited penetration and exposure of probiotic ingredients in emerging countries remains a lucrative opportunity pocket for manufacturers in disguise of a long-standing challenge.
While the food and beverage industry remains a crucial revenue-enabler for the probiotic ingredients market, the personal care and cosmetics industry is likely to encourage manufacturers to dive into the business opportunity and explore the deep-seated opportunities created by consumers’ drift towards organic products. Though the probiotic ingredients market remains out of the radar of any potential threat from any alternatives, the growth of the prebiotic ingredients market could have some sort of impact on its otherwise anticipated pace.
Combination Therapy of Antibiotics and Probiotic Ingredients to Combat Antibiotic Resistance
In today’s era, where medical treatment and technology have reached new heights of success, consumer reliance on antibiotics and allopathic treatment has also reached an ultimate high. However, antibiotics need to be redesigned to combat resistant mutant strains in microorganisms. This scenario has compelled biotechnologists to come up with combination therapies to effectuate the necessary treatment amongst patients. Probiotic ingredients and antibiotic have emerged as a hopeful strategy to tackle the resistance in disease-causing microbes, since developing newer antibiotics is an expensive, lengthy, and potentially dangerous technique.
Probiotic ingredients help replenish the gut with friendly bacteria. To support these positive factors, many consumers, especially in developing regions, have come to terms with the importance and benefits of probiotic ingredients, further fuelling the growth of the probiotic ingredients market. Among the developing regions, BRICS countries have shown high potential within the probiotic ingredients market.
The human gut houses over 400 million different bacterial species, which are generally referred to as friendly bacteria. These friendly bacteria are responsible for maintaining gut health and maintenance of the digestive system. Probiotic ingredients are live microbes that are cultured for human consumption. These probiotic ingredients effectuate an enhanced condition of the gut bacteria, which results in better health.
As such, a healthy balance of intestinal flora and infection control can be achieved by consuming food or food supplement products that contain friendly, live bacteria cultures, commonly referred to as 'probiotics'. In terms of value, the global probiotic ingredients market is expected to reach a market value of nearly US$ 4,500 Mn by the end of 2027, with an expected CAGR of more than 6% over the forecast period. Drivers for the growth of the probiotic ingredients market include the increasing demand for natural products with natural alternatives to synthetic food additives such as probiotic ingredients, growing disposable income of consumers, health benefits associated with probiotic ingredients, and innovation in the health food sector.
Probiotic Ingredients as a Solution for Vaginal and Digestive Tract Infections
According to health organizations such as the National Health Service, vaginal and urinary tract diseases are amongst the most common indications reported in the U.S., in the area of bacterial infections. This problem is prevalent amongst females, and in some countries, women follow a highly conservative approach towards the treatment of these problems. Hence, the consumption of probiotic ingredients offers a feasible and comfortable solution to such individuals. Probiotic ingredients provide a natural and safe remedy for their problems as compared to harsh pharmaceutical treatments. Hence, manufacturers have effectively launched probiotic ingredient products targeting the female demo graph, further boosting the growth of the probiotic ingredients market.
Opportunities in Probiotic Ingredients Market Participants
For consumers to adopt the use of probiotic ingredient-based products, it is important that they realize the complete significance of probiotic ingredients, which is a challenging task for probiotic ingredient manufacturers and marketers alike. Hence, probiotic ingredient marketers must focus on the product positioning of probiotic ingredient-based products to enhance visibility on shelves. This strategy must be implemented at regional levels, due to difference in consumer opinions about probiotic ingredients. In developed regions, consumers are more likely to opt for labelled products that also exhibit a pricy tag. However, in developing regions, consumers look for new products in the regular products aisle. This will ensure the integration of the consumption of probiotic ingredients in the daily lives of consumers.
Probiotic Ingredients Market: Natural Alternatives to Synthetic Additives a Key Strategy
Probiotic ingredients outrun chemical additives in food fortification ingredients due to their natural tag. Even amongst natural ingredients, botanical extracts are often a costlier choice for food manufacturers, and probiotic ingredients present a better option. Probiotic ingredients offer both, cost-competitive and good quality benefits to food manufacturers.
Also, manufacturers are constantly looking for an ingredient revamp in end-use products, and probiotic ingredients are an ideal choice. Developed regions also house a high number of health-conscious people, further propelling the growth of the probiotic ingredients market.
Probiotic Ingredients Market Remains Consolidated among Established Brands
The global probiotic ingredients market is dominated by five key players, who collectively account for approximately ~40% share of the global market. The probiotics market is fragmented, and is mostly in the form of partnerships and business relationships between various players. Chr. Hansen accounts for the highest revenue share of 15.2% of the global probiotics market, followed by Probi AB and Lallemand, respectively.
1. Global Probiotic Ingredients Market - Executive Summary
1.1. Global Probiotic Ingredients Market Country Analysis
1.2. Vertical Specific Market Penetration
1.3. Application – Product Mapping
1.4. Competition Blueprint
1.5. Technology Time Line Mapping
1.6. TMR Analysis and Recommendations
2. Market Overview
2.1. Market Introduction
2.2. Market Definition
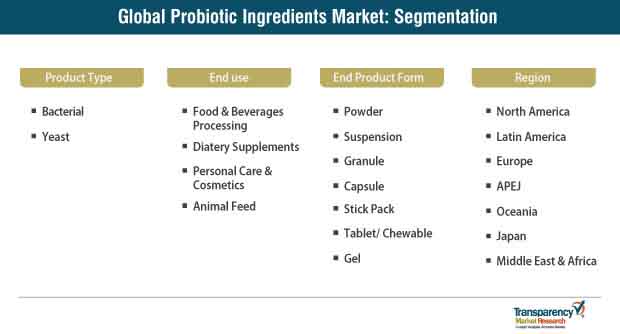
2.3. Market Taxonomy
3. Market Dynamics
3.1. Macro-economic Factors
3.1.1. Rise in Consumption of Food Items across Globe
3.1.2. Global and Regional Per Capita Food Consumption (kcal per capita per day)
3.1.3. Population of Key Countries
3.1.4. Organic Agriculture Worldwide Statistics, 2017 (Million Hectares)
3.1.4.1. Top 10 Countries with Largest Areas of Organic Agricultural Land, 2016, Million Hectares
3.1.5. Global Modern Trade Penetration and Grocery Market by Key Countries
3.1.6. Change in Consumer Price Indexes (Percentage Change) 2018 (Forecast)
3.1.7. Global Retail Dynamics
3.2. Drivers
3.2.1. Economic Drivers
3.2.2. Supply Side Drivers
3.2.3. Demand Side Drivers
3.3. Market Restraints
3.4. Market Trends
3.5. Trend Analysis- Impact on Time Line (2019-2028)
3.6. Forecast Factors – Relevance and Impact
3.7. Key Regulations By Region
4. Sentiment Analysis
4.1. Consumer Sentiment Analysis
4.1.1. Consumer Buying Pattern
4.1.2. Development of the Specification
4.1.3. Social & Economic Influencers – Factors
4.1.4. Consumer preferences: Historical Scenario and Futuristic Approach
4.1.5. Prime Tendencies
4.1.6. Factors Affecting Consumer Preferences
4.1.7. Impact of labelling, claims, and certifications
4.1.8. Others
4.2. Social Media Sentiment Analysis
4.2.1. Consumer perception for products on social media platforms- Positive and Negative Mentions
4.2.2. Trending Brands
4.2.3. Social Media Platform Mentions (% of total mentions)
4.2.4. Trending Subject Titles
4.2.5. Others
5. Associated Industry and Key Indicator Assessment
5.1. Food & Beverages Industry Overview
5.1.1. Market Size and Forecast
5.1.2. Market Size and Y-o-Y Growth
5.1.3. Absolute $ Opportunity
6. Supply Chain Analysis
6.1. Profitability and Gross Margin Analysis By Competition
6.2. List of Active Participants- By Region
6.2.1. Raw Material Suppliers
6.2.2. Key Manufacturers
6.2.3. Integrators
6.2.4. Key Distributor/Retailers
7. Global Probiotic Ingredients Market Pricing Analysis
7.1. Price Point Assessment by Product Type
7.2. Regional Average Pricing Analysis
7.2.1. North America
7.2.2. Latin America
7.2.3. Europe
7.2.4. Asia Pacific Ex. Japan (APEJ)
7.2.5. Japan
7.2.6. Oceania
7.2.7. Middle East and Africa
7.3. Price Forecast till 2027
7.4. Factors Influencing Pricing
8. Global Probiotic Ingredients Market Analysis and Forecast
8.1. Market Size Analysis (2013-2018) and Forecast (2019-2028)
8.1.1. Market Value (US$ Mn) and Volume (Tons) and Y-o-Y Growth
8.1.2. Absolute $ Opportunity
8.2. Global Probiotic Ingredients Market Scenario Forecast (Optimistic, Likely and Conservative Market Conditions)
8.2.1. Forecast Factors and Relevance of Impact
8.2.2. Regional Probiotic Ingredients Market Business Performance Summary
9. Global Probiotic Ingredients Market Analysis By Culture Type
9.1. Introduction
9.1.1. Y-o-Y Growth Comparison By Culture Type
9.1.2. Basis Point Share (BPS) Analysis By Culture Type
9.2. Probiotic Ingredients Market Size (US$ Mn) and Volume (MT) Analysis (2013-2018) & Forecast (2019-2028) By Culture Type
9.2.1. Bacterial
9.2.1.1. Lactobacillus
9.2.1.2. Bacillus
9.2.1.3. Enterococcus
9.2.1.4. Bifidobacterium
9.2.1.5. Streptococcus
9.2.1.6. Others (Pediococcus, etc.)
9.2.2. Yeast
9.2.2.1. Saccharomyces cerevisiae
9.2.2.2. Saccharomyces boulardii
9.3. Market Attractiveness Analysis By Culture Type
10. Global Probiotic Ingredients Market Analysis By End Product Form
10.1. Introduction
10.1.1. Y-o-Y Growth Comparison By End Product Form
10.1.2. Basis Point Share (BPS) Analysis By End Product Form
10.2. Probiotic Ingredients Market Size (US$ Mn) and Volume (MT) Analysis (2013-2018) & Forecast (2019-2028) By End Product Form
10.2.1. Powder
10.2.2. Suspension
10.2.3. Granule
10.2.4. Capsule
10.2.5. Stick Pack
10.2.6. Tablet/Chewable
10.2.7. Gel
10.3. Market Attractiveness Analysis By End Product Form
11. Global Probiotic Ingredients Market Analysis By End Use
11.1. Introduction
11.1.1. Y-o-Y Growth Comparison By End Use
11.1.2. Basis Point Share (BPS) Analysis By End Use
11.2. Probiotic Ingredients Market Size (US$ Mn) and Volume (MT) Analysis (2013-2018) & Forecast (2019-2028) By End Use
11.2.1. Food & Beverage Processing
11.2.1.1. Bakery & Confectionery
11.2.1.2. Breakfast Solutions
11.2.1.3. Cultured Dairy Products
11.2.1.4. Ice-Cream & Frozen Desserts
11.2.1.5. Snacks & Bars
11.2.1.6. Infant Nutrition
11.2.1.7. Beverages & Dairy Drinks
11.2.2. Dietary Supplements
11.2.2.1. Immune Health
11.2.2.2. Gut & Digestive Health
11.2.2.3. Women’s Health
11.2.3. Personal Care & Cosmetics
11.2.4. Animal Feed
11.3. Market Attractiveness Analysis By End Use
12. Global Probiotic Ingredients Market Analysis and Forecast, By Region
12.1. Introduction
12.1.1. Basis Point Share (BPS) Analysis By Region
12.1.2. Y-o-Y Growth Projections By Region
12.2. Probiotic Ingredients Market Size (US$ Mn) and Volume (MT) & Forecast (2019-2028) Analysis By Region
12.2.1. North America
12.2.2. Europe
12.2.3. APEJ
12.2.4. Japan
12.2.5. Oceania
12.2.6. Latin America
12.2.7. Middle East and Africa
12.3. Market Attractiveness Analysis By Region
13. North America Probiotic Ingredients Market Analysis and Forecast
13.1. Introduction
13.1.1. Basis Point Share (BPS) Analysis By Country
13.1.2. Y-o-Y Growth Projections By Country
13.2. Probiotic Ingredients Market Size (Value (US$) and Volume (MT) Analysis (2013-2018) and Forecast (2019-2028)
13.2.1. Market Attractiveness By Country
13.2.1.1. U.S.
13.2.1.2. Canada
13.2.2. By Culture Type
13.2.3. By End Product Form
13.2.4. By End Use
13.3. Market Attractiveness Analysis
13.3.1. By Country
13.3.2. By Culture Type
13.3.3. By End Product Form
13.3.4. By End Use
13.4. Drivers and Restraints: Impact Analysis
14. Latin America Probiotic Ingredients Market Analysis and Forecast
14.1. Introduction
14.1.1. Basis Point Share (BPS) Analysis By Country
14.1.2. Y-o-Y Growth Projections By Country
14.1.3. Key Regulations
14.2. Probiotic Ingredients Market Size (Value (US$) and Volume (MT) Analysis (2013-2018) and Forecast (2019-2028)
14.2.1. By Country
14.2.1.1. Brazil
14.2.1.2. Mexico
14.2.1.3. Chile
14.2.1.4. Peru
14.2.1.5. Argentina
14.2.1.6. Rest of Latin America
14.2.2. By Culture Type
14.2.3. By End Product Form
14.2.4. By End Use
14.3. Market Attractiveness Analysis
14.3.1. By Country
14.3.2. By Culture Type
14.3.3. By End Product Form
14.3.4. By End Use
14.4. Drivers and Restraints: Impact Analysis
15. Europe Probiotic Ingredients Market Analysis and Forecast
15.1. Introduction
15.1.1. Basis Point Share (BPS) Analysis By Country
15.1.2. Y-o-Y Growth Projections By Country
15.1.3. Key Regulations
15.2. Probiotic Ingredients Market Size (Value (US$) and Volume (MT) Analysis (2013-2018) and Forecast (2019-2028)
15.2.1. By Country
15.2.1.1. EU-4 (Germany, France, Italy, Spain)
15.2.1.2. U.K.
15.2.1.3. BENELUX
15.2.1.4. Nordic
15.2.1.5. Russia
15.2.1.6. Poland
15.2.1.7. Rest of Europe
15.2.2. By Culture Type
15.2.3. By End Product Form
15.2.4. By End Use
15.3. Market Attractiveness Analysis
15.3.1. By Country
15.3.2. By Culture Type
15.3.3. By End Product Form
15.3.4. By End Use
15.4. Drivers and Restraints: Impact Analysis
16. APEJ Probiotic Ingredients Market Analysis and Forecast
16.1. Introduction
16.1.1. Basis Point Share (BPS) Analysis By Country
16.1.2. Y-o-Y Growth Projections By Country
16.1.3. Key Regulations
16.2. Probiotic Ingredients Market Size (Value (US$) and Volume (MT) Analysis (2013-2018) and Forecast (2019-2028)
16.2.1. By Country
16.2.1.1. China
16.2.1.2. India
16.2.1.3. South Korea
16.2.1.4. ASEAN
16.2.2. By Culture Type
16.2.3. By End Product Form
16.2.4. By End Use
16.3. Market Attractiveness Analysis
16.3.1. By Country
16.3.2. By Culture Type
16.3.3. By End Product Form
16.3.4. By End Use
16.4. Drivers and Restraints: Impact Analysis
17. Japan Probiotic Ingredients Market Analysis and Forecast
17.1. Introduction
17.1.1. Basis Point Share (BPS) Analysis By Country
17.1.2. Y-o-Y Growth Projections By Country
17.1.3. Key Regulations
17.2. Probiotic Ingredients Market Size (Value (US$) and Volume (MT) Analysis (2013-2018) and Forecast (2019-2028)
17.2.1. By Culture Type
17.2.2. By End Product Form
17.2.3. By End Use
17.3. Market Attractiveness Analysis
17.3.1. By Culture Type
17.3.2. By End Product Form
17.3.3. By End Use
17.4. Drivers and Restraints: Impact Analysis
18. Oceania Probiotic Ingredients Market Analysis and Forecast
18.1. Introduction
18.1.1. Basis Point Share (BPS) Analysis By Country
18.1.2. Y-o-Y Growth Projections By Country
18.1.3. Key Regulations
18.2. Probiotic Ingredients Market Size (Value (US$) and Volume (MT) Analysis (2013-2018) and Forecast (2019-2028)
18.2.1. By Culture Type
18.2.2. By End Product Form
18.2.3. By End Use
18.3. Market Attractiveness Analysis
18.3.1. By Culture Type
18.3.2. By End Product Form
18.3.3. By End Use
18.4. Drivers and Restraints: Impact Analysis
19. Middle East and Africa (MEA) Probiotic Ingredients Market Analysis and Forecast
19.1. Introduction
19.1.1. Basis Point Share (BPS) Analysis By Country
19.1.2. Y-o-Y Growth Projections By Country
19.1.3. Key Regulations
19.2. Probiotic Ingredients Market Size (Value (US$) and Volume (MT) Analysis (2013-2018) and Forecast (2019-2028)
19.2.1. By Country
19.2.1.1. GCC Countries
19.2.1.2. South Africa
19.2.1.3. North Africa
19.2.1.4. Rest of MEA
19.2.2. By Culture Type
19.2.3. By End Product Form
19.2.4. By End Use
19.3. Market Attractiveness Analysis
19.3.1. By Country
19.3.2. By Culture Type
19.3.3. By End Product Form
19.3.4. By End Use
19.4. Drivers and Restraints: Impact Analysis
20. Competition Assessment
20.1. Global Probiotic Ingredients Market Competition - a Dashboard View
20.2. Global Probiotic Ingredients Market Structure Analysis
20.3. Global Probiotic Ingredients Market Company Share Analysis
20.3.1. For Tier 1 Market Players, 2017
20.3.2. Company Market Share Analysis of Top 10 Players, By Region
20.4. Key Participants Market Presence (Intensity Mapping) by Region
21. Brand Assessment
21.1. Brand Identity (Brand as Product, Brand as Organization, Brand as Person, Brand as Symbol)
21.2. Probiotic Ingredients Audience and Positioning (Demographic Segmentation, Geographic Segmentation, Psychographic Segmentation, Situational Segmentation)
21.3. Brand Strategy
22. Competition Deep-pe (Manufacturers/Suppliers)
22.1. Chr. Hansen A/S
22.1.1. Overview
22.1.2. Product Portfolio
22.1.3. Sales Footprint
22.1.4. Channel Footprint
22.1.4.1. Distributors List
22.1.4.2. Form (Clients)
22.1.5. Strategy Overview
22.1.5.1. Marketing Strategy
22.1.5.2. Culture Strategy
22.1.5.3. Channel Strategy
22.1.6. SWOT Analysis
22.1.7. Financial Analysis
22.1.8. Revenue Share
22.1.8.1. By Nature
22.1.8.2. By Region
22.1.9. Key Clients
22.1.10. Analyst Comments
22.2. Danisco A/S (E.I. du Pont de Nemours & Company)
22.2.1. Overview
22.2.2. Product Portfolio
22.2.3. Sales Footprint
22.2.4. Channel Footprint
22.2.4.1. Distributors List
22.2.4.2. Form (Clients)
22.2.5. Strategy Overview
22.2.5.1. Marketing Strategy
22.2.5.2. Culture Strategy
22.2.5.3. Channel Strategy
22.2.6. SWOT Analysis
22.2.7. Financial Analysis
22.2.8. Revenue Share
22.2.8.1. By Nature
22.2.8.2. By Region
22.2.9. Key Clients
22.2.10. Analyst Comments
22.3. Lallemand, Inc.
22.3.1. Overview
22.3.2. Product Portfolio
22.3.3. Sales Footprint
22.3.4. Channel Footprint
22.3.4.1. Distributors List
22.3.4.2. Form (Clients)
22.3.5. Strategy Overview
22.3.5.1. Marketing Strategy
22.3.5.2. Culture Strategy
22.3.5.3. Channel Strategy
22.3.6. SWOT Analysis
22.3.7. Financial Analysis
22.3.8. Revenue Share
22.3.8.1. By Nature
22.3.8.2. By Region
22.3.9. Key Clients
22.3.10. Analyst Comments
22.4. LeSaffre, S.A.
22.4.1. Overview
22.4.2. Product Portfolio
22.4.3. Sales Footprint
22.4.4. Channel Footprint
22.4.4.1. Distributors List
22.4.4.2. Form (Clients)
22.4.5. Strategy Overview
22.4.5.1. Marketing Strategy
22.4.5.2. Culture Strategy
22.4.5.3. Channel Strategy
22.4.6. SWOT Analysis
22.4.7. Financial Analysis
22.4.8. Revenue Share
22.4.8.1. By Nature
22.4.8.2. By Region
22.4.9. Key Clients
22.4.10. Analyst Comments
22.5. Probi AB
22.5.1. Overview
22.5.2. Product Portfolio
22.5.3. Sales Footprint
22.5.4. Channel Footprint
22.5.4.1. Distributors List
22.5.4.2. Form (Clients)
22.5.5. Strategy Overview
22.5.5.1. Marketing Strategy
22.5.5.2. Culture Strategy
22.5.5.3. Channel Strategy
22.5.6. SWOT Analysis
22.5.7. Financial Analysis
22.5.8. Revenue Share
22.5.8.1. By Nature
22.5.8.2. By Region
22.5.9. Key Clients
22.5.10. Analyst Comments
22.6. Novozymes A/S
22.6.1. Overview
22.6.2. Product Portfolio
22.6.3. Sales Footprint
22.6.4. Channel Footprint
22.6.4.1. Distributors List
22.6.4.2. Form (Clients)
22.6.5. Strategy Overview
22.6.5.1. Marketing Strategy
22.6.5.2. Culture Strategy
22.6.5.3. Channel Strategy
22.6.6. SWOT Analysis
22.6.7. Financial Analysis
22.6.8. Revenue Share
22.6.8.1. By Nature
22.6.8.2. By Region
22.6.9. Key Clients
22.6.10. Analyst Comments
22.7. Ganeden, Inc. (Kerry Plc)
22.7.1. Overview
22.7.2. Product Portfolio
22.7.3. Sales Footprint
22.7.4. Channel Footprint
22.7.4.1. Distributors List
22.7.4.2. Form (Clients)
22.7.5. Strategy Overview
22.7.5.1. Marketing Strategy
22.7.5.2. Culture Strategy
22.7.5.3. Channel Strategy
22.7.6. SWOT Analysis
22.7.7. Financial Analysis
22.7.8. Revenue Share
22.7.8.1. By Nature
22.7.8.2. By Region
22.7.9. Key Clients
22.7.10. Analyst Comments
22.8. Probiotics International Ltd. (Archer Daniels Midland)
22.8.1. Overview
22.8.2. Product Portfolio
22.8.3. Sales Footprint
22.8.4. Channel Footprint
22.8.4.1. Distributors List
22.8.4.2. Form (Clients)
22.8.5. Strategy Overview
22.8.5.1. Marketing Strategy
22.8.5.2. Culture Strategy
22.8.5.3. Channel Strategy
22.8.6. SWOT Analysis
22.8.7. Financial Analysis
22.8.8. Revenue Share
22.8.8.1. By Nature
22.8.8.2. By Region
22.8.9. Key Clients
22.8.10. Analyst Comments
22.9. Deerland Enzymes, Inc.
22.9.1. Overview
22.9.2. Product Portfolio
22.9.3. Sales Footprint
22.9.4. Channel Footprint
22.9.4.1. Distributors List
22.9.4.2. Form (Clients)
22.9.5. Strategy Overview
22.9.5.1. Marketing Strategy
22.9.5.2. Culture Strategy
22.9.5.3. Channel Strategy
22.9.6. SWOT Analysis
22.9.7. Financial Analysis
22.9.8. Revenue Share
22.9.8.1. By Nature
22.9.8.2. By Region
22.9.9. Key Clients
22.9.10. Analyst Comments
22.10. FutureCeuticals, Inc.
22.10.1. Overview
22.10.2. Product Portfolio
22.10.3. Sales Footprint
22.10.4. Channel Footprint
22.10.4.1. Distributors List
22.10.4.2. Form (Clients)
22.10.5. Strategy Overview
22.10.5.1. Marketing Strategy
22.10.5.2. Culture Strategy
22.10.5.3. Channel Strategy
22.10.6. SWOT Analysis
22.10.7. Financial Analysis
22.10.8. Revenue Share
22.10.8.1. By Nature
22.10.8.2. By Region
22.10.9. Key Clients
22.10.10. Analyst Comments
22.11. Sabinsa Corporation
22.11.1. Overview
22.11.2. Product Portfolio
22.11.3. Sales Footprint
22.11.4. Channel Footprint
22.11.4.1. Distributors List
22.11.4.2. Form (Clients)
22.11.5. Strategy Overview
22.11.5.1. Marketing Strategy
22.11.5.2. Culture Strategy
22.11.5.3. Channel Strategy
22.11.6. SWOT Analysis
22.11.7. Financial Analysis
22.11.8. Revenue Share
22.11.8.1. By Nature
22.11.8.2. By Region
22.11.9. Key Clients
22.11.10. Analyst Comments
22.12. Bifodan A/S
22.12.1. Overview
22.12.2. Product Portfolio
22.12.3. Sales Footprint
22.12.4. Channel Footprint
22.12.4.1. Distributors List
22.12.4.2. Form (Clients)
22.12.5. Strategy Overview
22.12.5.1. Marketing Strategy
22.12.5.2. Culture Strategy
22.12.5.3. Channel Strategy
22.12.6. SWOT Analysis
22.12.7. Financial Analysis
22.12.8. Revenue Share
22.12.8.1. By Nature
22.12.8.2. By Region
22.12.9. Key Clients
22.12.10. Analyst Comments
22.13. Others (On additional request)
22.13.1. Overview
22.13.2. Product Portfolio
22.13.3. Sales Footprint
22.13.4. Channel Footprint
22.13.4.1. Distributors List
22.13.4.2. Form (Clients)
22.13.5. Strategy Overview
22.13.5.1. Marketing Strategy
22.13.5.2. Culture Strategy
22.13.5.3. Channel Strategy
22.13.6. SWOT Analysis
22.13.7. Financial Analysis
22.13.8. Revenue Share
22.13.8.1. By Nature
22.13.8.2. By Region
22.13.9. Key Clients
22.13.10. Analyst Comments
23. Recommendation- Critical Success Factors
24. Research Methodology
25. Assumptions & Acronyms Used
List of Table
Table 1: Global Probiotic Ingredients Market Value (US$ Mn) Analysis and Forecast by Region, 2014-2027
Table 2: Global Probiotic Ingredients Market Volume (MT) Analysis and Forecast by Region, 2014-2027
Table 3: Global Probiotic Ingredients Market Value (US$ Mn) Analysis and Forecast by Product Type, 2014-2027
Table 4: Global Probiotic Ingredients Market Volume (MT) Analysis and Forecast by Product Type, 2014-2027
Table 5: Global Probiotic Ingredients Market Value (US$ Mn) Analysis and Forecast by End Use, 2014-2027
Table 6: Global Probiotic Ingredients Market Value (US$ Mn) Analysis and Forecast by End Use, 2014-2027
Table 7: Global Probiotic Ingredients Market Volume (MT) Analysis and Forecast by End Use, 2014-2027
Table 8: Global Probiotic Ingredients Market Volume (MT) Analysis and Forecast by End Use, 2014-2027
Table 9: Global Probiotic Ingredients Market Value (US$ Mn) Analysis and Forecast by End Product Form , 2014-2027
Table 10: Global Probiotic Ingredients Market Volume (MT) Analysis and Forecast by End Product Form , 2014-2027
Table 11: North America Probiotic Ingredients Market Value (US$ Mn) Analysis and Forecast by Country, 2014-2027
Table 12: North America Probiotic Ingredients Market Volume (MT) Analysis and Forecast by Country, 2014-2027
Table 13: North America Probiotic Ingredients Market Value (US$ Mn) Analysis and Forecast by Product Type, 2014-2027
Table 14: North America Probiotic Ingredients Market Volume (MT) Analysis and Forecast by Product Type, 2014-2027
Table 15: North America Probiotic Ingredients Market Value (US$ Mn) Analysis and Forecast by End Use, 2014-2027
Table 16: North America Probiotic Ingredients Market Value (US$ Mn) Analysis and Forecast by End Use, 2014-2027
Table 17: North America Probiotic Ingredients Market Volume (MT) Analysis and Forecast by End Use, 2014-2027
Table 18: North America Probiotic Ingredients Market Volume (MT) Analysis and Forecast by End Use, 2014-2027
Table 19: North America Probiotic Ingredients Market Value (US$ Mn) Analysis and Forecast by End Product Form , 2014-2027
Table 20: North America Probiotic Ingredients Market Volume (MT) Analysis and Forecast by End Product Form , 2014-2027
Table 21: Latin America Probiotic Ingredients Market Value (US$ Mn) Analysis and Forecast by Country, 2014-2027
Table 22: Latin America Probiotic Ingredients Market Volume (MT) Analysis and Forecast by Country, 2014-2027
Table 23: Latin America Probiotic Ingredients Market Value (US$ Mn) Analysis and Forecast by Product Type, 2014-2027
Table 24: Latin America Probiotic Ingredients Market Volume (MT) Analysis and Forecast by Product Type, 2014-2027
Table 25: Latin America Probiotic Ingredients Market Value (US$ Mn) Analysis and Forecast by End Use, 2014-2027
Table 26: Latin America Probiotic Ingredients Market Value (US$ Mn) Analysis and Forecast by End Use, 2014-2027
Table 27: Latin America Probiotic Ingredients Market Volume (MT) Analysis and Forecast by End Use, 2014-2027
Table 28: Latin America Probiotic Ingredients Market Volume (MT) Analysis and Forecast by End Use, 2014-2027
Table 29: Latin America Probiotic Ingredients Market Value (US$ Mn) Analysis and Forecast by End Product Form , 2014-2027
Table 30 : Latin America Probiotic Ingredients Market Volume (MT) Analysis and Forecast by End Product Form , 2014-2027
Table 31: Europe Probiotic Ingredients Market Value (US$ Mn) Analysis and Forecast by Country, 2014-2027
Table 32: Europe Probiotic Ingredients Market Volume (MT) Analysis and Forecast by Country, 2014-2027
Table 33: Europe Probiotic Ingredients Market Value (US$ Mn) Analysis and Forecast by Product Type, 2014-2027
Table 34: Europe Probiotic Ingredients Market Volume (MT) Analysis and Forecast by Product Type, 2014-2027
Table 35: Europe Probiotic Ingredients Market Value (US$ Mn) Analysis and Forecast by End Use, 2014-2027
Table 36: Europe Probiotic Ingredients Market Value (US$ Mn) Analysis and Forecast by End Use, 2014-2027
Table 37: Europe Probiotic Ingredients Market Volume (MT) Analysis and Forecast by End Use, 2014-2027
Table 38: Europe Probiotic Ingredients Market Volume (MT) Analysis and Forecast by End Use, 2014-2027
Table 39: Global Probiotic Ingredients Market Value (US$ Mn) Analysis and Forecast by End Product Form , 2014-2027
Table 40: Global Probiotic Ingredients Market Volume (MT) Analysis and Forecast by End Product Form , 2014-2027
Table 41: APEJ Probiotic Ingredients Market Value (US$ Mn) Analysis and Forecast by Country, 2014-2027
Table 42: APEJ Probiotic Ingredients Market Volume (MT) Analysis and Forecast by Country, 2014-2027
Table 43: APEJ Probiotic Ingredients Market Value (US$ Mn) Analysis and Forecast by Product Type, 2014-2027
Table 44: APEJ Probiotic Ingredients Market Volume (MT) Analysis and Forecast by Product Type, 2014-2027
Table 45: APEJ Probiotic Ingredients Market Value (US$ Mn) Analysis and Forecast by End Use, 2014-2027
Table 46: APEJ Probiotic Ingredients Market Value (US$ Mn) Analysis and Forecast by End Use, 2014-2027
Table 47: APEJ Probiotic Ingredients Market Volume (MT) Analysis and Forecast by End Use, 2014-2027
Table 48: APEJ Probiotic Ingredients Market Volume (MT) Analysis and Forecast by End Use, 2014-2027
Table 49: APEJ Probiotic Ingredients Market Value (US$ Mn) Analysis and Forecast by End Product Form , 2014-2027
Table 50: APEJ Probiotic Ingredients Market Volume (MT) Analysis and Forecast by End Product Form , 2014-2027
Table 51: Oceania Probiotic Ingredients Market Value (US$ Mn) Analysis and Forecast by Country, 2014-2027
Table 52: North America Probiotic Ingredients Market Volume (MT) Analysis and Forecast by Country, 2014-2027
Table 53: Oceania Probiotic Ingredients Market Value (US$ Mn) Analysis and Forecast by Product Type, 2014-2027
Table 54: Oceania Probiotic Ingredients Market Volume (MT) Analysis and Forecast by Product Type, 2014-2027
Table 55: Oceania Probiotic Ingredients Market Value (US$ Mn) Analysis and Forecast by End Use, 2014-2027
Table 56: Oceania Probiotic Ingredients Market Value (US$ Mn) Analysis and Forecast by End Use, 2014-2027
Table 57: Oceania Probiotic Ingredients Market Volume (MT) Analysis and Forecast by End Use, 2014-2027
Table 58: Oceania Probiotic Ingredients Market Volume (MT) Analysis and Forecast by End Use, 2014-2027
Table 59: Oceania Ingredients Market Value (US$ Mn) Analysis and Forecast by End Product Form , 2014-2027
Table 60: Oceania Probiotic Ingredients Market Volume (MT) Analysis and Forecast by End Product Form , 2014-2027
Table 61: Japan Probiotic Ingredients Market Value (US$ Mn) Analysis and Forecast by Product Type, 2014-2027
Table 62: Japan Probiotic Ingredients Market Volume (MT) Analysis and Forecast by Product Type, 2014-2027
Table 63: Japan Probiotic Ingredients Market Value (US$ Mn) Analysis and Forecast by End Use, 2014-2027
Table 64: Japan Probiotic Ingredients Market Value (US$ Mn) Analysis and Forecast by End Use, 2014-2027
Table 65: Japan Probiotic Ingredients Market Volume (MT) Analysis and Forecast by End Use, 2014-2027
Table 66: Japan Probiotic Ingredients Market Volume (MT) Analysis and Forecast by End Use, 2014-2027
Table 67: Japan Ingredients Market Value (US$ Mn) Analysis and Forecast by End Product Form , 2014-2027
Table 68: Japan Probiotic Ingredients Market Volume (MT) Analysis and Forecast by End Product Form , 2014-2027
Table 69: MEA Probiotic Ingredients Market Value (US$ Mn) Analysis and Forecast by Country, 2014-2027
Table 70: MEA Probiotic Ingredients Market Volume (MT) Analysis and Forecast by Country, 2014-2027
Table 71: MEA Probiotic Ingredients Market Value (US$ Mn) Analysis and Forecast by Product Type, 2014-2027
Table 72: MEA Probiotic Ingredients Market Volume (MT) Analysis and Forecast by Product Type, 2014-2027
Table 73: MEA Probiotic Ingredients Market Value (US$ Mn) Analysis and Forecast by End Use, 2014-2027
Table 74: MEA Probiotic Ingredients Market Value (US$ Mn) Analysis and Forecast by End Use, 2014-2027
Table 75: MEA Probiotic Ingredients Market Volume (MT) Analysis and Forecast by End Use, 2014-2027
Table 76: MEA Probiotic Ingredients Market Volume (MT) Analysis and Forecast by End Use, 2014-2027
Table 77: MEA Probiotic Ingredients Market Value (US$ Mn) Analysis and Forecast by End Product Form , 2014-2027
Table 78: MEA Probiotic Ingredients Market Volume (MT) Analysis and Forecast by End Product Form , 2014-2027
List of Figure
Figure 1: Global Probiotic Ingredients Market Value (US$ Mn) and Volume (MT) Forecast, 2019–2027
Figure 2: Global Probiotic Ingredients Market Absolute $ Opportunity (US$ Mn), 2019–2027
Figure 3: Global Probiotic Ingredients Market Share (%) & BPS Analysis by Region, 2019 & 2027
Figure 4: Global Probiotic Ingredients Market Y-o-Y Growth Rate (%) by Region, 2019-2027
Figure 5: Global Probiotic Ingredients Market Value (US$ Mn) Analysis & Forecast by Region, 2019–2027
Figure 6: Global Probiotic Ingredients Market Attractiveness Index by Region, 2019-2027
Figure 7: Global Probiotic Ingredients Market Share (%) & BPS Analysis by Product Type, 2019 & 2027
Figure 8: Global Probiotic Ingredients Market Y-o-Y Growth Rate (%) by Product Type, 2019-2027
Figure 9: Global Probiotic Ingredients Market Value (US$ Mn) Analysis & Forecast by Product Type, 2019–2027
Figure 10: Global Probiotic Ingredients Market Attractiveness Index by Product Type, 2019-2027
Figure 11: Global Probiotic Ingredients Market Share (%) & BPS Analysis by End Use, 2019 & 2027
Figure 12: Global Probiotic Ingredients Market Y-o-Y Growth Rate (%) by End Use, 2019-2027
Figure 13: Global Probiotic Ingredients Market Value (US$ Mn) Analysis & Forecast by End Use, 2019–2027
Figure 14: Global Probiotic Ingredients Market Attractiveness Index by End Use, 2019-2027
Figure 15: Global Probiotic Ingredients Market Share (%) & BPS Analysis by End Product Form, 2019 & 2027
Figure 16: Global Probiotic Ingredients Market Y-o-Y Growth Rate (%) by End Product Form, 2019-2027
Figure 17: Global Probiotic Ingredients Market Value (US$ Mn) Analysis & Forecast by End Product Form, 2019–2027
Figure 18: Global Probiotic Ingredients Market Attractiveness Index by End Product Form, 2019-2027
Figure 19: North America Probiotic Ingredients Market Share (%) & BPS Analysis by Country, 2019 & 2027
Figure 20: North America Probiotic Ingredients Market Y-o-Y Growth Rate (%) by Country, 2019-2027
Figure 21: North America Probiotic Ingredients Market Attractiveness Index by Country, 2019-2027
Figure 22: North America Probiotic Ingredients Market Share (%) & BPS Analysis by Product Type, 2019 & 2027
Figure 23: North America Probiotic Ingredients Market Y-o-Y Growth Rate (%) by Product Type, 2019-2027
Figure 24: North America Probiotic Ingredients Market Attractiveness Index by Product Type, 2019-2027
Figure 25: North America Probiotic Ingredients Market Share (%) & BPS Analysis by End Use, 2019 & 2027
Figure 26: North America Probiotic Ingredients Market Y-o-Y Growth Rate (%) by End Use, 2019-2027
Figure 27: North America Probiotic Ingredients Market Attractiveness Index by End Use, 2019-2027
Figure 28: North America Probiotic Ingredients Market Share (%) & BPS Analysis by End Product Form, 2019 & 2027
Figure 29: North America Probiotic Ingredients Market Y-o-Y Growth Rate (%) by End Product Form, 2019-2027
Figure 30: North America Probiotic Ingredients Market Attractiveness Index by End Product Form, 2019-2027
Figure 31: Latin America Probiotic Ingredients Market Share (%) & BPS Analysis by Country, 2019 & 2027
Figure 32: Latin America Probiotic Ingredients Market Y-o-Y Growth Rate (%) by Country, 2019-2027
Figure 33: Latin America Probiotic Ingredients Market Attractiveness Index by Country, 2019-2027
Figure 34: Latin America Probiotic Ingredients Market Share (%) & BPS Analysis by Product Type, 2019 & 2027
Figure 35: Latin America Probiotic Ingredients Market Y-o-Y Growth Rate (%) by Product Type, 2019-2027
Figure 36: Latin America Probiotic Ingredients Market Attractiveness Index by Product Type, 2019-2027
Figure 37: Latin America Probiotic Ingredients Market Share (%) & BPS Analysis by End Use, 2019 & 2027
Figure 38: Latin America Probiotic Ingredients Market Y-o-Y Growth Rate (%) by End Use, 2019-2027
Figure 39: Latin America Probiotic Ingredients Market Attractiveness Index by End Use, 2019-2027
Figure 40: Latin America Probiotic Ingredients Market Share (%) & BPS Analysis by End Product Form, 2019 & 2027
Figure 41: Latin America Probiotic Ingredients Market Y-o-Y Growth Rate (%) by End Product Form, 2019-2027
Figure 42: Latin America Probiotic Ingredients Market Attractiveness Index by End Product Form, 2019-2027
Figure 43: Europe Probiotic Ingredients Market Share (%) & BPS Analysis by Country, 2019 & 2027
Figure 44: Europe Probiotic Ingredients Market Y-o-Y Growth Rate (%) by Country, 2019-2027
Figure 45: Europe Probiotic Ingredients Market Attractiveness Index by Country, 2019-2027
Figure 46: Europe Probiotic Ingredients Market Share (%) & BPS Analysis by Product Type, 2019 & 2027
Figure 47: Europe Probiotic Ingredients Market Y-o-Y Growth Rate (%) by Product Type, 2019-2027
Figure 48: Europe Probiotic Ingredients Market Attractiveness Index by Product Type, 2019-2027
Figure 49: Europe Probiotic Ingredients Market Share (%) & BPS Analysis by End Use, 2019 & 2027
Figure 50: Europe Probiotic Ingredients Market Y-o-Y Growth Rate (%) by End Use, 2019-2027
Figure 51: Europe Probiotic Ingredients Market Attractiveness Index by End Use, 2019-2027
Figure 52: Europe Probiotic Ingredients Market Share (%) & BPS Analysis by End Product Form, 2019 & 2027
Figure 53: Europe Probiotic Ingredients Market Y-o-Y Growth Rate (%) by End Product Form, 2019-2027
Figure 54: Europe Probiotic Ingredients Market Attractiveness Index by End Product Form, 2019-2027
Figure 55: APEJ Probiotic Ingredients Market Share (%) & BPS Analysis by Country, 2019 & 2027
Figure 56: APEJ Probiotic Ingredients Market Y-o-Y Growth Rate (%) by Country, 2019-2027
Figure 57: APEJ Probiotic Ingredients Market Attractiveness Index by Country, 2019-2027
Figure 58: APEJ Probiotic Ingredients Market Share (%) & BPS Analysis by Product Type, 2019 & 2027
Figure 59: APEJ Probiotic Ingredients Market Y-o-Y Growth Rate (%) by Product Type, 2019-2027
Figure 60: APEJ Probiotic Ingredients Market Attractiveness Index by Product Type, 2019-2027
Figure 61: APEJ Probiotic Ingredients Market Share (%) & BPS Analysis by End Use, 2019 & 2027
Figure 62: APEJ Probiotic Ingredients Market Y-o-Y Growth Rate (%) by End Use, 2019-2027
Figure 63: APEJ Probiotic Ingredients Market Attractiveness Index by End Use, 2019-2027
Figure 64: APEJ Probiotic Ingredients Market Share (%) & BPS Analysis by End Product Form, 2019 & 2027
Figure 65: APEJ Probiotic Ingredients Market Y-o-Y Growth Rate (%) by End Product Form, 2019-2027
Figure 66: APEJ Probiotic Ingredients Market Attractiveness Index by End Product Form, 2019-2027
Figure 67: Oceania Probiotic Ingredients Market Share (%) & BPS Analysis by Country, 2019 & 2027
Figure 68: Oceania Probiotic Ingredients Market Y-o-Y Growth Rate (%) by Country, 2019-2027
Figure 69: Oceania Probiotic Ingredients Market Attractiveness Index by Country, 2019-2027
Figure 70: Oceania Probiotic Ingredients Market Share (%) & BPS Analysis by Product Type, 2019 & 2027
Figure 71: Oceania Probiotic Ingredients Market Y-o-Y Growth Rate (%) by Product Type, 2019-2027
Figure 72: Oceania Probiotic Ingredients Market Attractiveness Index by Product Type, 2019-2027
Figure 73: Oceania Probiotic Ingredients Market Share (%) & BPS Analysis by End Use, 2019 & 2027
Figure 74: Oceania Probiotic Ingredients Market Y-o-Y Growth Rate (%) by End Use, 2019-2027
Figure 75: Oceania Probiotic Ingredients Market Attractiveness Index by End Use, 2019-2027
Figure 76: Oceania Probiotic Ingredients Market Share (%) & BPS Analysis by End Product Form, 2019 & 2027
Figure 77: Oceania Probiotic Ingredients Market Y-o-Y Growth Rate (%) by End Product Form, 2019-2027
Figure 78: Oceania Probiotic Ingredients Market Attractiveness Index by End Product Form, 2019-2027
Figure 79: Japan Probiotic Ingredients Market Share (%) & BPS Analysis by Product Type, 2019 & 2027
Figure 80: Japan Probiotic Ingredients Market Y-o-Y Growth Rate (%) by Product Type, 2019-2027
Figure 81: Japan Probiotic Ingredients Market Attractiveness Index by Product Type, 2019-2027
Figure 82: Japan Probiotic Ingredients Market Share (%) & BPS Analysis by End Use, 2019 & 2027
Figure 83: Japan Probiotic Ingredients Market Y-o-Y Growth Rate (%) by End Use, 2019-2027
Figure 84: Japan Probiotic Ingredients Market Attractiveness Index by End Use, 2019-2027
Figure 85: Japan Probiotic Ingredients Market Share (%) & BPS Analysis by End Product Form, 2019 & 2027
Figure 86: Japan Probiotic Ingredients Market Y-o-Y Growth Rate (%) by End Product Form, 2019-2027
Figure 87: Japan Probiotic Ingredients Market Attractiveness Index by End Product Form, 2019-2027
Figure 88: MEA Probiotic Ingredients Market Share (%) & BPS Analysis by Country, 2019 & 2027
Figure 89: MEA Probiotic Ingredients Market Y-o-Y Growth Rate (%) by Country, 2019-2027
Figure 90: MEA Probiotic Ingredients Market Attractiveness Index by Country, 2019-2027
Figure 91: MEA Probiotic Ingredients Market Share (%) & BPS Analysis by Product Type, 2019 & 2027
Figure 92: MEA Probiotic Ingredients Market Y-o-Y Growth Rate (%) by Product Type, 2019-2027
Figure 93: MEA Probiotic Ingredients Market Attractiveness Index by Product Type, 2019-2027
Figure 94: MEA Probiotic Ingredients Market Share (%) & BPS Analysis by End Use, 2019 & 2027
Figure 95: MEA Probiotic Ingredients Market Y-o-Y Growth Rate (%) by End Use, 2019-2027
Figure 96: MEA Probiotic Ingredients Market Attractiveness Index by End Use, 2019-2027
Figure 97: MEA Probiotic Ingredients Market Share (%) & BPS Analysis by End Product Form, 2019 & 2027
Figure 98: MEA Probiotic Ingredients Market Y-o-Y Growth Rate (%) by End Product Form, 2019-2027
Figure 99: MEA Probiotic Ingredients Market Attractiveness Index by End Product Form, 2019-2027
Copyright © Transparency Market Research, Inc. All Rights reserved
Trust Online

Probiotic Ingredients Market