
Reports
Reports
According to a new market report pertaining to the global visualization & 3d rendering software market published by Transparency Market Research the global visualization & 3D rendering software market was valued at US$ 1,097.7 Mn in 2019 and is projected to reach US$ 6,332.1 Mn by 2027, at a CAGR of 24.5% during the forecast period from 2020 to 2027. Expansion of the visualization & 3d rendering software market can be attributed to less time required for 3D rendering activity across industry segment with reduced cost and major introduction of 3D enabled display devices in public places and business sector. North America is anticipated to lead the global visualization & 3d rendering software market in terms of revenue, followed by Europe, during the forecast period.
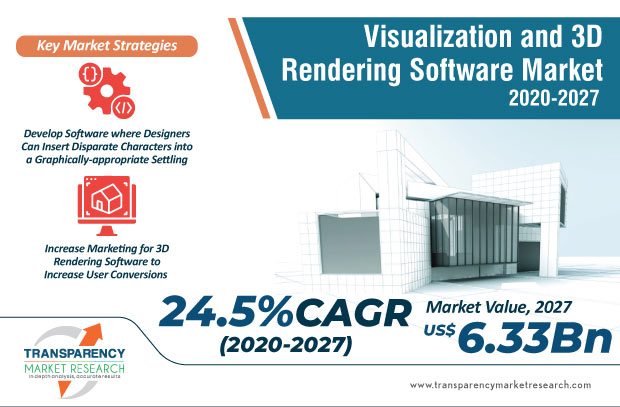
Visualization and 3D rendering software are used for creating graphical interfaces and displays for software solutions and converting 3D models into 2D images or videos. Visualization software includes graphical objects and components which are used for applications and displays with the help of software editors. These software are used for graphical user interfaces in industries to display the required information in an effective manner. 3D rendering software are used for creating 2D image or animation from the established scene with 3D effects. Visual presentation is the most effective form of marketing nowadays as social media has become immensely powerful channel. 3D rendering helps in presenting the promotional photos and videos in an attractive way. This visualization and 3D rendering software are used extensively in architectural & designer firms, visual effect companies, automotive, telecommunication and other industry segments. Rendering is the final process of creating the actual 2D image or animation from the prepared scene. 3D rendering software takes user-created 3D models and place them into 3D environments or images. With 3D rendering programs, graphic designers and media developers can insert disparate objects and characters, imported from 3D modeling programs, into a graphically appropriate settling. These 3D rendered images are often scalable, navigable, and interactive. 3D rendering software may include some animation tools or these software may integrate with animation software to bring scenes to life, for later use in video games, movies, television shows, or other media. These programs can also have features such as lighting and texturing, which can add depth and realism to scenes. Visual artists in entertainment, automotive, architecture, advertising, and web design industries utilize these tools to create lifelike scenes for use in media or client engagement purposes.
The process of 3D rendering is increasingly being used to convert images of buildings, animated characters, sceneries and other such 3D geometric models into images with desired simulation, optical effects and other such innovative characteristics. It enables architects, interior decorators and designers to design and view the construction and interiors much before they are actually made. In the field of engineering, the software is being used to conceptualize, design, represent and analyze parts of machines. Less time required for 3D rendering activity across industry segment with reduced cost, Just-in-time-marketing has increased the need for creating marketing collaterals in short period of time, and Major introduction of 3D enabled display devices in public places and business sector are the major growth drivers for global visualization & 3D rendering software market.
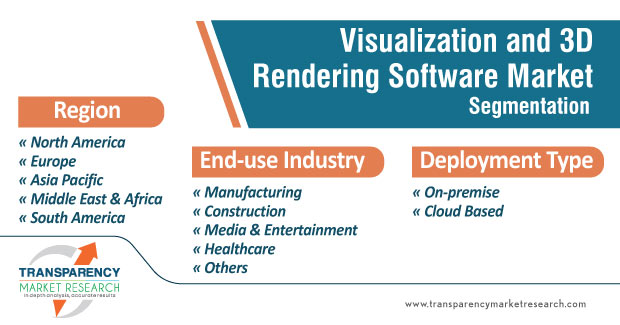
On the basis of deployment type, the visualization & 3D rendering software market is categorized into on-premise and cloud. On-premise based 3D rendering software comprise the largest segment, accounting for a market share of approximately 61.8%. This on-premise based deployment market is expected to steadily decrease over the forecast period. The cloud based deployment of 3D rendering software with take steady growth over forecast period, thus, they are expected to witness significant demand in the global visualization & 3D rendering software market.
On the basis of end-use industry vertical, the visualization & 3D rendering software market is segmented into the Manufacturing, Construction, Media & Entertainment, Healthcare, and others segments. Majority of the architects are more likely to adopt this 3D rendering software technology for their projects, which increases the use of visualization & 3D rendering software. The construction industry vertical is the major contributor for usage of 3D rendering software. This is because it’s increasingly usage by Architects, Designer, BIM modelers, etc. After construction, the usage of 3D Rendering Software for Media & Entertainment industry mostly in North America is significant due to need of 3D rendering software for animation, VFX, digital media, film industry, etc.
North America and Europe are the key regions driving the growth of the global visualization & 3D rendering software market. But over the forecast period, the Visualization & 3D Rendering Software market is expected to grow significantly in Asia Pacific region due to its growing economy, large number of construction projects, and population growth
In 2018, key visualization & 3D rendering software vendors included
1. Preface
1.1. Market Definition and Scope
1.2. Market Segmentation
1.3. Key Research Objectives
1.4. Research Highlights
2. Assumptions and Research Methodology
3. Executive Summary: Global Visualization and 3D Rendering Software Market
4. Market Overview
4.1. Introduction
4.1.1. Industry Evolution/ Deployment Type
4.2. Market Dynamics
4.2.1. Drivers
4.2.2. Restraints
4.2.3. Opportunities
4.3. Global Visualization and 3D Rendering Software Market Analysis and Forecasts, 2018 – 2027
4.3.1. Market Revenue Projections (US$ Mn)
4.4. Key Trend Analysis
4.5. Porter’s Five Force Analysis
4.6. Market Outlook
5. Global Visualization and 3D Rendering Software Market Analysis and Forecasts, by Deployment Type
5.1. Introductions & Definitions
5.2. Visualization and 3D Rendering Software Market Size (US$ Mn) Forecasts, by Deployment Type, 2018 – 2027
5.2.1. On Premise
5.2.2. Cloud
5.3. Deployment Type Comparison Matrix
5.4. Market Attractiveness by Deployment Type
6. Global Visualization and 3D Rendering Software Market Analysis and Forecasts, by End Use Vertical
6.1. Introduction & Definitions
6.2. Visualization and 3D Rendering Software Market Size (US$ Mn) Forecasts, by End-use Vertical, 2018 – 2027
6.2.1. Manufacturing
6.2.2. Construction
6.2.3. Media & Entertainment
6.2.4. Healthcare
6.2.5. Others
6.3. End-use Vertical Comparison Matrix
6.4. Market Attractiveness by End-use Vertical
7. Global Visualization and 3D Rendering Software Market Analysis and Forecasts, by Region
7.1. Visualization and 3D Rendering Software Market Size (US$ Mn) Forecasts, by Region, 2018 – 2027
7.1.1. North America
7.1.2. Europe
7.1.3. Asia Pacific
7.1.4. Middle East and Africa
7.1.5. South America
7.2. Market Attractiveness by Country/Region
8. North America Visualization and 3D Rendering Software Market Analysis and Forecast
8.1. Visualization and 3D Rendering Software Market Size (US$ Mn) Forecasts, by Deployment Type, 2018 – 2027
8.1.1. On Premise
8.1.2. Cloud
8.2. Visualization and 3D Rendering Software Market Size (US$ Mn) Forecasts, by End-use Vertical, 2018 – 2027
8.2.1. Manufacturing
8.2.2. Construction
8.2.3. Media & Entertainment
8.2.4. Healthcare
8.2.5. Others
8.3. Visualization and 3D Rendering Software Market Size and (US$ Mn) Forecasts, by Country, 2018 – 2027
8.3.1. The U.S.
8.3.2. Canada
8.3.3. Rest of North America
8.4. Market Attractiveness Analysis
8.4.1. by Deployment Type
8.4.2. by End-use Vertical
8.4.3. by Country
9. Europe Visualization and 3D Rendering Software Market Analysis and Forecast
9.1. Visualization and 3D Rendering Software Market Size (US$ Mn) Forecasts, by Deployment Type, 2018 – 2027
9.1.1. On Premise
9.1.2. Cloud
9.2. Visualization and 3D Rendering Software Market Size (US$ Mn) Forecasts, by End-use Vertical, 2018 – 2027
9.2.1. Manufacturing
9.2.2. Construction
9.2.3. Media & Entertainment
9.2.4. Healthcare
9.2.5. Others
9.3. Visualization and 3D Rendering Software Market Size (US$ Mn) Forecasts, by Country, 2018 – 2027
9.3.1. The U.K.
9.3.2. Germany
9.3.3. France
9.3.4. Rest of Europe
9.4. Market Attractiveness Analysis
9.4.1. by Deployment Type
9.4.2. by End-use Vertical
9.4.3. by Country
10. Asia Pacific Visualization and 3D Rendering Software Market Analysis and Forecast
10.1. Visualization and 3D Rendering Software Market Size (US$ Mn) Forecasts, by Deployment Type, 2018 – 2027
10.1.1. On Premise
10.1.2. Cloud
10.2. Visualization and 3D Rendering Software Market Size (US$ Mn) Forecasts, by End-use Vertical, 2018 – 2027
10.2.1. Manufacturing
10.2.2. Construction
10.2.3. Media & Entertainment
10.2.4. Healthcare
10.2.5. Others
10.3. Visualization and 3D Rendering Software Market Size (US$ Mn) Forecasts, by Country, 2018 – 2027
10.3.1. India
10.3.2. Japan
10.3.3. China
10.3.4. Rest of Asia Pacific
10.4. Market Attractiveness Analysis
10.4.1. by Deployment Type
10.4.2. by End-use Vertical
10.4.3. by Country
11. Middle East and Africa (MEA) Visualization and 3D Rendering Software Market Analysis and Forecast
11.1. Visualization and 3D Rendering Software Market Size (US$ Mn) Forecasts, by Deployment Type, 2018 – 2027
11.1.1. On Premise
11.1.2. Cloud
11.2. Visualization and 3D Rendering Software Market Size (US$ Mn) Forecasts, by End-use Vertical, 2018 – 2027
11.2.1. Manufacturing
11.2.2. Construction
11.2.3. Media & Entertainment
11.2.4. Healthcare
11.2.5. Others
11.3. Visualization and 3D Rendering Software Market Size (US$ Mn) Forecasts, by Country, 2018 – 2027
11.3.1. GCC
11.3.2. South Africa
11.3.3. Rest of MEA
11.4. Market Attractiveness Analysis
11.4.1. by Deployment Type
11.4.2. by End-use Vertical
11.4.3. by Country
12. South America Visualization and 3D Rendering Software Market Analysis and Forecast
12.1. Visualization and 3D Rendering Software Market Size (US$ Mn) Forecasts, by Deployment Type, 2018 – 2027
12.1.1. On Premise
12.1.2. Cloud
12.2. Visualization and 3D Rendering Software Market Size (US$ Mn) Forecasts, by End-use Vertical, 2018 – 2027
12.2.1. Manufacturing
12.2.2. Construction
12.2.3. Media & Entertainment
12.2.4. Healthcare
12.2.5. Others
12.3. Visualization and 3D Rendering Software Market Size (US$ Mn) Forecasts, by Country, 2018 – 2027
12.3.1. Brazil
12.3.2. Rest of South America
12.4. Market Attractiveness Analysis
12.4.1. by Deployment Type
12.4.2. by End-use Vertical
12.4.3. by Country
13. Competition Landscape
13.1. Market Player – Competition Matrix
13.2. Market Share Analysis by Company (2019)
13.3. Company Profiles (Details – Overview, Financials, SWOT, Strategy)
13.3.1. Autodesk Inc.
13.3.1.1. Overview
13.3.1.2. Financials
13.3.1.3. SWOT
13.3.1.4. Strategy
13.3.2. Luxion Inc.
13.3.2.1. Overview
13.3.2.2. Financials
13.3.2.3. SWOT
13.3.2.4. Strategy
13.3.3. Dassault Systems
13.3.3.1. Overview
13.3.3.2. Financials
13.3.3.3. SWOT
13.3.3.4. Strategy
13.3.4. NVIDIA Corporation
13.3.4.1. Overview
13.3.4.2. Financials
13.3.4.3. SWOT
13.3.4.4. Strategy
13.3.5. Abvent Group
13.3.5.1. Overview
13.3.5.2. Financials
13.3.5.3. SWOT
13.3.5.4. Strategy
13.3.6. Act-3D B.V.
13.3.6.1. Overview
13.3.6.2. Financials
13.3.6.3. SWOT
13.3.6.4. Strategy
13.3.7. Cebas Visual Technology Inc.
13.3.7.1. Overview
13.3.7.2. Financials
13.3.7.3. SWOT
13.3.7.4. Strategy
13.3.8. Chaos Group
13.3.8.1. Overview
13.3.8.2. Financials
13.3.8.3. SWOT
13.3.8.4. Strategy
13.3.9. Next Limit S.L
13.3.9.1. Overview
13.3.9.2. Financials
13.3.9.3. SWOT
13.3.9.4. Strategy
13.3.10. OTOY Inc.
13.3.10.1. Overview
13.3.10.2. Financials
13.3.10.3. SWOT
13.3.10.4. Strategy
14. Key Takeaways
List of Tables
Table 1 Global Visualization and 3D Rendering Software Market Revenue (US$ Mn) Forecast, by Deployment Type, 2018 – 2027
Table 2 Global Visualization and 3D Rendering Software Market CAGR by Deployment Type
Table 3 Global Visualization and 3D Rendering Software Market Revenue (US$ Mn) Forecast, by End-use Vertical, 2018 – 2027
Table 4 Global Visualization and 3D Rendering Software Market CAGR by End-use Segment
Table 5 Global Visualization and 3D Rendering Software Market Revenue (US$ Mn) Forecast, by Region, 2018 – 2027
Table 6 Global Visualization and 3D Rendering Software Market CAGR by Region
Table 7 North America Visualization and 3D Rendering Software Market Revenue (US$ Mn) Forecast, by Deployment Type, 2018 – 2027
Table 8 North America Visualization and 3D Rendering Software Market Revenue (US$ Mn) Forecast, by End-use Vertical, 2018 – 2027
Table 9 North America Visualization and 3D Rendering Software Market Revenue (US$ Mn) Forecast, by Country, 2018 – 2027
Table 10 North America Visualization and 3D Rendering Software Market Value Share Analysis, by Deployment Type, 2019 and 2027
Table 11 North America Visualization and 3D Rendering Software Market Value Share Analysis, by End-use Vertical, 2019 and 2027
Table 12 North America Visualization and 3D Rendering Software Market CAGR by Deployment Type
Table 13 North America Visualization and 3D Rendering Software Market CAGR by End-use Vertical
Table 14 Europe Visualization and 3D Rendering Software Market Revenue (US$ Mn) Forecast, by Deployment Type, 2018 – 2027
Table 15 Europe Visualization and 3D Rendering Software Market Revenue (US$ Mn) Forecast, by End-use Vertical, 2018 – 2027
Table 16 Europe Visualization and 3D Rendering Software Market Revenue (US$ Mn) Forecast, by Country, 2018 – 2027
Table 17 Europe Visualization and 3D Rendering Software Market Value Share Analysis, by Deployment Type, 2019 and 2027
Table 18 Europe Visualization and 3D Rendering Software Market Value Share Analysis, by End-use Vertical, 2019 and 2027
Table 19 Europe Visualization and 3D Rendering Software Market CAGR by Deployment Type
Table 20 Europe Visualization and 3D Rendering Software Market CAGR by End-use Vertical
Table 21 APAC Visualization and 3D Rendering Software Market Revenue (US$ Mn) Forecast, by Deployment Type, 2018 – 2027
Table 22 APAC Visualization and 3D Rendering Software Market Revenue (US$ Mn) Forecast, by End-use Vertical, 2018 – 2027
Table 23 APAC Visualization and 3D Rendering Software Market Revenue (US$ Mn) Forecast, by Country, 2018 – 2027
Table 24 APAC Visualization and 3D Rendering Software Market Value Share Analysis, by Deployment Type, 2019 and 2027
Table 25 APAC Visualization and 3D Rendering Software Market Value Share Analysis, by End-use Vertical, 2019 and 2027
Table 26 APAC Visualization and 3D Rendering Software Market CAGR by Deployment Type
Table 27 APAC Visualization and 3D Rendering Software Market CAGR by End-use Vertical
Table 28 Middle East & Africa (MEA) Visualization and 3D Rendering Software Market Revenue (US$ Mn) Forecast, by Deployment Type, 2018 – 2027
Table 29 Middle East & Africa (MEA) Visualization and 3D Rendering Software Market Revenue (US$ Mn) Forecast, by End-use Vertical, 2018 – 2027
Table 30 Middle East & Africa (MEA) Visualization and 3D Rendering Software Market Revenue (US$ Mn) Forecast, by Country, 2018 – 2027
Table 31 Middle East & Africa (MEA) Visualization and 3D Rendering Software Market Value Share Analysis, by Deployment Type, 2019 and 2027
Table 32 Middle East & Africa (MEA) Visualization and 3D Rendering Software Market Value Share Analysis, by End-use Vertical, 2019 and 2027
Table 33 Middle East & Africa (MEA) Visualization and 3D Rendering Software Market CAGR by Deployment Type
Table 34 Middle East & Africa (MEA) Visualization and 3D Rendering Software Market CAGR by End-use Vertical
Table 35 South America Visualization and 3D Rendering Software Market Revenue (US$ Mn) Forecast, by Deployment Type, 2018 – 2027
Table 36 South America Visualization and 3D Rendering Software Market Revenue (US$ Mn) Forecast, by End-use Vertical, 2018 – 2027
Table 37 South America Visualization and 3D Rendering Software Market Revenue (US$ Mn) Forecast, by Country, 2018 – 2027
Table 38 South America Visualization and 3D Rendering Software Market Value Share Analysis, by Deployment Type, 2019 and 2027
Table 39 South America Visualization and 3D Rendering Software Market Value Share Analysis, by End-use Vertical, 2019 and 2027
Table 40 South America Visualization and 3D Rendering Software Market CAGR by Deployment Type
Table 41 South America Visualization and 3D Rendering Software Market CAGR by End-use Vertical
List of Figures
Figure 1 Global Visualization and 3D Rendering Software Market - Share Analysis
Figure 2 Global Visualization and 3D Rendering Software Market Share, by Region, 2027
Figure 3 Global Visualization and 3D Rendering Software Market Revenue Projection (US$ Mn), 2018 – 2027
Figure 4 Global Visualization and 3D Rendering Software Market Y-o-Y Growth (%) Forecast, 2018 - 2027
Figure 5 Porter’s Five Forces Analysis
Figure 6 Global Visualization and 3D Rendering Software Market Revenue Share by Deployment Type (2019)
Figure 7 Global Visualization and 3D Rendering Software Market Revenue Share by End-use Vertical (2019)
Figure 8 Global Visualization and 3D Rendering Software Market Revenue Share by Region (2019)
Figure 9 Global Visualization and 3D Rendering Software Market Revenue, by Deployment Type – On Premise, 2018 – 2027, (US$ Mn)
Figure 10 Global Visualization and 3D Rendering Software Market Y-o-Y Growth (Value %) Forecast, by Deployment Type – On Premise, 2018 – 2027
Figure 11 Global Visualization and 3D Rendering Software Market Revenue, by Deployment Type – Cloud, 2018 – 2027, (US$ Mn)
Figure 12 Global Visualization and 3D Rendering Software Market Y-o-Y Growth (Value %) Forecast, by Deployment Type – Cloud, 2018 – 2027
Figure 13 Deployment Type Comparison Matrix
Figure 14 Global Visualization and 3D Rendering Software Market Value Share Analysis, by Deployment Type, 2019 and 2027
Figure 15 Visualization and 3D Rendering Software Market Attractiveness Analysis by Deployment Type
Figure 16 Global Visualization and 3D Rendering Software Market Revenue, by End-use Vertical– Manufacturing, 2018 – 2027, (US$ Mn)
Figure 17 Global Visualization and 3D Rendering Software Market Revenue, by End-use Vertical– Construction, 2018 – 2027, (US$ Mn)
Figure 18 Global Visualization and 3D Rendering Software Market Revenue, by End-use Vertical– Media & Entertainment, 2018 – 2027, (US$ Mn)
Figure 19 Global Visualization and 3D Rendering Software Market Revenue, by End-use Vertical– Healthcare, 2018 – 2027, (US$ Mn)
Figure 20 End-use Vertical Comparison Matrix
Figure 21 Global Visualization and 3D Rendering Software Market Value Share Analysis, by End-use Segment, 2019 and 2027
Figure 22 Visualization and 3D Rendering Software Market Attractiveness Analysis by End-use Vertical
Figure 23 Global Visualization and 3D Rendering Software Market Revenue, by Region– North America, 2018 – 2027, (US$ Mn)
Figure 24 Global Visualization and 3D Rendering Software Market Revenue, by Region– Europe, 2018 – 2027, (US$ Mn)
Figure 25 Global Visualization and 3D Rendering Software Market Revenue, by Region– APAC, 2018 – 2027, (US$ Mn)
Figure 26 Global Visualization and 3D Rendering Software Market Revenue, by Region– Middle East and Africa, 2018 – 2027, (US$ Mn)
Figure 27 Global Visualization and 3D Rendering Software Market Revenue, by Region– South America, 2018 – 2027, (US$ Mn)
Figure 28 Global Visualization and 3D Rendering Software Market Value Share Analysis, by Region, 2019 and 2027
Figure 29 Global Visualization and 3D Rendering Software Market Attractiveness Analysis, by Region
Figure 30 North America Visualization and 3D Rendering Software Market Revenue (US$ Mn) Forecast, 2018 – 2027
Figure 31 North America Visualization and 3D Rendering Software Market Y-o-Y Growth (%), 2018 - 2027
Figure 32 North America Visualization and 3D Rendering Software Market Attractiveness Analysis by Deployment Type (2019)
Figure 33 North America Visualization and 3D Rendering Software Market Attractiveness Analysis by End-use Vertical (2019)
Figure 34 North America Visualization and 3D Rendering Software Market Attractiveness Analysis by Country (2019)
Figure 35 Europe Visualization and 3D Rendering Software Market Revenue (US$ Mn) Forecast, 2018 – 2027
Figure 36 Europe Visualization and 3D Rendering Software Market Y-o-Y Growth (%), 2018 - 2027
Figure 37 Europe Visualization and 3D Rendering Software Market Attractiveness Analysis by Deployment Type (2019)
Figure 38 Europe Visualization and 3D Rendering Software Market Attractiveness Analysis by End-use Vertical (2019)
Figure 39 Europe Visualization and 3D Rendering Software Market Attractiveness Analysis by Country (2019)
Figure 40 APAC Visualization and 3D Rendering Software Market Revenue (US$ Mn) Forecast, 2018 – 2027
Figure 41 APAC Visualization and 3D Rendering Software Market Y-o-Y Growth (%), 2018 – 2027
Figure 42 APAC Visualization and 3D Rendering Software Market Attractiveness Analysis by Deployment Type (2019)
Figure 43 APAC Visualization and 3D Rendering Software Market Attractiveness Analysis by End-use Vertical (2019)
Figure 44 APAC Visualization and 3D Rendering Software Market Attractiveness Analysis by Country (2019)
Figure 45 Middle East & Africa (MEA) Visualization and 3D Rendering Software Market Revenue (US$ Mn) Forecast, 2018 – 2027
Figure 46 Middle East & Africa (MEA) Visualization and 3D Rendering Software Market Y-o-Y Growth (%), 2018 - 2027
Figure 47 Middle East & Africa (MEA) Visualization and 3D Rendering Software Market Attractiveness Analysis by Deployment Type (2019)
Figure 48 Middle East & Africa (MEA) Visualization and 3D Rendering Software Market Attractiveness Analysis by End-use Vertical (2019)
Figure 49 Middle East & Africa (MEA) Visualization and 3D Rendering Software Market Attractiveness Analysis by Country (2019)
Figure 50 South America Visualization and 3D Rendering Software Market Revenue (US$ Mn) Forecast, 2018 – 2027
Figure 51 South America Visualization and 3D Rendering Software Market Y-o-Y Growth (%), 2018 – 2027
Figure 52 South America Visualization and 3D Rendering Software Market Attractiveness Analysis by Deployment Type (2019)
Figure 53 South America Visualization and 3D Rendering Software Market Attractiveness Analysis by End-use Vertical (2019)
Figure 54 South America Visualization and 3D Rendering Software Market Attractiveness Analysis by Country (2019)
Figure 55 Global Visualization and 3D Rendering Software Market Share Analysis by Company (2019)
Figure 56 Autodesk Inc. Breakdown of Revenue, by Region (2018)
Figure 57 Autodesk Inc. Revenue (US$ Mn) & Y-o-Y Growth (%), 2016–2018
Figure 58 Dassault Systems Breakdown of Revenue, by Region (2018)
Figure 59 Dassault Systems Revenue (US$ Mn) & Y-o-Y Growth (%), 2016–2018
Figure 60 NVIDIA Corporation Breakdown of Revenue, by Region (2018)
Figure 61 NVIDIA Corporation Revenue (US$ Mn) & Y-o-Y Growth (%), 2016–2018
Copyright © Transparency Market Research, Inc. All Rights reserved
Trust Online

Visualization and 3D Rendering Software Market