
Reports
Reports
Virtual evolved packet core Market: Snapshot
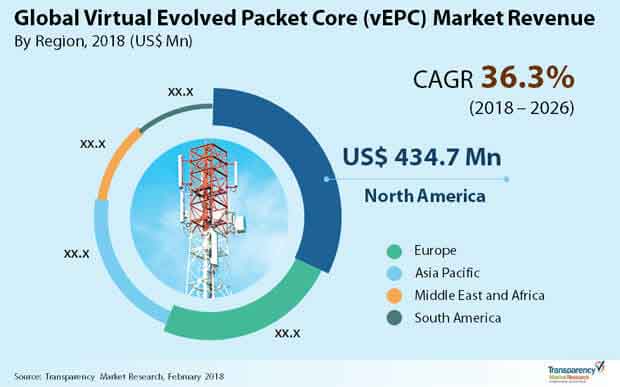
The global virtual evolved packet core market is projected to grow at 36.3% CAGR during the forecast period 2018-2026. According to the report, the global market will continue to be influenced by a range of macroeconomic and industry-specific factors.
Growing need for flexible and elastic networks, increasing smart phone penetration, rising number of LTE subscribers has increased the penetration and growth of virtual evolved packet core market globally. Increasing need for savings in capital expenditure (CapEx) and operational expenditure (OpEx), the adoption of virtual evolved packet core solution by enterprises is increasing. Growing consumer demand for high speed data networks for reliable connectivity and mobility has increased the demand for virtual evolved packet core solutions. The numerous advancements in networking industry such as 5G, LTE and VoLTE are expected to boost the demand for virtual evolved packet core solutions.
Cloud segment to Remain Most Lucrative
Cloud segment continues to be the leading segment globally during the forecast period due to rising need to reduce the overall equipment costs. Furthermore, large number of enterprises are rapidly moving their data into cloud which has increased the growth of cloud segment across different regions of the world. Telecom operators are rapidly adopting virtual evolved packet core solutions in order to deliver faster customer service and improve collaboration with third-party software application vendors.
Solutions segment is expected to consistently dominate during the forecast period due to the increasing implementation of virtual evolved packet core solutions in order to cater the growing demand for high speed data networks. Services segment is projected to grow at highest CAGR of 36.4% over the forecast period from 2018 to 2026 as telecom operators are upgrading their existing virtual evolved packet core solutions to meet the changing demand of the end-customers. IoT and M2M segment is expected to grow at highest CAGR over the forecast period. Mobile operators are rapidly deploying vEPC in the IoT packet core network that enables operator to bring superior connectivity for M2M devices and explore new services for customers.
Europe and North America to Continue to Hold Significant Share in Overall Market
North America accumulated highest revenue share in 2017 due to early adoption of 4G technology. With the rise in the usage of virtual evolved packet core, vEPC solutions and services providers in North America are collaborating with each other and focusing on offering various advanced technology solutions to the consumers. In July 2017, Mavenir Systems, Inc., a prominent provider of network transformation for Communication Service Providers (CSPs), acquired assets related with vEPC from Brocade Communications Systems, Inc., which is a storage area networking (SAN) and Internet protocol (IP) network solution provider. Furthermore, presence of telecom giants and various technological advancements are helping the North America market to generate significant revenues. The U.S. held highest market share in 2017 for North America and is estimated to grow at highest CAGR during the forecast period. In 2018, the U.S. government has planned to implement Citizens broadband radio service (CBRS) band for private operators and enterprises. Citizens broadband radio service enables enterprises to build their own private LTE networks. North America region is expected to grow at significant CAGR of 36.4% during the forecast period. In Europe, multiple players are establishing partnerships to deploy vEPC on large scale in order to deliver the service throughout the region. Europe region is likely to witness significant CAGR growth over the forecast period. The U.K. contributed highest share to entire Europe virtual evolved packet core market in 2017. In U.K., 4G LTE networks are being deployed across wide range of industries from agriculture and utilities to energy and healthcare.
The demand for virtual evolved packet core solutions in APAC is likely to remain concentrated in China and India, owing to a larger consumer base in the region. India is estimated to grow at substantial CAGR among the countries in Asia Pacific region during the forecast period owing to the increasing dependency on the internet and growing number of LTE subscribers. Majority of telecom operators and enterprises in the APAC region are still using traditional EPC solution, which is expected to shift towards vEPC solutions. In Middle East and Africa (MEA), market players are increasing their investments to expand their physical presence. GCC is expected to grow at significant CAGR during the forecast period owing to the growing adoption of IoT technology and M2M devices. Increasing IT spending and network infrastructure development in South America, especially in Brazil are driving the regional virtual evolved packet core market. Brazil is expected to hold the largest portion of revenue for the market in the region throughout the forecast period.
The company profiling of key players profiled in the global virtual evolved packet core market includes company overview, major business strategies adopted, SWOT analysis and market revenues for year 2015 to 2017. The key players profiled in the global virtual evolved packet core market include Ericsson AB, Nokia Corporation, ZTE Corporation, Huawei Technologies Co., Ltd., Cisco Systems, Inc., Intel Corporation, NEC Corporation, Mavenir, Affirmed Networks and ng4T GmbH. Various players are establishing partnerships to deploy vEPC on large scale across the world in order to assist the telecom operators to cope with the traffic growth in an economical way.
1. Preface
1.1. Market Definition and Scope
1.2. Market Segmentation
1.3. Key Research Objectives
1.4. Research Highlights
2. Assumptions and Research Methodology
3. Executive Summary : Global Virtual Evolved Packet Core (vEPC) Market
4. Market Overview
4.1. Introduction
4.2. Market Dynamics
4.2.1. Drivers
4.2.2. Restraints
4.2.3. Opportunities
4.3. Market Indicators
4.4. Global Virtual Evolved Packet Core (vEPC) Market Analysis and Forecasts, 2016 – 2026
4.4.1. Market Revenue Projections (US$ Mn)
4.5. Porter’s Five Force Model
4.6. Ecosystem Analysis
4.7. Market Outlook
5. Global Virtual Evolved Packet Core (vEPC) Market Analysis and Forecasts, By Component
5.1. Overview & Definitions
5.2. Market Size (US$ Mn) Forecast By Component, 2016 – 2026
5.2.1. Solution
5.2.2. Services
5.2.2.1. Maintenance
5.2.2.2. Installation
5.2.2.3. Consulting
5.2.2.4. Others
5.3. Market Attractiveness By Component
6. Global Virtual Evolved Packet Core (vEPC) Market Analysis and Forecasts, By Deployment
6.1. Overview & Definitions
6.2. Market Size (US$ Mn) Forecast By Deployment, 2016 – 2026
6.2.1. Cloud
6.2.2. On Premise
6.3. Market Attractiveness By Deployment
7. Global Virtual Evolved Packet Core (vEPC) Market Analysis and Forecasts, By End User
7.1. Overview & Definitions
7.2. Market Size (US$ Mn) Forecast By End User, 2016 – 2026
7.2.1. Telecom Operators
7.2.2. Enterprises
7.3. Market Attractiveness By End User
8. Global Virtual Evolved Packet Core (vEPC) Market Analysis and Forecasts, Application
8.1. Overview & Definitions
8.2. Market Size (US$ Mn) Forecast By Application, 2016 – 2026
8.2.1. LTE
8.2.2. IoT & M2M
8.2.3. Volte & VoWiFi
8.2.4. BWA
8.2.5. MPN & MVNO
8.3. Market Attractiveness By End User
9. Global Virtual Evolved Packet Core (vEPC) Market Analysis and Forecasts, By Region
9.1. Key Findings
9.2. Market Size (US$ Mn) Forecast By Region, 2016 – 2026
9.2.1. North America
9.2.2. Europe
9.2.3. Asia Pacific
9.2.4. Middle East and Africa
9.2.5. South America
9.3. Market Attractiveness By Country/Region
10. North America Virtual Evolved Packet Core (vEPC) Market Analysis and Forecast
10.1. Key Trends
10.2. Market Size (US$ Mn) Forecast By Component, 2016 – 2026
10.2.1. Solution
10.2.2. Services
10.2.2.1. Maintenance
10.2.2.2. Installation
10.2.2.3. Consulting
10.2.2.4. Others
10.3. Market Size (US$ Mn) Forecast By Deployment, 2016 – 2026
10.3.1. Cloud
10.3.2. On-Premise
10.4. Market Size (US$ Mn) Forecast By End User, 2016 – 2026
10.4.1. Telecom Operator
10.4.2. Enterprises
10.5. Market Size (US$ Mn) Forecast By Application, 2016 – 2026
10.5.1. LTE
10.5.2. IoT & M2M
10.5.3. Volte & VoWiFi
10.5.4. BWA
10.5.5. MPN & MVNO
10.6. Market Size (US$ Mn) Forecast By Country, 2016 – 2026
10.6.1. The U.S.
10.6.2. Canada
10.6.3. Rest of North America
10.7. The U.S. Virtual Evolved Packet Core (vEPC) Market Analysis and Forecast
10.7.1. Market Size (US$ Mn) Forecast By Component, 2016 – 2026
10.7.1.1. Solution
10.7.1.2. Services
10.7.1.2.1. Maintenance
10.7.1.2.2. Installation
10.7.1.2.3. Consulting
10.7.1.2.4. Others
10.7.2. Market Size (US$ Mn) Forecast By Deployment, 2016 – 2026
10.7.2.1. Cloud
10.7.2.2. On-Premise
10.7.3. Market Size (US$ Mn) Forecast By End User, 2016 – 2026
10.7.3.1. Telecom Operator
10.7.3.2. Enterprises
10.7.4. Market Size (US$ Mn) Forecast By Application, 2016 – 2026
10.7.4.1. LTE
10.7.4.2. IoT & M2M
10.7.4.3. Volte & VoWiFi
10.7.4.4. BWA
10.7.4.5. MPN & MVNO
10.8. Canada Virtual Evolved Packet Core (vEPC) Market Analysis and Forecast
10.8.1. Market Size (US$ Mn) Forecast By Component, 2016 – 2026
10.8.1.1. Solution
10.8.1.2. Services
10.8.1.2.1. Maintenance
10.8.1.2.2. Installation
10.8.1.2.3. Consulting
10.8.1.2.4. Others
10.8.2. Market Size (US$ Mn) Forecast By Deployment, 2016 – 2026
10.8.2.1. Cloud
10.8.2.2. On-Premise
10.8.3. Market Size (US$ Mn) Forecast By End User, 2016 – 2026
10.8.3.1. Telecom Operator
10.8.3.2. Enterprises
10.8.4. Market Size (US$ Mn) Forecast By Application, 2016 – 2026
10.8.4.1. LTE
10.8.4.2. IoT & M2M
10.8.4.3. Volte & VoWiFi
10.8.4.4. BWA
10.8.4.5. MPN & MVNO
10.9. Rest of North America Virtual Evolved Packet Core (vEPC) Market Analysis and Forecast
10.9.1. Market Size (US$ Mn) Forecast By Component, 2016 – 2026
10.9.1.1. Solution
10.9.1.2. Services
10.9.1.2.1. Maintenance
10.9.1.2.2. Installation
10.9.1.2.3. Consulting
10.9.1.2.4. Others
10.9.2. Market Size (US$ Mn) Forecast By Deployment, 2016 – 2026
10.9.2.1. Cloud
10.9.2.2. On-Premise
10.9.3. Market Size (US$ Mn) Forecast By End User, 2016 – 2026
10.9.3.1. Telecom Operator
10.9.3.2. Enterprises
10.9.4. Market Size (US$ Mn) Forecast By Application, 2016 – 2026
10.9.4.1. LTE
10.9.4.2. IoT & M2M
10.9.4.3. Volte & VoWiFi
10.9.4.4. BWA
10.9.4.5. MPN & MVNO
10.10. North America Market Attractiveness Analysis
10.10.1. By Component
10.10.2. By Deployment
10.10.3. By End User
10.10.4. By Application
10.10.5. By Country
11. Europe Virtual Evolved Packet Core (vEPC) Market Analysis and Forecast
11.1. Key Trends
11.2. Market Size (US$ Mn) Forecast By Component, 2016 – 2026
11.2.1. Solution
11.2.2. Services
11.2.2.1. Maintenance
11.2.2.2. Installation
11.2.2.3. Consulting
11.2.2.4. Others
11.3. Market Size (US$ Mn) Forecast By Deployment, 2016 – 2026
11.3.1. Cloud
11.3.2. On-Premise
11.4. Market Size (US$ Mn) Forecast By End User, 2016 – 2026
11.4.1. Telecom Operator
11.4.2. Enterprises
11.5. Market Size (US$ Mn) Forecast By Application, 2016 – 2026
11.5.1. LTE
11.5.2. IoT & M2M
11.5.3. Volte & VoWiFi
11.5.4. BWA
11.5.5. MPN & MVNO
11.6. Market Size (US$ Mn) Forecast By Country, 2016 – 2026
11.6.1. The U.K.
11.6.2. Germany
11.6.3. France
11.6.4. Rest of Europe
11.7. The U.K. Virtual Evolved Packet Core (vEPC) Market Analysis and Forecast
11.7.1. Market Size (US$ Mn) Forecast By Component, 2016 – 2026
11.7.1.1. Solution
11.7.1.2. Services
11.7.1.2.1. Maintenance
11.7.1.2.2. Installation
11.7.1.2.3. Consulting
11.7.1.2.4. Others
11.7.2. Market Size (US$ Mn) Forecast By Deployment, 2016 – 2026
11.7.2.1. Cloud
11.7.2.2. On-Premise
11.7.3. Market Size (US$ Mn) Forecast By End User, 2016 – 2026
11.7.3.1. Telecom Operator
11.7.3.2. Enterprises
11.7.4. Market Size (US$ Mn) Forecast By Application, 2016 – 2026
11.7.4.1. LTE
11.7.4.2. IoT & M2M
11.7.4.3. Volte & VoWiFi
11.7.4.4. BWA
11.7.4.5. MPN & MVNO
11.8. Germany Virtual Evolved Packet Core (vEPC) Market Analysis and Forecast
11.8.1. Market Size (US$ Mn) Forecast By Component, 2016 – 2026
11.8.1.1. Solution
11.8.1.2. Services
11.8.1.2.1. Maintenance
11.8.1.2.2. Installation
11.8.1.2.3. Consulting
11.8.1.2.4. Others
11.8.2. Market Size (US$ Mn) Forecast By Deployment, 2016 – 2026
11.8.2.1. Cloud
11.8.2.2. On-Premise
11.8.3. Market Size (US$ Mn) Forecast By End User, 2016 – 2026
11.8.3.1. Telecom Operator
11.8.3.2. Enterprises
11.8.4. Market Size (US$ Mn) Forecast By Application, 2016 – 2026
11.8.4.1. LTE
11.8.4.2. IoT & M2M
11.8.4.3. Volte & VoWiFi
11.8.4.4. BWA
11.8.4.5. MPN & MVNO
11.9. France Virtual Evolved Packet Core (vEPC) Market Analysis and Forecast
11.9.1. Market Size (US$ Mn) Forecast By Component, 2016 – 2026
11.9.1.1. Solution
11.9.1.2. Services
11.9.1.2.1. Maintenance
11.9.1.2.2. Installation
11.9.1.2.3. Consulting
11.9.1.2.4. Others
11.9.2. Market Size (US$ Mn) Forecast By Deployment, 2016 – 2026
11.9.2.1. Cloud
11.9.2.2. On-Premise
11.9.3. Market Size (US$ Mn) Forecast By End User, 2016 – 2026
11.9.3.1. Telecom Operator
11.9.3.2. Enterprises
11.9.4. Market Size (US$ Mn) Forecast By Application, 2016 – 2026
11.9.4.1. LTE
11.9.4.2. IoT & M2M
11.9.4.3. Volte & VoWiFi
11.9.4.4. BWA
11.9.4.5. MPN & MVNO
11.10. Rest of Europe Virtual Evolved Packet Core (vEPC) Market Analysis and Forecast
11.10.1. Market Size (US$ Mn) Forecast By Component, 2016 – 2026
11.10.1.1. Solution
11.10.1.2. Services
11.10.1.2.1. Maintenance
11.10.1.2.2. Installation
11.10.1.2.3. Consulting
11.10.1.2.4. Others
11.10.2. Market Size (US$ Mn) Forecast By Deployment, 2016 – 2026
11.10.2.1. Cloud
11.10.2.2. On-Premise
11.10.3. Market Size (US$ Mn) Forecast By End User, 2016 – 2026
11.10.3.1. Telecom Operator
11.10.3.2. Enterprises
11.10.4. Market Size (US$ Mn) Forecast By Application, 2016 – 2026
11.10.4.1. LTE
11.10.4.2. IoT & M2M
11.10.4.3. Volte & VoWiFi
11.10.4.4. BWA
11.10.4.5. MPN & MVNO
11.11. Europe Market Attractiveness Analysis
11.11.1. By Component
11.11.2. By Deployment
11.11.3. By End User
11.11.4. By Application
11.11.5. By Country
12. Asia Pacific Virtual Evolved Packet Core (vEPC) Market Analysis and Forecast
12.1. Key Trends
12.2. Market Size (US$ Mn) Forecast By Component, 2016 – 2026
12.2.1. Solution
12.2.2. Services
12.2.2.1. Maintenance
12.2.2.2. Installation
12.2.2.3. Consulting
12.2.2.4. Others
12.3. Market Size (US$ Mn) Forecast By Deployment, 2016 – 2026
12.3.1. Cloud
12.3.2. On-Premise
12.4. Market Size (US$ Mn) Forecast By End User, 2016 – 2026
12.4.1. Telecom Operator
12.4.2. Enterprises
12.5. Market Size (US$ Mn) Forecast By Application, 2016 – 2026
12.5.1. LTE
12.5.2. IoT & M2M
12.5.3. Volte & VoWiFi
12.5.4. BWA
12.5.5. MPN & MVNO
12.6. Market Size (US$ Mn) Forecast By Country, 2016 – 2026
12.6.1. China
12.6.2. India
12.6.3. Japan
12.6.4. Rest of Asia Pacific
12.7. China Virtual Evolved Packet Core (vEPC) Market Analysis and Forecast
12.7.1. Market Size (US$ Mn) Forecast By Component, 2016 – 2026
12.7.1.1. Solution
12.7.1.2. Services
12.7.1.2.1. Maintenance
12.7.1.2.2. Installation
12.7.1.2.3. Consulting
12.7.1.2.4. Others
12.7.2. Market Size (US$ Mn) Forecast By Deployment, 2016 – 2026
12.7.2.1. Cloud
12.7.2.2. On-Premise
12.7.3. Market Size (US$ Mn) Forecast By End User, 2016 – 2026
12.7.3.1. Telecom Operator
12.7.3.2. Enterprises
12.7.4. Market Size (US$ Mn) Forecast By Application, 2016 – 2026
12.7.4.1. LTE
12.7.4.2. IoT & M2M
12.7.4.3. Volte & VoWiFi
12.7.4.4. BWA
12.7.4.5. MPN & MVNO
12.8. India Virtual Evolved Packet Core (vEPC) Market Analysis and Forecast
12.8.1. Market Size (US$ Mn) Forecast By Component, 2016 – 2026
12.8.1.1. Solution
12.8.1.2. Services
12.8.1.2.1. Maintenance
12.8.1.2.2. Installation
12.8.1.2.3. Consulting
12.8.1.2.4. Others
12.8.2. Market Size (US$ Mn) Forecast By Deployment, 2016 – 2026
12.8.2.1. Cloud
12.8.2.2. On-Premise
12.8.3. Market Size (US$ Mn) Forecast By End User, 2016 – 2026
12.8.3.1. Telecom Operator
12.8.3.2. Enterprises
12.8.4. Market Size (US$ Mn) Forecast By Application, 2016 – 2026
12.8.4.1. LTE
12.8.4.2. IoT & M2M
12.8.4.3. Volte & VoWiFi
12.8.4.4. BWA
12.8.4.5. MPN & MVNO
12.9. Japan Virtual Evolved Packet Core (vEPC) Market Analysis and Forecast
12.9.1. Market Size (US$ Mn) Forecast By Component, 2016 – 2026
12.9.1.1. Solution
12.9.1.2. Services
12.9.1.2.1. Maintenance
12.9.1.2.2. Installation
12.9.1.2.3. Consulting
12.9.1.2.4. Others
12.9.2. Market Size (US$ Mn) Forecast By Deployment, 2016 – 2026
12.9.2.1. Cloud
12.9.2.2. On-Premise
12.9.3. Market Size (US$ Mn) Forecast By End User, 2016 – 2026
12.9.3.1. Telecom Operator
12.9.3.2. Enterprises
12.9.4. Market Size (US$ Mn) Forecast By Application, 2016 – 2026
12.9.4.1. LTE
12.9.4.2. IoT & M2M
12.9.4.3. Volte & VoWiFi
12.9.4.4. BWA
12.9.4.5. MPN & MVNO
12.10. Rest of Asia Pacific Virtual Evolved Packet Core (vEPC) Market Analysis and Forecast
12.10.1. Market Size (US$ Mn) Forecast By Component, 2016 – 2026
12.10.1.1. Solution
12.10.1.2. Services
12.10.1.2.1. Maintenance
12.10.1.2.2. Installation
12.10.1.2.3. Consulting
12.10.1.2.4. Others
12.10.2. Market Size (US$ Mn) Forecast By Deployment, 2016 – 2026
12.10.2.1. Cloud
12.10.2.2. On-Premise
12.10.3. Market Size (US$ Mn) Forecast By End User, 2016 – 2026
12.10.3.1. Telecom Operator
12.10.3.2. Enterprises
12.10.4. Market Size (US$ Mn) Forecast By Application, 2016 – 2026
12.10.4.1. LTE
12.10.4.2. IoT & M2M
12.10.4.3. Volte & VoWiFi
12.10.4.4. BWA
12.10.4.5. MPN & MVNO
12.11. Asia Pacific Market Attractiveness Analysis
12.11.1. By Component
12.11.2. By Deployment
12.11.3. By End User
12.11.4. By Application
12.11.5. By Country
13. Middle East and Africa Virtual Evolved Packet Core (vEPC) Market Analysis and Forecast
13.1. Key Trends
13.2. Market Size (US$ Mn) Forecast By Component, 2016 – 2026
13.2.1. Solution
13.2.2. Services
13.2.2.1. Maintenance
13.2.2.2. Installation
13.2.2.3. Consulting
13.2.2.4. Others
13.3. Market Size (US$ Mn) Forecast By Deployment, 2016 – 2026
13.3.1. Cloud
13.3.2. On-Premise
13.4. Market Size (US$ Mn) Forecast By End User, 2016 – 2026
13.4.1. Telecom Operator
13.4.2. Enterprises
13.5. Market Size (US$ Mn) Forecast By Application, 2016 – 2026
13.5.1. LTE
13.5.2. IoT & M2M
13.5.3. Volte & VoWiFi
13.5.4. BWA
13.5.5. MPN & MVNO
13.6. Market Size (US$ Mn) Forecast By Country, 2016 – 2026
13.6.1. GCC
13.6.2. South Africa
13.6.3. Rest of Middle East and Africa
13.7. GCC Virtual Evolved Packet Core (vEPC) Market Analysis and Forecast
13.7.1. Market Size (US$ Mn) Forecast By Component, 2016 – 2026
13.7.1.1. Solution
13.7.1.2. Services
13.7.1.2.1. Maintenance
13.7.1.2.2. Installation
13.7.1.2.3. Consulting
13.7.1.2.4. Others
13.7.2. Market Size (US$ Mn) Forecast By Deployment, 2016 – 2026
13.7.2.1. Cloud
13.7.2.2. On-Premise
13.7.3. Market Size (US$ Mn) Forecast By End User, 2016 – 2026
13.7.3.1. Telecom Operator
13.7.3.2. Enterprises
13.7.4. Market Size (US$ Mn) Forecast By Application, 2016 – 2026
13.7.4.1. LTE
13.7.4.2. IoT & M2M
13.7.4.3. Volte & VoWiFi
13.7.4.4. BWA
13.7.4.5. MPN & MVNO
13.8. South Africa Virtual Evolved Packet Core (vEPC) Market Analysis and Forecast
13.8.1. Market Size (US$ Mn) Forecast By Component, 2016 – 2026
13.8.1.1. Solution
13.8.1.2. Services
13.8.1.2.1. Maintenance
13.8.1.2.2. Installation
13.8.1.2.3. Consulting
13.8.1.2.4. Others
13.8.2. Market Size (US$ Mn) Forecast By Deployment, 2016 – 2026
13.8.2.1. Cloud
13.8.2.2. On-Premise
13.8.3. Market Size (US$ Mn) Forecast By End User, 2016 – 2026
13.8.3.1. Telecom Operator
13.8.3.2. Enterprises
13.8.4. Market Size (US$ Mn) Forecast By Application, 2016 – 2026
13.8.4.1. LTE
13.8.4.2. IoT & M2M
13.8.4.3. Volte & VoWiFi
13.8.4.4. BWA
13.8.4.5. MPN & MVNO
13.9. Rest of Middle East and Africa Virtual Evolved Packet Core (vEPC) Market Analysis and Forecast
13.9.1. Market Size (US$ Mn) Forecast By Component, 2016 – 2026
13.9.1.1. Solution
13.9.1.2. Services
13.9.1.2.1. Maintenance
13.9.1.2.2. Installation
13.9.1.2.3. Consulting
13.9.1.2.4. Others
13.9.2. Market Size (US$ Mn) Forecast By Deployment, 2016 – 2026
13.9.2.1. Cloud
13.9.2.2. On-Premise
13.9.3. Market Size (US$ Mn) Forecast By End User, 2016 – 2026
13.9.3.1. Telecom Operator
13.9.3.2. Enterprises
13.9.4. Market Size (US$ Mn) Forecast By Application, 2016 – 2026
13.9.4.1. LTE
13.9.4.2. IoT & M2M
13.9.4.3. Volte & VoWiFi
13.9.4.4. BWA
13.9.4.5. MPN & MVNO
13.10. Middle East and Africa Market Attractiveness Analysis
13.10.1. By Component
13.10.2. By Deployment
13.10.3. By End User
13.10.4. By Application
13.10.5. By Country
14. South America Virtual Evolved Packet Core (vEPC) Market Analysis and Forecast
14.1. Key Trends
14.2. Market Size (US$ Mn) Forecast By Component, 2016 – 2026
14.2.1. Solution
14.2.2. Services
14.2.2.1. Maintenance
14.2.2.2. Installation
14.2.2.3. Consulting
14.2.2.4. Others
14.3. Market Size (US$ Mn) Forecast By Deployment, 2016 – 2026
14.3.1. Cloud
14.3.2. On-Premise
14.4. Market Size (US$ Mn) Forecast By End User, 2016 – 2026
14.4.1. Telecom Operator
14.4.2. Enterprises
14.5. Market Size (US$ Mn) Forecast By Application, 2016 – 2026
14.5.1. LTE
14.5.2. IoT & M2M
14.5.3. Volte & VoWiFi
14.5.4. BWA
14.5.5. MPN & MVNO
14.6. Market Size (US$ Mn) Forecast By Country, 2016 – 2026
14.6.1. Brazil
14.6.2. Rest of South Africa
14.7. Brazil Virtual Evolved Packet Core (vEPC) Market Analysis and Forecast
14.7.1. Market Size (US$ Mn) Forecast By Component, 2016 – 2026
14.7.1.1. Solution
14.7.1.2. Services
14.7.1.2.1. Maintenance
14.7.1.2.2. Installation
14.7.1.2.3. Consulting
14.7.1.2.4. Others
14.7.2. Market Size (US$ Mn) Forecast By Deployment, 2016 – 2026
14.7.2.1. Cloud
14.7.2.2. On-Premise
14.7.3. Market Size (US$ Mn) Forecast By End User, 2016 – 2026
14.7.3.1. Telecom Operator
14.7.3.2. Enterprises
14.7.4. Market Size (US$ Mn) Forecast By Application, 2016 – 2026
14.7.4.1. LTE
14.7.4.2. IoT & M2M
14.7.4.3. Volte & VoWiFi
14.7.4.4. BWA
14.7.4.5. MPN & MVNO
14.8. Rest of South America Virtual Evolved Packet Core (vEPC) Market Analysis and Forecast
14.8.1. Market Size (US$ Mn) Forecast By Component, 2016 – 2026
14.8.1.1. Solution
14.8.1.2. Services
14.8.1.2.1. Maintenance
14.8.1.2.2. Installation
14.8.1.2.3. Consulting
14.8.1.2.4. Others
14.8.2. Market Size (US$ Mn) Forecast By Deployment, 2016 – 2026
14.8.2.1. Cloud
14.8.2.2. On-Premise
14.8.3. Market Size (US$ Mn) Forecast By End User, 2016 – 2026
14.8.3.1. Telecom Operator
14.8.3.2. Enterprises
14.8.4. Market Size (US$ Mn) Forecast By Application, 2016 – 2026
14.8.4.1. LTE
14.8.4.2. IoT & M2M
14.8.4.3. Volte & VoWiFi
14.8.4.4. BWA
14.8.4.5. MPN & MVNO
14.9. South America Market Attractiveness Analysis
14.9.1. By Component
14.9.2. By Deployment
14.9.3. By End User
14.9.4. By Application
14.9.5. By Country
15. Competition Landscape
15.1. Market Player – Competition Matrix
15.2. Market Share Analysis By Company (2017)
15.3. Company Profiles (Details – Overview, Financials, Recent Developments, SWOT, Strategy)
15.3.1. Ericsson AB
15.3.1.1. Company Details (HQ, Foundation Year, Employee Strength)
15.3.1.2. Market Presence By Segment
15.3.1.3. Strategy
15.3.1.4. Revenue and Operating Profits
15.3.1.5. SWOT Analysis
15.3.2. Nokia Corporation
15.3.2.1. Company Details (HQ, Foundation Year, Employee Strength)
15.3.2.2. Market Presence By Segment
15.3.2.3. Strategy
15.3.2.4. Revenue and Operating Profits
15.3.2.5. SWOT Analysis
15.3.3. ZTE Corporation
15.3.3.1. Company Details (HQ, Foundation Year, Employee Strength)
15.3.3.2. Market Presence By Segment
15.3.3.3. Strategy
15.3.3.4. Revenue and Operating Profits
15.3.3.5. SWOT Analysis
15.3.4. Huawei Technologies Co., Ltd.
15.3.4.1. Company Details (HQ, Foundation Year, Employee Strength)
15.3.4.2. Market Presence By Segment
15.3.4.3. Strategy
15.3.4.4. Revenue and Operating Profits
15.3.4.5. SWOT Analysis
15.3.5. Cisco Systems Inc.
15.3.5.1. Company Details (HQ, Foundation Year, Employee Strength)
15.3.5.2. Market Presence By Segment
15.3.5.3. Strategy
15.3.5.4. Revenue and Operating Profits
15.3.5.5. SWOT Analysis
15.3.6. Intel Corporation
15.3.6.1. Company Details (HQ, Foundation Year, Employee Strength)
15.3.6.2. Market Presence By Segment
15.3.6.3. Strategy
15.3.6.4. Revenue and Operating Profits
15.3.6.5. SWOT Analysis
15.3.7. NEC Corporation
15.3.7.1. Company Details (HQ, Foundation Year, Employee Strength)
15.3.7.2. Market Presence By Segment
15.3.7.3. Strategy
15.3.7.4. Revenue and Operating Profits
15.3.7.5. SWOT Analysis
15.3.8. Mavenir
15.3.8.1. Company Details (HQ, Foundation Year, Employee Strength)
15.3.8.2. Market Presence By Segment
15.3.8.3. Strategy
15.3.8.4. Revenue and Operating Profits
15.3.8.5. SWOT Analysis
15.3.9. Affirmed Networks
15.3.9.1. Company Details (HQ, Foundation Year, Employee Strength)
15.3.9.2. Market Presence By Segment
15.3.9.3. Strategy
15.3.9.4. Revenue and Operating Profits
15.3.9.5. SWOT Analysis
15.3.10. ng4T GmbH
15.3.10.1. Company Details (HQ, Foundation Year, Employee Strength)
15.3.10.2. Market Presence By Segment
15.3.10.3. Strategy
15.3.10.4. Revenue and Operating Profits
15.3.10.5. SWOT Analysis
16. Key Takeaways
List of Tables
Table 01: Global Virtual Evolved Packet Core (vEPC) Market Size (US$ Mn) Forecast, By Component, 2016–2026
Table 02: Global Virtual Evolved Packet Core (vEPC) Market Size (US$ Mn) Forecast, By Services, 2016–2026
Table 03: Global Virtual Evolved Packet Core (vEPC) Market Size (US$ Mn) Forecast, By Deployment, 2016–2026
Table 04: Global Virtual Evolved Packet Core (vEPC) Market Size (US$ Mn) Forecast, By End User, 2016–2026
Table 05: Global Virtual Evolved Packet Core (vEPC) Market Size (US$ Mn) Forecast, By Application, 2016–2026
Table 06: Global Virtual Evolved Packet Core (vEPC) Market Size (US$ Mn) Forecast, By Region, 2016–2026
Table 07: North America Virtual Evolved Packet Core (vEPC) Market Size (US$ Mn) Forecast, By Component, 2016–2026
Table 08: North America Virtual Evolved Packet Core (vEPC) Market Size (US$ Mn) Forecast, By Services, 2016–2026
Table 09: North America Virtual Evolved Packet Core (vEPC) Market Size (US$ Mn) Forecast, By Deployment, 2016–2026
Table 10: North America Virtual Evolved Packet Core (vEPC) Market Size (US$ Mn) Forecast, By End User, 2016–2026
Table 11: North America Virtual Evolved Packet Core (vEPC) Market Size (US$ Mn) Forecast, By Application, 2016–2026
Table 12: North America Virtual Evolved Packet Core (vEPC) Market Size (US$ Mn) Forecast, By Country, 2016–2026
Table 13: The U.S. Virtual Evolved Packet Core (vEPC) Market Size (US$ Mn) Forecast, By Component, 2016–2026
Table 14: The U.S. Virtual Evolved Packet Core (vEPC) Market Size (US$ Mn) Forecast, By Services, 2016–2026
Table 15: The U.S. Virtual Evolved Packet Core (vEPC) Market Size (US$ Mn) Forecast, By Deployment, 2016–2026
Table 16: The U.S. Virtual Evolved Packet Core (vEPC) Market Size (US$ Mn) Forecast, By End User, 2016–2026
Table 17: The U.S. Virtual Evolved Packet Core (vEPC) Market Size (US$ Mn) Forecast, By Application, 2016–2026
Table 18: Canada Virtual Evolved Packet Core (vEPC) Market Size (US$ Mn) Forecast, By Component, 2016–2026
Table 19: Canada Virtual Evolved Packet Core (vEPC) Market Size (US$ Mn) Forecast, By Services, 2016–2026
Table 20: Canada Virtual Evolved Packet Core (vEPC) Market Size (US$ Mn) Forecast, By Deployment, 2016–2026
Table 21: Canada Virtual Evolved Packet Core (vEPC) Market Size (US$ Mn) Forecast, By End User, 2016–2026
Table 22: Canada Virtual Evolved Packet Core (vEPC) Market Size (US$ Mn) Forecast, By Application, 2016–2026
Table 23: Rest of North America Virtual Evolved Packet Core (vEPC) Market Size (US$ Mn) Forecast, By Component, 2016–2026
Table 24: Rest of North America Virtual Evolved Packet Core (vEPC) Market Size (US$ Mn) Forecast, By Services, 2016–2026
Table 25: Rest of North America Virtual Evolved Packet Core (vEPC) Market Size (US$ Mn) Forecast, By Deployment, 2016–2026
Table 26: Rest of North America Virtual Evolved Packet Core (vEPC) Market Size (US$ Mn) Forecast, By End User, 2016–2026
Table 27: Rest of North America Virtual Evolved Packet Core (vEPC) Market Size (US$ Mn) Forecast, By Application, 2016–2026
Table 28: Europe Virtual Evolved Packet Core (vEPC) Market Size (US$ Mn) Forecast, By Component, 2016–2026
Table 29: Europe Virtual Evolved Packet Core (vEPC) Market Size (US$ Mn) Forecast, By Services, 2016–2026
Table 30: Europe Virtual Evolved Packet Core (vEPC) Market Size (US$ Mn) Forecast, By Deployment, 2016–2026
Table 31: Europe Virtual Evolved Packet Core (vEPC) Market Size (US$ Mn) Forecast, By End User, 2016–2026
Table 32: Europe Virtual Evolved Packet Core (vEPC) Market Size (US$ Mn) Forecast, By Application, 2016–2026
Table 33: Europe Virtual Evolved Packet Core (vEPC) Market Size (US$ Mn) Forecast, By Country, 2016–2026
Table 34: The U.K. Virtual Evolved Packet Core (vEPC) Market Size (US$ Mn) Forecast, By Component, 2016–2026
Table 35: The U.K. Virtual Evolved Packet Core (vEPC) Market Size (US$ Mn) Forecast, By Services, 2016–2026
Table 36: The U.K. Virtual Evolved Packet Core (vEPC) Market Size (US$ Mn) Forecast, By Deployment, 2016–2026
Table 37: The U.K. Virtual Evolved Packet Core (vEPC) Market Size (US$ Mn) Forecast, By End User, 2016–2026
Table 38: The U.K. Virtual Evolved Packet Core (vEPC) Market Size (US$ Mn) Forecast, By Application, 2016–2026
Table 39: Germany Virtual Evolved Packet Core (vEPC) Market Size (US$ Mn) Forecast, By Component, 2016–2026
Table 40: Germany Virtual Evolved Packet Core (vEPC) Market Size (US$ Mn) Forecast, By Services, 2016–2026
Table 41: Germany Virtual Evolved Packet Core (vEPC) Market Size (US$ Mn) Forecast, By Deployment, 2016–2026
Table 42: Germany Virtual Evolved Packet Core (vEPC) Market Size (US$ Mn) Forecast, By End User, 2016–2026
Table 43: Germany Virtual Evolved Packet Core (vEPC) Market Size (US$ Mn) Forecast, By Application, 2016–2026
Table 44: France Virtual Evolved Packet Core (vEPC) Market Size (US$ Mn) Forecast, By Component, 2016–2026
Table 45: France Virtual Evolved Packet Core (vEPC) Market Size (US$ Mn) Forecast, By Services, 2016–2026
Table 46: France Virtual Evolved Packet Core (vEPC) Market Size (US$ Mn) Forecast, By Deployment, 2016–2026
Table 47: France Virtual Evolved Packet Core (vEPC) Market Size (US$ Mn) Forecast, By End User, 2016–2026
Table 48: France Virtual Evolved Packet Core (vEPC) Market Size (US$ Mn) Forecast, By Application, 2016–2026
Table 49: Rest of Europe Virtual Evolved Packet Core (vEPC) Market Size (US$ Mn) Forecast, By Component, 2016–2026
Table 50: Rest of Europe Virtual Evolved Packet Core (vEPC) Market Size (US$ Mn) Forecast, By Services, 2016–2026
Table 51: Rest of Europe Virtual Evolved Packet Core (vEPC) Market Size (US$ Mn) Forecast, By Deployment, 2016–2026
Table 52: Rest of Europe Virtual Evolved Packet Core (vEPC) Market Size (US$ Mn) Forecast, By End User, 2016–2026
Table 53: Rest of Europe Virtual Evolved Packet Core (vEPC) Market Size (US$ Mn) Forecast, By Application, 2016–2026
Table 54: Asia Pacific Virtual Evolved Packet Core (vEPC) Market Size (US$ Mn) Forecast, By Component, 2016–2026
Table 55: Asia Pacific Virtual Evolved Packet Core (vEPC) Market Size (US$ Mn) Forecast, By Services, 2016–2026
Table 56: Asia Pacific Virtual Evolved Packet Core (vEPC) Market Size (US$ Mn) Forecast, By Deployment, 2016–2026
Table 57: Asia Pacific Virtual Evolved Packet Core (vEPC) Market Size (US$ Mn) Forecast, By End User, 2016–2026
Table 58: Asia Pacific Virtual Evolved Packet Core (vEPC) Market Size (US$ Mn) Forecast, By Application, 2016–2026
Table 59: Asia Pacific Virtual Evolved Packet Core (vEPC) Market Size (US$ Mn) Forecast, By Country, 2016–2026
Table 60: China Virtual Evolved Packet Core (vEPC) Market Size (US$ Mn) Forecast, By Component, 2016–2026
Table 61: China Virtual Evolved Packet Core (vEPC) Market Size (US$ Mn) Forecast, By Services, 2016–2026
Table 62: China Virtual Evolved Packet Core (vEPC) Market Size (US$ Mn) Forecast, By Deployment, 2016–2026
Table 63: China Virtual Evolved Packet Core (vEPC) Market Size (US$ Mn) Forecast, By End User, 2016–2026
Table 64: China Virtual Evolved Packet Core (vEPC) Market Size (US$ Mn) Forecast, By Application, 2016–2026
Table 65: India Virtual Evolved Packet Core (vEPC) Market Size (US$ Mn) Forecast, By Component, 2016–2026
Table 66: India Virtual Evolved Packet Core (vEPC) Market Size (US$ Mn) Forecast, By Services, 2016–2026
Table 67: India Virtual Evolved Packet Core (vEPC) Market Size (US$ Mn) Forecast, By Deployment, 2016–2026
Table 68: India Virtual Evolved Packet Core (vEPC) Market Size (US$ Mn) Forecast, By End User, 2016–2026
Table 69: India Virtual Evolved Packet Core (vEPC) Market Size (US$ Mn) Forecast, By Application, 2016–2026
Table 70: Japan Virtual Evolved Packet Core (vEPC) Market Size (US$ Mn) Forecast, By Component, 2016–2026
Table 71: Japan Virtual Evolved Packet Core (vEPC) Market Size (US$ Mn) Forecast, By Services, 2016–2026
Table 72: Japan Virtual Evolved Packet Core (vEPC) Market Size (US$ Mn) Forecast, By Deployment, 2016–2026
Table 73: Japan Virtual Evolved Packet Core (vEPC) Market Size (US$ Mn) Forecast, By End User, 2016–2026
Table 74: Japan Virtual Evolved Packet Core (vEPC) Market Size (US$ Mn) Forecast, By Application, 2016–2026
Table 75: Rest of Asia Pacific Virtual Evolved Packet Core (vEPC) Market Size (US$ Mn) Forecast, By Component, 2016–2026
Table 76: Rest of Asia Pacific Virtual Evolved Packet Core (vEPC) Market Size (US$ Mn) Forecast, By Services, 2016–2026
Table 77: Rest of Asia Pacific Virtual Evolved Packet Core (vEPC) Market Size (US$ Mn) Forecast, By Deployment, 2016–2026
Table 78: Rest of Asia Pacific Virtual Evolved Packet Core (vEPC) Market Size (US$ Mn) Forecast, By End User, 2016–2026
Table 79: Rest of Asia Pacific Virtual Evolved Packet Core (vEPC) Market Size (US$ Mn) Forecast, By Application, 2016–2026
Table 80: Middle East and Africa Virtual Evolved Packet Core (vEPC) Market Size (US$ Mn) Forecast, By Component, 2016–2026
Table 81: Middle East and Africa Virtual Evolved Packet Core (vEPC) Market Size (US$ Mn) Forecast, By Services, 2016–2026
Table 82: Middle East and Africa Virtual Evolved Packet Core (vEPC) Market Size (US$ Mn) Forecast, By Deployment, 2016–2026
Table 83: Middle East and Africa Virtual Evolved Packet Core (vEPC) Market Size (US$ Mn) Forecast, By End User, 2016–2026
Table 84: Middle East and Africa Virtual Evolved Packet Core (vEPC) Market Size (US$ Mn) Forecast, By Application, 2016–2026
Table 85: Middle East and Africa Virtual Evolved Packet Core (vEPC) Market Size (US$ Mn) Forecast, By Country, 2016–2026
Table 86: GCC Virtual Evolved Packet Core (vEPC) Market Size (US$ Mn) Forecast, By Component, 2016–2026
Table 87: GCC Virtual Evolved Packet Core (vEPC) Market Size (US$ Mn) Forecast, By Services, 2016–2026
Table 88: GCC Virtual Evolved Packet Core (vEPC) Market Size (US$ Mn) Forecast, By Deployment, 2016–2026
Table 89: GCC Virtual Evolved Packet Core (vEPC) Market Size (US$ Mn) Forecast, By End User, 2016–2026
Table 90: GCC Virtual Evolved Packet Core (vEPC) Market Size (US$ Mn) Forecast, By Application, 2016–2026
Table 91: South Africa Virtual Evolved Packet Core (vEPC) Market Size (US$ Mn) Forecast, By Component, 2016–2026
Table 92: South Africa Virtual Evolved Packet Core (vEPC) Market Size (US$ Mn) Forecast, By Services, 2016–2026
Table 93: South Africa Virtual Evolved Packet Core (vEPC) Market Size (US$ Mn) Forecast, By Deployment, 2016–2026
Table 94: South Africa Virtual Evolved Packet Core (vEPC) Market Size (US$ Mn) Forecast, By End User, 2016–2026
Table 95: South Africa Virtual Evolved Packet Core (vEPC) Market Size (US$ Mn) Forecast, By Application, 2016–2026
Table 96: Rest of Middle East and Africa Virtual Evolved Packet Core (vEPC) Market Size (US$ Mn) Forecast, By Component, 2016–2026
Table 97: Rest of Middle East and Africa Virtual Evolved Packet Core (vEPC) Market Size (US$ Mn) Forecast, By Services, 2016–2026
Table 98: Rest of Middle East and Africa Virtual Evolved Packet Core (vEPC) Market Size (US$ Mn) Forecast, By Deployment, 2016–2026
Table 99: Rest of Middle East and Africa Virtual Evolved Packet Core (vEPC) Market Size (US$ Mn) Forecast, By End User, 2016–2026
Table 100: Rest of Middle East and Africa Virtual Evolved Packet Core (vEPC) Market Size (US$ Mn) Forecast, By Application, 2016–2026
Table 101: South America Virtual Evolved Packet Core (vEPC) Market Size (US$ Mn) Forecast, By Component, 2016–2026
Table 102: South America Virtual Evolved Packet Core (vEPC) Market Size (US$ Mn) Forecast, By Services, 2016–2026
Table 103: South America Virtual Evolved Packet Core (vEPC) Market Size (US$ Mn) Forecast, By Deployment, 2016–2026
Table 104: South America Virtual Evolved Packet Core (vEPC) Market Size (US$ Mn) Forecast, By End User, 2016–2026
Table 105: South America Virtual Evolved Packet Core (vEPC) Market Size (US$ Mn) Forecast, By Application, 2016–2026
Table 106: South America Virtual Evolved Packet Core (vEPC) Market Size (US$ Mn) Forecast, By Country, 2016–2026
Table 107: Brazil Virtual Evolved Packet Core (vEPC) Market Size (US$ Mn) Forecast, By Component, 2016–2026
Table 108: Brazil Virtual Evolved Packet Core (vEPC) Market Size (US$ Mn) Forecast, By Services, 2016–2026
Table 109: Brazil Virtual Evolved Packet Core (vEPC) Market Size (US$ Mn) Forecast, By Deployment, 2016–2026
Table 110: Brazil Virtual Evolved Packet Core (vEPC) Market Size (US$ Mn) Forecast, By End User, 2016–2026
Table 111: Brazil Virtual Evolved Packet Core (vEPC) Market Size (US$ Mn) Forecast, By Application, 2016–2026
Table 112: Rest of South America Virtual Evolved Packet Core (vEPC) Market Size (US$ Mn) Forecast, By Component, 2016–2026
Table 113: Rest of South America Virtual Evolved Packet Core (vEPC) Market Size (US$ Mn) Forecast, By Services, 2016–2026
Table 114: Rest of South America Virtual Evolved Packet Core (vEPC) Market Size (US$ Mn) Forecast, By Deployment, 2016–2026
Table 115: Rest of South America Virtual Evolved Packet Core (vEPC) Market Size (US$ Mn) Forecast, By End User, 2016–2026
Table 116: Rest of South America Virtual Evolved Packet Core (vEPC) Market Size (US$ Mn) Forecast, By Application, 2016–2026
List of Figures
Figure 1: Global Virtual Evolved Packet Core (vEPC) Market Size (US$ Mn) Forecast, 2016 - 2026
Figure 2: Global Virtual Evolved Packet Core (vEPC) Market Y-o-Y Growth (Value %) Forecast, 2016 - 2026
Figure 3: Market Revenue (US$ Mn) Growth Analysis By Component, 2018-2026
Figure 4: Market Revenue (US$ Mn) Growth Analysis By Deployment, 2018-2026
Figure 5: Market Revenue (US$ Mn) Growth Analysis By End-User, 2018-2026
Figure 6: Market Revenue (US$ Mn) Growth Analysis By Application, 2018-2026
Figure 7: Market Revenue (US$ Mn) Growth Analysis By Region, 2018-2026
Figure 8: Global Virtual Evolved Packet Core (vEPC) Market Revenue Share Analysis, By Component, 2018 and 2026
Figure 9: Global Virtual Evolved Packet Core (vEPC) Market Attractiveness Analysis By, Component
Figure 10: Global Virtual Evolved Packet Core (vEPC) Market Revenue Share Analysis, By Deployment, 2018 and 2026
Figure 11: Global Virtual Evolved Packet Core (vEPC) Market Attractiveness Analysis, By Deployment
Figure 12: Global Virtual Evolved Packet Core (vEPC) Market Revenue Share Analysis, By End User, 2018 and 2026
Figure 13: Global Virtual Evolved Packet Core (vEPC) Market Attractiveness Analysis By, End User
Figure 14: Global Virtual Evolved Packet Core (vEPC) Market Revenue Share Analysis, By Application, 2018 and 2026
Figure 15: Global Virtual Evolved Packet Core (vEPC) Market Attractiveness Analysis, By Application
Figure 16: Global Virtual Evolved Packet Core (vEPC) Market Revenue Share Analysis, By Region, 2018 and 2026
Figure 17: Global Virtual Evolved Packet Core (vEPC) Market Attractiveness Analysis, By Region
Figure 18: North America Virtual Evolved Packet Core (vEPC) Market Size (US$ Mn) Forecast, 2016–2026
Figure 19: North America Virtual Evolved Packet Core (vEPC) Market Size Y-o-Y Growth Projections, 2016–2025
Figure 20: North America Virtual Evolved Packet Core (vEPC) Market Revenue Share Analysis, By Component, 2018 and 2026
Figure 21: North America Virtual Evolved Packet Core (vEPC) Market Revenue Share Analysis, By Deployment, 2018 and 2026
Figure 22: North America Virtual Evolved Packet Core (vEPC) Market Revenue Share Analysis, By End User, 2018 and 2026
Figure 23: North America Virtual Evolved Packet Core (vEPC) Market Revenue Share Analysis, By Application, 2018 and 2026
Figure 24: North America Virtual Evolved Packet Core (vEPC) Market Revenue Share Analysis, By Country, 2018 and 2026
Figure 25: The U.S. Virtual Evolved Packet Core (vEPC) Market Revenue Share Analysis, By Component, 2018 and 2026
Figure 26: The U.S. Virtual Evolved Packet Core (vEPC) Market Revenue Share Analysis, By Deployment, 2018 and 2026
Figure 27: The U.S. Virtual Evolved Packet Core (vEPC) Market Revenue Share Analysis, By End User, 2018 and 2026
Figure 28: The U.S. Virtual Evolved Packet Core (vEPC) Market Revenue Share Analysis, By Application, 2018 and 2026
Figure 29: Canada Virtual Evolved Packet Core (vEPC) Market Revenue Share Analysis, By Component, 2018 and 2026
Figure 30: Canada Virtual Evolved Packet Core (vEPC) Market Revenue Share Analysis, By Deployment, 2018 and 2026
Figure 31: Canada Virtual Evolved Packet Core (vEPC) Market Revenue Share Analysis, By End User, 2018 and 2026
Figure 32: Canada Virtual Evolved Packet Core (vEPC) Market Revenue Share Analysis, By Application, 2018 and 2026
Figure 33: North America Virtual Evolved Packet Core (vEPC) Market Attractiveness Analysis By Component
Figure 34: North America Virtual Evolved Packet Core (vEPC) Market Attractiveness Analysis By Deployment
Figure 35: North America Virtual Evolved Packet Core (vEPC) Market Attractiveness Analysis By End User
Figure 36: North America Virtual Evolved Packet Core (vEPC) Market Attractiveness Analysis By Application
Figure 37: North America Virtual Evolved Packet Core (vEPC) Market Attractiveness Analysis, By Country/Region
Figure 38: Europe Virtual Evolved Packet Core (vEPC) Market Size (US$ Mn) Forecast, 2016–2026
Figure 39: Europe Virtual Evolved Packet Core (vEPC) Market Size Y-o-Y Growth Projections, 2016–2025
Figure 40: Europe Virtual Evolved Packet Core (vEPC) Market Revenue Share Analysis, By Component, 2018 and 2026
Figure 41: Europe Virtual Evolved Packet Core (vEPC) Market Revenue Share Analysis, By Deployment, 2018 and 2026
Figure 42: Europe Virtual Evolved Packet Core (vEPC) Market Revenue Share Analysis, By End User, 2018 and 2026
Figure 43: Europe Virtual Evolved Packet Core (vEPC) Market Revenue Share Analysis, By Application, 2018 and 2026
Figure 44: Europe Virtual Evolved Packet Core (vEPC) Market Revenue Share Analysis, By Country, 2018 and 2026
Figure 45: The U.K. Virtual Evolved Packet Core (vEPC) Market Revenue Share Analysis, By Component, 2018 and 2026
Figure 46: The U.K. Virtual Evolved Packet Core (vEPC) Market Revenue Share Analysis, By Deployment, 2018 and 2026
Figure 47: The U.K. Virtual Evolved Packet Core (vEPC) Market Revenue Share Analysis, By End User, 2018 and 2026
Figure 48: The U.K. Virtual Evolved Packet Core (vEPC) Market Revenue Share Analysis, By Application, 2018 and 2026
Figure 49: Germany Virtual Evolved Packet Core (vEPC) Market Revenue Share Analysis, By Component, 2018 and 2026
Figure 50: Germany Virtual Evolved Packet Core (vEPC) Market Revenue Share Analysis, By Deployment, 2018 and 2026
Figure 51: Germany Virtual Evolved Packet Core (vEPC) Market Revenue Share Analysis, By End User, 2018 and 2026
Figure 52: Germany Virtual Evolved Packet Core (vEPC) Market Revenue Share Analysis, By Application, 2018 and 2026
Figure 53: France Virtual Evolved Packet Core (vEPC) Market Revenue Share Analysis, By Component, 2018 and 2026
Figure 54: France Virtual Evolved Packet Core (vEPC) Market Revenue Share Analysis, By Deployment, 2018 and 2026
Figure 55: France Virtual Evolved Packet Core (vEPC) Market Revenue Share Analysis, By End User, 2018 and 2026
Figure 56: France Virtual Evolved Packet Core (vEPC) Market Revenue Share Analysis, By Application, 2018 and 2026
Figure 57: Europe Virtual Evolved Packet Core (vEPC) Market Attractiveness Analysis By Component
Figure 58: Europe Virtual Evolved Packet Core (vEPC) Market Attractiveness Analysis By Deployment
Figure 59: Europe Virtual Evolved Packet Core (vEPC) Market Attractiveness Analysis By End User
Figure 60: Europe Virtual Evolved Packet Core (vEPC) Market Attractiveness Analysis By Application
Figure 61: Europe Virtual Evolved Packet Core (vEPC) Market Attractiveness Analysis, By Country/Region
Figure 62: Asia Pacific Virtual Evolved Packet Core (vEPC) Market Size (US$ Mn) Forecast, 2016–2026
Figure 63: Asia Pacific Virtual Evolved Packet Core (vEPC) Market Size Y-o-Y Growth Projections, 2016–2025
Figure 64: Asia Pacific Virtual Evolved Packet Core (vEPC) Market Revenue Share Analysis, By Component, 2018 and 2026
Figure 65: Asia Pacific Virtual Evolved Packet Core (vEPC) Market Revenue Share Analysis, By Deployment, 2018 and 2026
Figure 66: Asia Pacific Virtual Evolved Packet Core (vEPC) Market Revenue Share Analysis, By End User, 2018 and 2026
Figure 67: Asia Pacific Virtual Evolved Packet Core (vEPC) Market Revenue Share Analysis, By Application, 2018 and 2026
Figure 68: Asia Pacific Virtual Evolved Packet Core (vEPC) Market Revenue Share Analysis, By Country, 2018 and 2026
Figure 69: China Virtual Evolved Packet Core (vEPC) Market Revenue Share Analysis, By Component, 2018 and 2026
Figure 70: China Virtual Evolved Packet Core (vEPC) Market Revenue Share Analysis, By Deployment, 2018 and 2026
Figure 71: China Virtual Evolved Packet Core (vEPC) Market Revenue Share Analysis, By End User, 2018 and 2026
Figure 72: China Virtual Evolved Packet Core (vEPC) Market Revenue Share Analysis, By Application, 2018 and 2026
Figure 73: India Virtual Evolved Packet Core (vEPC) Market Revenue Share Analysis, By Component, 2018 and 2026
Figure 74: India Virtual Evolved Packet Core (vEPC) Market Revenue Share Analysis, By Deployment, 2018 and 2026
Figure 75: India Virtual Evolved Packet Core (vEPC) Market Revenue Share Analysis, By End User, 2018 and 2026
Figure 76: India Virtual Evolved Packet Core (vEPC) Market Revenue Share Analysis, By Application, 2018 and 2026
Figure 77: Japan Virtual Evolved Packet Core (vEPC) Market Revenue Share Analysis, By Component, 2018 and 2026
Figure 78: Japan Virtual Evolved Packet Core (vEPC) Market Revenue Share Analysis, By Deployment, 2018 and 2026
Figure 79: Japan Virtual Evolved Packet Core (vEPC) Market Revenue Share Analysis, By End User, 2018 and 2026
Figure 80: Japan Virtual Evolved Packet Core (vEPC) Market Revenue Share Analysis, By Application, 2018 and 2026
Figure 81: Asia Pacific Virtual Evolved Packet Core (vEPC) Market Attractiveness Analysis By Component
Figure 82: Asia Pacific Virtual Evolved Packet Core (vEPC) Market Attractiveness Analysis By Deployment
Figure 83: Asia Pacific Virtual Evolved Packet Core (vEPC) Market Attractiveness Analysis By End User
Figure 84: Asia Pacific Virtual Evolved Packet Core (vEPC) Market Attractiveness Analysis By Application
Figure 85: Asia Pacific Virtual Evolved Packet Core (vEPC) Market Attractiveness Analysis, By Country/Region
Figure 86: Middle East and Africa Virtual Evolved Packet Core (vEPC) Market Size (US$ Mn) Forecast, 2016–2026
Figure 87: Middle East and Africa Virtual Evolved Packet Core (vEPC) Market Size Y-o-Y Growth Projections, 2016–2025
Figure 88: Middle East and Africa Virtual Evolved Packet Core (vEPC) Market Revenue Share Analysis, By Component, 2018 and 2026
Figure 89: Middle East and Africa Virtual Evolved Packet Core (vEPC) Market Revenue Share Analysis, By Deployment, 2018 and 2026
Figure 90: Middle East and Africa Virtual Evolved Packet Core (vEPC) Market Revenue Share Analysis, By End User, 2018 and 2026
Figure 91: Middle East and Africa Virtual Evolved Packet Core (vEPC) Market Revenue Share Analysis, By Application, 2018 and 2026
Figure 92: Middle East and Africa Virtual Evolved Packet Core (vEPC) Market Revenue Share Analysis, By Country, 2018 and 2026
Figure 93: GCC Virtual Evolved Packet Core (vEPC) Market Revenue Share Analysis, By Component, 2018 and 2026
Figure 94: GCC Virtual Evolved Packet Core (vEPC) Market Revenue Share Analysis, By Deployment, 2018 and 2026
Figure 95: GCC Virtual Evolved Packet Core (vEPC) Market Revenue Share Analysis, By End User, 2018 and 2026
Figure 96: GCC Virtual Evolved Packet Core (vEPC) Market Revenue Share Analysis, By Application, 2018 and 2026
Figure 97: South Africa Virtual Evolved Packet Core (vEPC) Market Revenue Share Analysis, By Component, 2018 and 2026
Figure 98: South Africa Virtual Evolved Packet Core (vEPC) Market Revenue Share Analysis, By Deployment, 2018 and 2026
Figure 99: South Africa Virtual Evolved Packet Core (vEPC) Market Revenue Share Analysis, By End User, 2018 and 2026
Figure 100: South Africa Virtual Evolved Packet Core (vEPC) Market Revenue Share Analysis, By Application, 2018 and 2026
Figure 101: Middle East and Africa Virtual Evolved Packet Core (vEPC) Market Attractiveness Analysis By Component
Figure 102: Middle East and Africa Virtual Evolved Packet Core (vEPC) Market Attractiveness Analysis By Deployment
Figure 103: Middle East and Africa Virtual Evolved Packet Core (vEPC) Market Attractiveness Analysis By End User
Figure 104: Middle East and Africa Virtual Evolved Packet Core (vEPC) Market Attractiveness Analysis By Application
Figure 105: Middle East and Africa Virtual Evolved Packet Core (vEPC) Market Attractiveness Analysis, By Country/Region
Figure 106: South America Virtual Evolved Packet Core (vEPC) Market Size (US$ Mn) Forecast, 2016–2026
Figure 107: South America Virtual Evolved Packet Core (vEPC) Market Size Y-o-Y Growth Projections, 2016–2025
Figure 108: South America Virtual Evolved Packet Core (vEPC) Market Revenue Share Analysis, By Component, 2018 and 2026
Figure 109: South America Virtual Evolved Packet Core (vEPC) Market Revenue Share Analysis, By Deployment, 2018 and 2026
Figure 110: South America Virtual Evolved Packet Core (vEPC) Market Revenue Share Analysis, By End User, 2018 and 2026
Figure 111: South America Virtual Evolved Packet Core (vEPC) Market Revenue Share Analysis, By Application, 2018 and 2026
Figure 112: South America Virtual Evolved Packet Core (vEPC) Market Revenue Share Analysis, By Country, 2018 and 2026
Figure 113: Brazil Virtual Evolved Packet Core (vEPC) Market Revenue Share Analysis, By Component, 2018 and 2026
Figure 114: Brazil Virtual Evolved Packet Core (vEPC) Market Revenue Share Analysis, By Deployment, 2018 and 2026
Figure 115: Brazil Virtual Evolved Packet Core (vEPC) Market Revenue Share Analysis, By End User, 2018 and 2026
Figure 116: Brazil Virtual Evolved Packet Core (vEPC) Market Revenue Share Analysis, By Application, 2018 and 2026
Figure 117: South America Virtual Evolved Packet Core (vEPC) Market Attractiveness Analysis By Component
Figure 118: South America Virtual Evolved Packet Core (vEPC) Market Attractiveness Analysis By Deployment
Figure 119: South America Virtual Evolved Packet Core (vEPC) Market Attractiveness Analysis By End User
Figure 120: South America Virtual Evolved Packet Core (vEPC) Market Attractiveness Analysis By Application
Figure 121: Virtual Evolved Packet Core (vEPC) Market Share Analysis By Company (2017)
Copyright © Transparency Market Research, Inc. All Rights reserved
Trust Online

Virtual Evolved Packet Core (vEPC) Market