
Reports
Reports
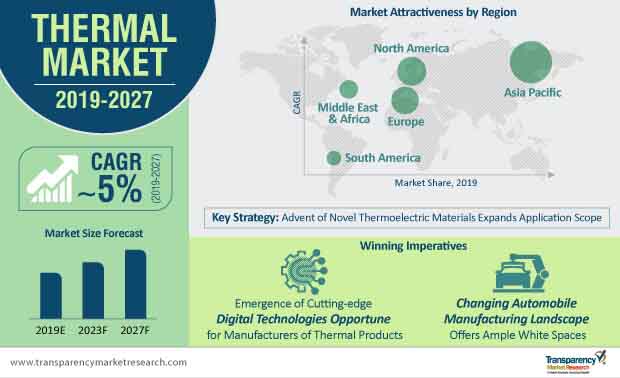
In thermoelectric energy generation environments, the advent of a newer thermoelectric material for thermal products is a breakthrough to capture residual energy. This energy is usually lost during the regular process of the conversion of waste heat into electricity. Based on common semiconductor telluride, the new material is environmentally-stable, and is expected to capture 15 to 20 percent of waste heat into electricity. This strengthens the correlation between thermoelectric materials and the thermoelectric effect. Based on the merits exhibited, the new material is gauged to have a 2.2 thermoelectric figure of merit (ZT), the highest among thermoelectric materials available so far. Meanwhile, under laws of thermoelectricity, the higher ZT of a material connotes higher efficiency for converting heat into electricity.
Such developments point at a positive outlook for the uptake of thermoelectric-based HVAC cooling systems in industrial and commercial environments. For instance, HVAC cooling systems based on the Seebeck effect that create voltage from temperature difference are increasingly being installed. Such moves are aimed to comply with governmental guidelines for energy-efficient processes and to reduce wastage of energy.
Exponential growth of the IT & telecommunications sector has indirectly led to a spurt in the demand for thermal products. HVAC cooling systems that use thermal products find wide use for cooling servers and computers. This serves to boost the thermal market, indirectly. Expansion of the food and beverage sector in developing economies such as India has indirectly led to a spurt in demand within the thermal market. Strong macro-economic indicators, reforms, and liberalized foreign direct investment have massively expanded the scope of individual operations for the production of food and beverages. Food production, packaging, shipping, and distribution are some energy-hungry operations in the food and beverage sector. Such operations heavily depend upon HVAC systems to maintain optimum indoor temperatures on shop floors.
While thermoelectric systems are mostly used in cooling devices, these systems find use in the heating devices of HVAC systems. This further expands the scope of demand for thermal products, translating into growth for the thermal market.
Finding applications in high economic value end-use industries, thermal products and the associated thermal market are poised for significant growth. This aroused interest of Transparency Market Research to release a market intelligence publication of the thermal market. Following extensive research and employing standard analytical tools, TMR forecasts the global thermal market to rise at a ~5% CAGR during the forecast period of 2019 to 2027.
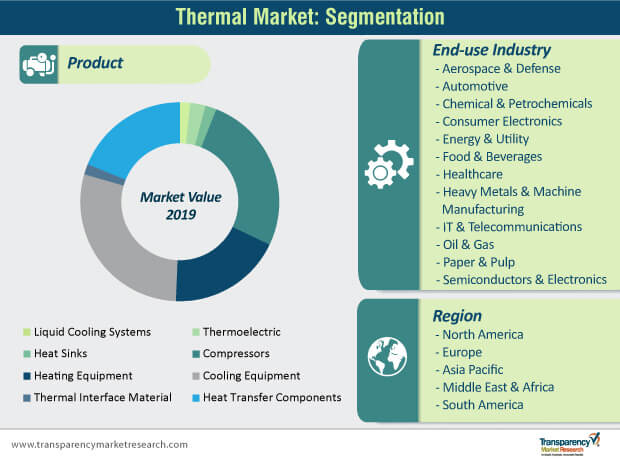
Among the key product types, the liquid cooling system segment is poised to display significant growth in the thermal market over the forecast period. The growth of this segment mainly stems to serve the demand of the IT & telecommunication sector, which is booming with digitalization in almost every walk of life. Serving this, liquid cooling systems are predicted to register a leading CAGR among other products in the thermal market during the forecast period.
On the other hand, the cooling equipment product segment holds a leading share in the thermal market, which is predicted to continue over the forecast period. This is because of the vast demand for cooling equipment from several end-use industries of high economic significance, including oil & gas, food & beverages, and chemicals & petroleum.
By end-use industry, the heavy metals and manufacturing industry holds a lion’s share in the thermal market, and is predicted to maintain its share over the forecast period.
Nonetheless, the IT & telecommunications sector is predicted to emerge as a significant end-use industry in the thermal market. Vast expansion of the IT sector to support mammoth volumes of data generated from commercial, industrial, and domestic sectors has led to a stir in the demand for core and support equipment. IT systems of large organizations with multiple servers require 24x7 uptime to serve employees working from multiple locations. This requires reliable cooling equipment to minimize the downtime of these IT systems. Cooling equipment plays a key role here, which, in turn, stimulates the growth of the thermal market.
In a moving vehicles, a large amount of heat is generated in the engine every time the spark plug ignites fuel in each cylinder to propel the vehicle. A cooling system plays a crucial role here to control these high temperatures so as to maintain a comfortable interior temperature for the passengers.
Changing consumer expectations from automobiles has led to a sea of change in the processes in the entire automotive ecosystem. Autonomous vehicles, biometric access for vehicles, and parameters of increased safety have led to requirements of several other energy-driven equipment and processes. This includes an array of thermal products such as heat sinks and heating equipment for the two-way transfer of heat. Such assemblies are examples of the Seebeck-Peltier effect for the transfer of heat and potential difference, and vice-versa.
The ceaseless adoption of consumer electronics is also creating demand for thermal products and equipment. Vast technological innovations and advancements in the manufacture of consumer electronics have led to newer assembly and manufacturing environments for these products.
The reshaping of the telecom sector over the past few years and adoption of cutting-edge technologies such as cloud computing and 5G technology have influenced the demand for thermal products to a great extent, in turn, fueling the growth of the market. The scope of development of new thermal technologies serves to provide lucrative opportunities for players in the thermal market. To leverage this, extensive R&D to develop equipment for various ambient temperatures is what savvy players are banking on for growth.
From a competitive standpoint, the thermal market features a fragmented vendor landscape, including established and emerging players. Nonetheless, leading players having a long presence in the market hold ~one-third share of the overall thermal market. Keen players vying to consolidate their position are focused on R&D. These companies are striving to develop next-generation thermal products to be compatible with the manufacturing assembly lines of advanced automobile companies.
The development of novel thermal products to cut energy costs is also the focus of keen players in the thermal market. For example, DCX The Liquid Cooling Company is focused on saving the energy consumption of industrial systems by almost 50%, and cutting the CAPEX and OPEX costs of running IT and telecom infrastructures.
Acquisitions and collaborations are also some growth strategies that players in the thermal market have resorted to. In a recent industry development, SPX Corporation – an Illinois-based company, completed the acquisition of Sabik Marine and Obstruction lighting business.
Increasing Use of Thermal Products in Food and Beverages a Key Market Driver
Development of Energy-efficient Systems Latest Trend Being Adopted by Key Market Players
Sluggish Growth of Markets in Europe and North America a Major Challenge
Global Thermal Market: Competition Landscape
Global Thermal Market: Key Developments
Manufacturers operating in the global thermal market, such as Blue Star Limited, Advanced Cooling Technologies, Inc., and ASSMANN WSW Components GmbH, are strengthening their market position by improving product quality and expanding their businesses. Certain key developments in the global thermal market are as follows:
The ‘Competition Landscape’ section has been included in the report to provide readers with a dashboard view and company market share analysis of key players operating in the global thermal market.
1. Preface
1.1. Market Definition and Scope
1.2. Market Segmentation
1.3. Key Research Objectives
1.4. Research Highlights
2. Assumptions and Research Methodology
3. Executive Summary: Global Thermal Market
4. Market Overview
4.1. Introduction
4.2. Market Dynamics
4.2.1. Drivers
4.2.2. Restraints
4.2.3. Opportunities
4.3. Key Trends Analysis
4.4. Global Thermal Market Analysis and Forecast, 2017–2027
4.4.1. Market Revenue Projection (US$ Mn)
4.4.2. Market Volume Projection (Million Units)
4.5. Porter’s Five Forces Analysis - Global Thermal Market
4.6. Market Outlook
5. Thermal Market Analysis and Forecast, By Product
5.1. Overview & Definitions
5.2. Global Thermal Market Size (US$ Mn and Million Units) Forecast, by Product, 2017–2027
5.2.1. Liquid Cooling Systems
5.2.1.1. Liquid Heat Exchanger Systems
5.2.1.2. Compressor-based Systems (Recirculating Chillers)
5.2.2. Thermoelectric
5.2.3. Heat Sinks
5.2.4. Compressors
5.2.5. Heating Equipment
5.2.5.1. Furnaces
5.2.5.2. Heaters
5.2.5.3. Boilers
5.2.6. Cooling Equipment
5.2.6.1. VRF
5.2.6.2. Ducted Split/Packaged Units
5.2.6.3. Split Units
5.2.6.4. Others
5.2.7. Thermal Interface Materials (TIMs)
5.2.8. Heat Transfer Component
5.2.8.1. Heat Pumps
5.2.8.2. Fans
5.2.8.3. Heat Pipes & Plates
5.3. Product Comparison Matrix
5.4. Global Thermal Market Attractiveness, by Product
6. Global Thermal Market Analysis and Forecast, by End-use Industry
6.1. Overview & Definitions
6.2. Global Thermal Market Revenue (US$ Mn) Forecast, by End-use Industry, 2017–2027
6.2.1. Aerospace & Defense
6.2.2. Automotive
6.2.3. Chemicals & Petrochemicals
6.2.4. Consumer Electronics
6.2.5. Energy & Utilities
6.2.6. Food & Beverages
6.2.7. Healthcare
6.2.8. Heavy Metals & Machine Manufacturing
6.2.9. IT & Telecommunications
6.2.10. Oil & Gas
6.2.11. Paper & Pulp
6.2.12. Semiconductors & Electronics
6.2.13. Others
6.3. End-use Industry Comparison Matrix
6.4. Global Thermal Market Attractiveness, by End-use Industry
7. Global Thermal Market Analysis and Forecast, by Region
7.1. Key Findings
7.2. Global Thermal Market Size (US$ Mn and Million Units) Forecast, by Region, 2017–2027
7.2.1. North America
7.2.2. Europe
7.2.3. Asia Pacific
7.2.4. Middle East & Africa
7.2.5. South America
7.3. Global Thermal Market Attractiveness, by Region
8. North America Thermal Market Analysis and Forecast
8.1. Key Findings
8.2. North America Thermal Market Size (US$ Mn and Million Units) Forecast, by Product, 2017–2027
8.2.1. Liquid Cooling Systems
8.2.1.1. Liquid Heat Exchanger Systems
8.2.1.2. Compressors-based Systems (Recirculating Chillers)
8.2.2. Thermoelectric
8.2.3. Heat Sinks
8.2.4. Compressors
8.2.5. Heating Equipment
8.2.5.1. Furnaces
8.2.5.2. Heaters
8.2.5.3. Boilers
8.2.6. Cooling Equipment
8.2.6.1. VRF
8.2.6.2. Ducted Split/Packaged Units
8.2.6.3. Split Units
8.2.6.4. Others
8.2.7. Thermal Interface Materials (TIMs)
8.2.8. Heat Transfer Component
8.2.8.1. Heat Pumps
8.2.8.2. Fans
8.2.8.3. Heat Pipes & Plates
8.3. North America Thermal Market Revenue (US$ Mn) Forecast, by End-use Industry, 2017–2027
8.3.1. Aerospace & Defense
8.3.2. Automotive
8.3.3. Chemicals & Petrochemicals
8.3.4. Consumer Electronics
8.3.5. Energy & Utilities
8.3.6. Food & Beverages
8.3.7. Healthcare
8.3.8. Heavy Metals & Machine Manufacturing
8.3.9. IT & Telecommunications
8.3.10. Oil & Gas
8.3.11. Paper & Pulp
8.3.12. Semiconductors & Electronics
8.3.13. Others
8.4. North America Thermal Market Size (US$ Mn and Million Units) Forecast, by Country, 2017–2027
8.4.1. U.S.
8.4.2. Canada
8.4.3. Rest of North America
8.5. North America Thermal Market Attractiveness Analysis
8.5.1. By Product
8.5.2. By End-use Industry
8.5.3. By Country/Sub-region
9. Europe Thermal Market Analysis and Forecast
9.1. Key Findings
9.2. Europe Thermal Market Size (US$ Mn and Million Units) Forecast, by Product, 2017–2027
9.2.1. Liquid Cooling Systems
9.2.1.1. Liquid Heat Exchanger Systems
9.2.1.2. Compressors-based Systems (Recirculating Chillers)
9.2.2. Thermoelectric
9.2.3. Heat Sinks
9.2.4. Compressors
9.2.5. Heating Equipment
9.2.5.1. Furnaces
9.2.5.2. Heaters
9.2.5.3. Boilers
9.2.6. Cooling Equipment
9.2.6.1. VRF
9.2.6.2. Ducted Split/Packaged Units
9.2.6.3. Split Units
9.2.6.4. Others
9.2.7. Thermal Interface Materials (TIMs)
9.2.8. Heat Transfer Component
9.2.8.1. Heat Pumps
9.2.8.2. Fans
9.2.8.3. Heat Pipes & Plates
9.3. Europe Thermal Market Revenue (US$ Mn) Forecast, by End-use Industry, 2017–2027
9.3.1. Aerospace & Defense
9.3.2. Automotive
9.3.3. Chemicals & Petrochemicals
9.3.4. Consumer Electronics
9.3.5. Energy & Utilities
9.3.6. Food & Beverages
9.3.7. Healthcare
9.3.8. Heavy Metals & Machine Manufacturing
9.3.9. IT & Telecommunications
9.3.10. Oil & Gas
9.3.11. Paper & Pulp
9.3.12. Semiconductors & Electronics
9.3.13. Others
9.4. Europe Thermal Market Size (US$ Mn and Million Units) Forecast, by Country, 2017–2027
9.4.1. Germany
9.4.2. U.K.
9.4.3. France
9.4.4. Rest of Europe
9.5. Europe Thermal Market Attractiveness Analysis
9.5.1. By Product
9.5.2. By End-use Industry
9.5.3. By Country/Sub-region
10. Asia Pacific Thermal Market Analysis and Forecast
10.1. Key Findings
10.2. Asia Pacific Thermal Market Size (US$ Mn and Million Units) Forecast, by Product, 2017–2027
10.2.1. Liquid Cooling Systems
10.2.1.1. Liquid Heat Exchanger Systems
10.2.1.2. Compressors-based Systems (Recirculating Chillers)
10.2.2. Thermoelectric
10.2.3. Heat Sinks
10.2.4. Compressors
10.2.5. Heating Equipment
10.2.5.1. Furnaces
10.2.5.2. Heaters
10.2.5.3. Boilers
10.2.6. Cooling Equipment
10.2.6.1. VRF
10.2.6.2. Ducted Split/Packaged Units
10.2.6.3. Split Units
10.2.6.4. Others
10.2.7. Thermal Interface Materials (TIMs)
10.2.8. Heat Transfer Component
10.2.8.1. Heat Pumps
10.2.8.2. Fans
10.2.8.3. Heat Pipes & Plates
10.3. Asia Pacific Thermal Market Revenue (US$ Mn) Forecast, by End-use Industry, 2017–2027
10.3.1. Aerospace & Defense
10.3.2. Automotive
10.3.3. Chemicals & Petrochemicals
10.3.4. Consumer Electronics
10.3.5. Energy & Utilities
10.3.6. Food & Beverages
10.3.7. Healthcare
10.3.8. Heavy Metals & Machine Manufacturing
10.3.9. IT & Telecommunications
10.3.10. Oil & Gas
10.3.11. Paper & Pulp
10.3.12. Semiconductors & Electronics
10.3.13. Others
10.4. Asia Pacific Thermal Market Size (US$ Mn and Million Units) Forecast, by Country, 2017–2027
10.4.1. China
10.4.2. India
10.4.3. Japan
10.4.4. Australia
10.4.5. Rest of Asia Pacific
10.5. Asia Pacific Thermal Market Attractiveness Analysis
10.5.1. By Product
10.5.2. By End-use Industry
10.5.3. By Country/Sub-region
11. Middle East & Africa Thermal Market Analysis and Forecast
11.1. Key Findings
11.2. Middle East & Africa Thermal Market Size (US$ Mn and Million Units) Forecast, by Product, 2017–2027
11.2.1. Liquid Cooling Systems
11.2.1.1. Liquid Heat Exchanger Systems
11.2.1.2. Compressors-based Systems (Recirculating Chillers)
11.2.2. Thermoelectric
11.2.3. Heat Sinks
11.2.4. Compressors
11.2.5. Heating Equipment
11.2.5.1. Furnaces
11.2.5.2. Heaters
11.2.5.3. Boilers
11.2.6. Cooling Equipment
11.2.6.1. VRF
11.2.6.2. Ducted Split/Packaged Units
11.2.6.3. Split Units
11.2.6.4. Others
11.2.7. Thermal Interface Materials (TIMs)
11.2.8. Heat Transfer Component
11.2.8.1. Heat Pumps
11.2.8.2. Fans
11.2.8.3. Heat Pipes & Plates
11.3. Middle East & Africa Thermal Market Revenue (US$ Mn) Forecast, by End-use Industry, 2017–2027
11.3.1. Aerospace & Defense
11.3.2. Automotive
11.3.3. Chemicals & Petrochemicals
11.3.4. Consumer Electronics
11.3.5. Energy & Utilities
11.3.6. Food & Beverages
11.3.7. Healthcare
11.3.8. Heavy Metals & Machine Manufacturing
11.3.9. IT & Telecommunications
11.3.10. Oil & Gas
11.3.11. Paper & Pulp
11.3.12. Semiconductors & Electronics
11.3.13. Others
11.4. Middle East & Africa Thermal Market Size (US$ Mn and Million Units) Forecast, by Country, 2017–2027
11.4.1. GCC
11.4.2. South Africa
11.4.3. Rest of Middle East & Africa
11.5. Middle East & Africa Thermal Market Attractiveness Analysis
11.5.1. By Product
11.5.2. By End-use Industry
11.5.3. By Country/Sub-region
12. South America Thermal Market Analysis and Forecast
12.1. Key Findings
12.2. South America Thermal Market Size (US$ Mn and Million Units) Forecast, by Product, 2017–2027
12.2.1. Liquid Cooling Systems
12.2.1.1. Liquid Heat Exchanger Systems
12.2.1.2. Compressors-based Systems (Recirculating Chillers)
12.2.2. Thermoelectric
12.2.3. Heat Sinks
12.2.4. Compressors
12.2.5. Heating Equipment
12.2.5.1. Furnaces
12.2.5.2. Heaters
12.2.5.3. Boilers
12.2.6. Cooling Equipment
12.2.6.1. VRF
12.2.6.2. Ducted Split/Packaged Units
12.2.6.3. Split Units
12.2.6.4. Others
12.2.7. Thermal Interface Materials (TIMs)
12.2.8. Heat Transfer Component
12.2.8.1. Heat Pumps
12.2.8.2. Fans
12.2.8.3. Heat Pipes & Plates
12.3. South America Thermal Market Revenue (US$ Mn) Forecast, by End-use Industry, 2017–2027
12.3.1. Aerospace & Defense
12.3.2. Automotive
12.3.3. Chemicals & Petrochemicals
12.3.4. Consumer Electronics
12.3.5. Energy & Utilities
12.3.6. Food & Beverages
12.3.7. Healthcare
12.3.8. Heavy Metals & Machine Manufacturing
12.3.9. IT & Telecommunications
12.3.10. Oil & Gas
12.3.11. Paper & Pulp
12.3.12. Semiconductors & Electronics
12.3.13. Others
12.4. South America Thermal Market Size (US$ Mn and Million Units) Forecast, by Country, 2017–2027
12.4.1. Brazil
12.4.2. Rest of South America
12.5. South America Thermal Market Attractiveness Analysis
12.5.1. By Product
12.5.2. By End-use Industry
12.5.3. By Country/Sub-region
13. Competition Landscape
13.1. Global Thermal Market Share Analysis, by Company (2018)
13.2. Company Profiles (Details – Basic Overview, Recent Developments, Geographical Presence, Revenue, SWOT Analysis, and Strategy)
13.2.1. Advanced Cooling Technologies
13.2.1.1. Basic Overview
13.2.1.2. Recent Developments
13.2.1.3. Geographical Presence
13.2.1.4. Revenue
13.2.1.5. SWOT Analysis
13.2.1.6. Strategy
13.2.2. AHI Carrier
13.2.2.1. Basic Overview
13.2.2.2. Recent Developments
13.2.2.3. Geographical Presence
13.2.2.4. Revenue
13.2.2.5. SWOT Analysis
13.2.2.6. Strategy
13.2.3. AranerLytron
13.2.3.1. Basic Overview
13.2.3.2. Recent Developments
13.2.3.3. Geographical Presence
13.2.3.4. Revenue
13.2.3.5. SWOT Analysis
13.2.3.6. Strategy
13.2.4. Asetek
13.2.4.1. Basic Overview
13.2.4.2. Recent Developments
13.2.4.3. Geographical Presence
13.2.4.4. Revenue
13.2.4.5. SWOT Analysis
13.2.4.6. Strategy
13.2.5. ASSMANN WSW Components GmbH
13.2.5.1. Basic Overview
13.2.5.2. Recent Developments
13.2.5.3. Geographical Presence
13.2.5.4. Revenue
13.2.5.5. SWOT Analysis
13.2.5.6. Strategy
13.2.6. Bluestar Limited
13.2.6.1. Basic Overview
13.2.6.2. Recent Developments
13.2.6.3. Geographical Presence
13.2.6.4. Revenue
13.2.6.5. SWOT Analysis
13.2.6.6. Strategy
13.2.7. CTS CORPORATION
13.2.7.1. Basic Overview
13.2.7.2. Recent Developments
13.2.7.3. Geographical Presence
13.2.7.4. Revenue
13.2.7.5. SWOT Analysis
13.2.7.6. Strategy
13.2.8. DCX Sp. z.o.o.
13.2.8.1. Basic Overview
13.2.8.2. Recent Developments
13.2.8.3. Geographical Presence
13.2.8.4. Revenue
13.2.8.5. SWOT Analysis
13.2.8.6. Strategy
13.2.9. DK THERMAL METAL CIRCUIT TECHNOLOGY
13.2.9.1. Basic Overview
13.2.9.2. Recent Developments
13.2.9.3. Geographical Presence
13.2.9.4. Revenue
13.2.9.5. SWOT Analysis
13.2.9.6. Strategy
13.2.10. Ferrotec Corporation
13.2.10.1. Basic Overview
13.2.10.2. Recent Developments
13.2.10.3. Geographical Presence
13.2.10.4. Revenue
13.2.10.5. SWOT Analysis
13.2.10.6. Strategy
13.2.11. Henkel AG & Co. KGaA
13.2.11.1. Basic Overview
13.2.11.2. Recent Developments
13.2.11.3. Geographical Presence
13.2.11.4. Revenue
13.2.11.5. SWOT Analysis
13.2.11.6. Strategy
13.2.12. II-VI Incorporated
13.2.12.1. Basic Overview
13.2.12.2. Recent Developments
13.2.12.3. Geographical Presence
13.2.12.4. Revenue
13.2.12.5. SWOT Analysis
13.2.12.6. Strategy
13.2.13. International Thermal Systems
13.2.13.1. Basic Overview
13.2.13.2. Recent Developments
13.2.13.3. Geographical Presence
13.2.13.4. Revenue
13.2.13.5. SWOT Analysis
13.2.13.6. Strategy
13.2.14. JULABO GmbH
13.2.14.1. Basic Overview
13.2.14.2. Recent Developments
13.2.14.3. Geographical Presence
13.2.14.4. Revenue
13.2.14.5. SWOT Analysis
13.2.14.6. Strategy
13.2.15. Keith Company
13.2.15.1. Basic Overview
13.2.15.2. Recent Developments
13.2.15.3. Geographical Presence
13.2.15.4. Revenue
13.2.15.5. SWOT Analysis
13.2.15.6. Strategy
13.2.16. Kelk
13.2.16.1. Basic Overview
13.2.16.2. Recent Developments
13.2.16.3. Geographical Presence
13.2.16.4. Revenue
13.2.16.5. SWOT Analysis
13.2.16.6. Strategy
13.2.17. Komatsu Ltd.
13.2.17.1. Basic Overview
13.2.17.2. Recent Developments
13.2.17.3. Geographical Presence
13.2.17.4. Revenue
13.2.17.5. SWOT Analysis
13.2.17.6. Strategy
13.2.18. Laird Thermal
13.2.18.1. Basic Overview
13.2.18.2. Recent Developments
13.2.18.3. Geographical Presence
13.2.18.4. Revenue
13.2.18.5. SWOT Analysis
13.2.18.6. Strategy
13.2.19. Lytron
13.2.19.1. Basic Overview
13.2.19.2. Recent Developments
13.2.19.3. Geographical Presence
13.2.19.4. Revenue
13.2.19.5. SWOT Analysis
13.2.19.6. Strategy
13.2.20. Opticool Technologies
13.2.20.1. Basic Overview
13.2.20.2. Recent Developments
13.2.20.3. Geographical Presence
13.2.20.4. Revenue
13.2.20.5. SWOT Analysis
13.2.20.6. Strategy
13.2.21. Polyscience
13.2.21.1. Basic Overview
13.2.21.2. Recent Developments
13.2.21.3. Geographical Presence
13.2.21.4. Revenue
13.2.21.5. SWOT Analysis
13.2.21.6. Strategy
13.2.22. Radian Thermal Products
13.2.22.1. Basic Overview
13.2.22.2. Recent Developments
13.2.22.3. Geographical Presence
13.2.22.4. Revenue
13.2.22.5. SWOT Analysis
13.2.22.6. Strategy
13.2.23. SMC Corporation
13.2.23.1. Basic Overview
13.2.23.2. Recent Developments
13.2.23.3. Geographical Presence
13.2.23.4. Revenue
13.2.23.5. SWOT Analysis
13.2.23.6. Strategy
13.2.24. Subros Limited
13.2.24.1. Basic Overview
13.2.24.2. Recent Developments
13.2.24.3. Geographical Presence
13.2.24.4. Revenue
13.2.24.5. SWOT Analysis
13.2.24.6. Strategy
13.2.25. Thermal Care, Inc.
13.2.25.1. Basic Overview
13.2.25.2. Recent Developments
13.2.25.3. Geographical Presence
13.2.25.4. Revenue
13.2.25.5. SWOT Analysis
13.2.25.6. Strategy
13.2.26. THERMAL ENGINEERING SYSTEMS
13.2.26.1. Basic Overview
13.2.26.2. Recent Developments
13.2.26.3. Geographical Presence
13.2.26.4. Revenue
13.2.26.5. SWOT Analysis
13.2.26.6. Strategy
13.2.27. Thermo Fisher Scientific
13.2.27.1. Basic Overview
13.2.27.2. Recent Developments
13.2.27.3. Geographical Presence
13.2.27.4. Revenue
13.2.27.5. SWOT Analysis
13.2.27.6. Strategy
13.2.28. Weil-McLain
13.2.28.1. Basic Overview
13.2.28.2. Recent Developments
13.2.28.3. Geographical Presence
13.2.28.4. Revenue
13.2.28.5. SWOT Analysis
13.2.28.6. Strategy
14. Key Takeaway0073
List of Tables
Table 01: Global Thermal Market Revenue (US$ Mn) Forecast, by Product, 2017–2027
Table 02: Global Thermal Market Volume (Thousand Units) Forecast, by Product, 2017–2027
Table 03: Global Thermal Market Revenue (US$ Mn) Forecast, by Product, by Liquid Cooling Systems, 2017–2027
Table 04: Global Thermal Market Volume (Thousand Units) Forecast, by Product, by Liquid Cooling Systems, 2017–2027
Table 05: Global Thermal Market Revenue (US$ Mn) Forecast, by Product, by Heating Equipment, 2017–2027
Table 06: Global Thermal Market Volume (Thousand units) Forecast, by Product, by Heating Equipment, 2017–2027
Table 07: Global Thermal Market Revenue (US$ Mn) Forecast, by Product, by Cooling Equipment, 2017–2027
Table 08: Global Thermal Market Size (Thousand Units) Forecast, by Product, by Cooling Equipment, 2017–2027
Table 09: Global Thermal Market Revenue (US$ Mn) Forecast, by Product, by Heat Transfer Component, 2017–2027
Table 10: Global Thermal Market Volume (Thousand Units) Forecast, by Product, by Heat Transfer Component, 2017–2027
Table 11: Global Thermal Market Revenue (US$ Mn) Forecast, by End-use Industry, 2017–2027
Table 12: Global Thermal Market Revenue Forecast, by Region, 2017–2027 (US$ Mn)
Table 13: Global Thermal Market Volume Forecast, by Region, 2017–2027 (Thousand Units)
Table 14: North America Thermal Market Revenue Forecast, by Product, 2017–2027 (US$ Mn)
Table 15: North America Thermal Market Volume Forecast, by Product, 2017–2027 (Thousand Units)
Table 16: North America Thermal Market Size Forecast, by Product, by Liquid Cooling Systems, 2017–2027 (US$ Mn)
Table 17: North America Thermal Market Volume Forecast, by Product, by Liquid Cooling Systems, 2017–2027 (Thousand Units)
Table 18: North America Thermal Market Size Forecast, by Product, by Heating Equipment, 2017–2027 (US$ Mn)
Table 19: North America Thermal Market Volume Forecast, by Product, by Heating Equipment, 2017–2027 (Thousand Units)
Table 20: North America Thermal Market Size Forecast, by Product, by Cooling Equipment, 2017–2027 (US$ Mn)
Table 21: North America Thermal Market Volume Forecast, by Product, by Cooling Equipment, 2017–2027 (Thousand Units)
Table 22: North America Thermal Market Size Forecast, by Product, by Heat Transfer Component, 2017–2027 (US$ Mn)
Table 23: North America Thermal Market Volume Forecast, by Product, by Heat Transfer Component, 2017–2027 (Thousand Units)
Table 24: North America Thermal Market Revenue Forecast, by End-use Industry, 2017–2027 (US$ Mn)
Table 25: North America Thermal Market Revenue Forecast, by Country/Sub-region, 2017–2027 (US$ Mn)
Table 26: North America Thermal Market Volume Forecast, by Country/Sub-region, 2017–2027 (Thousand Units)
Table 27: Europe Thermal Market Revenue Forecast, by Product, 2017–2027 (US$ Mn)
Table 28: Europe Thermal Market Volume Forecast, by Product, 2017–2027 (Thousand Units)
Table 29: Europe Thermal Market Size Forecast, by Product, by Liquid Cooling Systems, 2017–2027 (US$ Mn)
Table 30: Europe Thermal Market Volume Forecast, by Product, by Liquid Cooling Systems, 2017–2027 (Thousand Units)
Table 31: Europe Thermal Market Size Forecast, by Product, by Heating Equipment, 2017–2027 (US$ Mn)
Table 32: Europe Thermal Market Volume Forecast, by Product, by Heating Equipment, 2017–2027 (Thousand Units)
Table 33: Europe Thermal Market Size Forecast, by Product, by Cooling Equipment, 2017–2027 (US$ Mn)
Table 34: Europe Thermal Market Volume Forecast, by Product, by Cooling Equipment, 2017–2027 (Thousand Units)
Table 35: Europe Thermal Market Size Forecast, by Product, by Heat Transfer Component, 2017–2027 (US$ Mn)
Table 36: Europe Thermal Market Volume Forecast, by Product, by Heat Transfer Component, 2017–2027 (Thousand Units)
Table 37: Europe Thermal Market Revenue Forecast, by End-use Industry, 2017–2027 (US$ Mn)
Table 38: Europe Thermal Market Revenue Forecast, by Country/Sub-region, 2017–2027 (US$ Mn)
Table 39: Europe Thermal Market Volume Forecast, by Country/Sub-region, 2017–2027 (Thousand Units)
Table 40: Asia Pacific Thermal Market Revenue Forecast, by Product, 2017–2027 (US$ Mn)
Table 41: Asia Pacific Thermal Market Volume Forecast, by Product, 2017–2027 (Thousand Units)
Table 42: Asia Pacific Thermal Market Size Forecast, by Product, by Liquid Cooling Systems, 2017–2027 (US$ Mn)
Table 43: Asia Pacific Thermal Market Volume Forecast, by Product, by Liquid Cooling Systems, 2017–2027 (Thousand Units)
Table 44: Asia Pacific Thermal Market Size Forecast, by Product, by Heating Equipment, 2017–2027 (US$ Mn)
Table 45: Asia Pacific Thermal Market Volume Forecast, by Product, by Heating Equipment, 2017–2027 (Thousand Units)
Table 46: Asia Pacific Thermal Market Size Forecast, by Product, by Cooling Equipment, 2017–2027 (US$ Mn)
Table 47: Asia Pacific Thermal Market Volume Forecast, by Product, by Cooling Equipment, 2017–2027 (Thousand Units)
Table 48: Asia Pacific Thermal Market Size Forecast, by Product, by Heat Transfer Component, 2017–2027 (US$ Mn)
Table 49: Asia Pacific Thermal Market Volume Forecast, by Product, by Heat Transfer Component, 2017–2027 (Thousand Units)
Table 50: Asia Pacific Thermal Market Revenue Forecast, by End-use Industry, 2017–2027 (US$ Mn)
Table 51: Asia Pacific Thermal Market Revenue Forecast, by Country/Sub-region, 2017–2027 (US$ Mn)
Table 52: Asia Pacific Thermal Market Volume Forecast, by Country/Sub-region, 2017–2027 (Thousand Units)
Table 53: Middle East & Africa Thermal Market Revenue Forecast, by Product, 2017–2027 (US$ Mn)
Table 54: Middle East & Africa Thermal Market Volume Forecast, by Product, 2017–2027 (Thousand Units)
Table 55: Middle East & Africa Thermal Market Size Forecast, by Product, by Liquid Cooling Systems, 2017–2027 (US$ Mn)
Table 56: Middle East & Africa Thermal Market Volume Forecast, by Product, by Liquid Cooling Systems, 2017–2027 (Thousand Units)
Table 57: Middle East & Africa Thermal Market Size Forecast, by Product, by Heating Equipment, 2017–2027 (US$ Mn)
Table 58: Middle East & Africa Thermal Market Volume Forecast, by Product, by Heating Equipment, 2017–2027 (Thousand Units)
Table 59: Middle East & Africa Thermal Market Size Forecast, by Product, by Cooling Equipment, 2017–2027 (US$ Mn)
Table 60: Middle East & Africa Thermal Market Volume Forecast, by Product, by Cooling Equipment, 2017–2027 (Thousand Units)
Table 61: Middle East & Africa Thermal Market Size Forecast, by Product, by Heat Transfer Component, 2017–2027 (US$ Mn)
Table 62: Middle East & Africa Thermal Market Volume Forecast, by Product, by Heat Transfer Component, 2017–2027 (Thousand Units)
Table 63: Middle East & Africa Thermal Market Revenue Forecast, by End-use Industry, 2017–2027 (US$ Mn)
Table 64: Middle East & Africa Thermal Market Revenue Forecast, by Country/Sub-region, 2017–2027 (US$ Mn)
Table 65: Middle East & Africa Thermal Market Volume Forecast, by Country/Sub-region, 2017–2027 (Thousand Units)
Table 66: South America Thermal Market Revenue Forecast, by Product, 2017–2027 (US$ Mn)
Table 67: South America Thermal Market Volume Forecast, by Product, 2017–2027 (Thousand Units)
Table 68: South America Thermal Market Size Forecast, by Product, by Liquid Cooling Systems, 2017–2027 (US$ Mn)
Table 69: South America Thermal Market Volume Forecast, by Product, by Liquid Cooling Systems, 2017–2027 (Thousand Units)
Table 70: South America Thermal Market Size Forecast, by Product, by Heating Equipment, 2017–2027 (US$ Mn)
Table 71: South America Thermal Market Volume Forecast, by Product, by Heating Equipment, 2017–2027 (Thousand Units)
Table 72: South America Thermal Market Size Forecast, by Product, by Cooling Equipment, 2017–2027 (US$ Mn)
Table 73: South America Thermal Market Volume Forecast, by Product, by Cooling Equipment, 2017–2027 (Thousand Units)
Table 74: South America Thermal Market Size Forecast, by Product, by Heat Transfer Component, 2017–2027 (US$ Mn)
Table 75: South America Thermal Market Volume Forecast, by Product, by Heat Transfer Component, 2017–2027 (Thousand Units)
Table 76: South America Thermal Market Revenue Forecast, by End-use Industry, 2017–2027 (US$ Mn)
Table 77: South America Thermal Market Revenue Forecast, by Country/Sub-region, 2017–2027 (US$ Mn)
Table 78: South America Thermal Market Volume Forecast, by Country/Sub-region, 2017–2027 (Thousand Units)
List of Figures
Figure 01: North America Thermal Market CAGR
Figure 02: Europe Thermal Market CAGR
Figure 03: Asia Pacific Thermal Market CAGR
Figure 04: Middle East & Africa Thermal Market CAGR
Figure 05: South America Thermal Market CAGR
Figure 06: Global Thermal Market Revenue Projection, 2017–2027 (US$ Mn)
Figure 07: Global Thermal Market Volume Projection, 2017–2027 (Thousand Units)
Figure 08: Global Thermal Market, by Product (2019)
Figure 09: Global Thermal Market, by Region (2019)
Figure 10: Global Thermal Market, by End-use Industry (2019)
Figure 11: Global Thermal Market Value Share Analysis, by Product, 2019 and 2027
Figure 12: Global Thermal Market, by Product, Liquid Cooling Systems
Figure 13: Global Thermal Market, by Product, Thermoelectric
Figure 14: Global Thermal Market, by Product, Heat Sinks
Figure 15: Global Thermal Market, by Product, Compressors
Figure 16: Global Thermal Market, by Product, Heating Equipment
Figure 17: Global Thermal Market, by Product, Cooling Equipment
Figure 18: Global Thermal Market, by Product, Thermal Interface Materials
Figure 19: Global Thermal Market, by Product, Heat Transfer Component
Figure 20: Segment Growth Matrix, 2019–27 (%)
Figure 21: Segment Revenue Contribution, 2019–27 (%)
Figure 22: Segment Compounded Growth Matrix (CAGR %)
Figure 23: Global Thermal Market Attractiveness Analysis, by Product
Figure 24: Global Thermal Market Value Share Analysis, by End-use Industry, 2019 and 2027
Figure 25: Global Thermal Market, by End-use Industry, Aerospace & Defense
Figure 26: Global Thermal Market, by End-use Industry, Automotive
Figure 27: Global Thermal Market, by End-use Industry, Chemicals & Petrochemicals
Figure 28: Global Thermal Market, by End-use Industry, Consumer Electronics
Figure 29: Global Thermal Market, by End-use Industry, Energy & Utilities
Figure 30: Global Thermal Market, by End-use Industry, Food & Beverages
Figure 31: Global Thermal Market, by End-use Industry, Healthcare
Figure 32: Global Thermal Market, by End-use Industry, Heavy Metals & Machine Manufacturing
Figure 33: Global Thermal Market, by End-use Industry, IT & Telecommunications
Figure 34: Global Thermal Market, by End-use Industry, Oil & Gas
Figure 35: Global Thermal Market, by End-use Industry, Paper & Pulp
Figure 36: Global Thermal Market, by End-use Industry, Semiconductor & Electronics
Figure 37: Global Thermal Market, by End-use Industry, Others
Figure 38: Segment Growth Matrix, 2019–27 (%)
Figure 39: Segment Revenue Contribution, 2019–27 (%)
Figure 40: Segment Compounded Growth Matrix (CAGR %)
Figure 41: Global Thermal Market Attractiveness Analysis, by End-use Industry
Figure 42: Global Thermal Market, by Region, North America
Figure 43: Global Thermal Market, by Region, Europe
Figure 44: Global Thermal Market, by Region, Asia Pacific
Figure 45: Global Thermal Market, by Region, Middle East & Africa
Figure 46: Global Thermal Market, by Region, South America
Figure 47: Global Thermal Market Attractiveness Analysis, by Region
Figure 48: North America Thermal Market Revenue (US$ Mn) Forecast, 2017–2027
Figure 49: North America Thermal Market Volume (Thousand Units) Forecast, 2017–2027
Figure 50: North America Thermal Market Value Share Analysis, by Product, 2019 and 2027
Figure 51: North America Thermal Market Value Share Analysis, by End-use Industry, 2019 and 2027
Figure 52: North America Thermal Market Value Share Analysis, by Country/Sub-region, 2019 and 2027
Figure 53: North America Thermal Market Attractiveness Analysis, by Product
Figure 54: North America Thermal Market Attractiveness Analysis, by End-use Industry
Figure 55: North America Thermal Market Attractiveness Analysis, by Country/Sub-region
Figure 56: Europe Thermal Market Revenue (US$ Mn) Forecast, 2017–2027
Figure 57: Europe Thermal Market Volume (Thousand Units) Forecast, 2017–2027
Figure 58: Europe Thermal Market Value Share Analysis, by Product, 2019 and 2027
Figure 59: Europe Thermal Market Value Share Analysis, by End-use Industry, 2019 and 2027
Figure 60: Europe Thermal Market Value Share Analysis, by Country/Sub-region, 2019 and 2027
Figure 61: Europe Thermal Market Attractiveness Analysis, by Product
Figure 62: Europe Thermal Market Attractiveness Analysis, by End-use Industry
Figure 63: Europe Thermal Market Attractiveness Analysis, by Country/Sub-region
Figure 64: Asia Pacific Thermal Market Revenue (US$ Mn) Forecast, 2017–2027
Figure 65: Asia Pacific Thermal Market Volume (Thousand Units) Forecast, 2017–2027
Figure 66: Asia Pacific Thermal Market Value Share Analysis, by Product, 2019 and 2027
Figure 67: Asia Pacific Thermal Market Value Share Analysis, by End-use Industry, 2019 and 2027
Figure 68: Asia Pacific Thermal Market Value Share Analysis, by Country/Sub-region, 2019 and 2027
Figure 69: Asia Pacific Thermal Market Attractiveness Analysis, by Product
Figure 70: Asia Pacific Thermal Market Attractiveness Analysis, by End-use Industry
Figure 71: Asia Pacific Thermal Market Attractiveness Analysis, by Country/Sub-region
Figure 72: Middle East & Africa Thermal Market Revenue (US$ Mn) Forecast, 2017–2027
Figure 73: Middle East & Africa Thermal Market Volume (Thousand Units) Forecast, 2017–2027
Figure 74: Middle East & Africa Thermal Market Value Share Analysis, by Product, 2019 and 2027
Figure 75: Middle East & Africa Thermal Market Value Share Analysis, by End-use Industry, 2019 and 2027
Figure 76: Middle East & Africa Thermal Market Value Share Analysis, by Country/Sub-region, 2019 and 2027
Figure 77: Middle East & Africa Thermal Market Attractiveness Analysis, by Product
Figure 78: Middle East & Africa Thermal Market Attractiveness Analysis, by End-use Industry
Figure 79: Middle East & Africa Thermal Market Attractiveness Analysis, by Country/Sub-region
Figure 80: South America Thermal Market Revenue (US$ Mn) Forecast, 2017–2027
Figure 81: South America Thermal Market Volume (Thousand Units) Forecast, 2017–2027
Figure 82: South America Thermal Market Value Share Analysis, by Product, 2019 and 2027
Figure 83: South America Thermal Market Value Share Analysis, by End-use Industry, 2019 and 2027
Figure 84: South America Thermal Market Value Share Analysis, by Country/Sub-region, 2019 and 2027
Figure 85: South America Thermal Market Attractiveness Analysis, by Product
Figure 86: South America Thermal Market Attractiveness Analysis, by End-use Industry
Figure 87: South America Thermal Market Attractiveness Analysis, by Country/Sub-region
Figure 88: Global Thermal Market Share Analysis, by Company (2018)
Copyright © Transparency Market Research, Inc. All Rights reserved
Trust Online

Thermal Market