
Reports
Reports
Global Technical Illustration Software Market – Snapshot
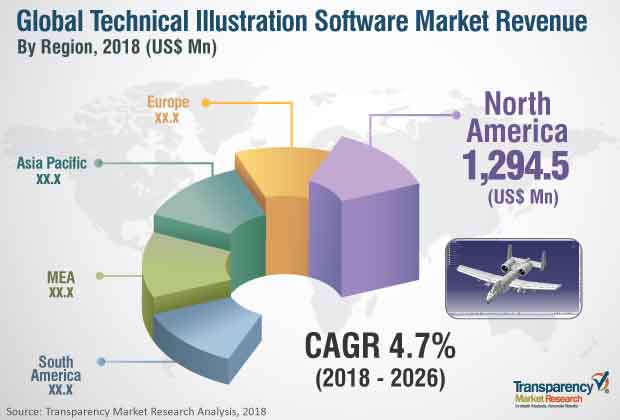
The global technical illustration software market is expected to reach US$4,935.7 Mn by 2026, expanding at a CAGR of 4.7% from 2018 to 2026. North America held a prominent share of the technical illustration software market in 2017 and is projected to be at the forefront of global demand. The market in the region is expected to expand at a significant CAGR OF 4.4% during the forecast period, 2018-2026.
Technical illustration software is used for design and illustration purposes. The software helps designers to draw 2D as well as 3D designs. Technical illustration software is a part of Product Lifecycle Management (PLM). Vendors operating in this market either provide standalone illustration software or offer illustration software as a part of CAD and PLM software. Technical illustration software help designers and illustrators to efficiently draw and design products for prototyping purposes.
The technical illustration software market is segmented on the basis of component, technology, and end-user. Based on component, the market is divided into software and services. In 2017, software occupied the largest share in the overall market. Illustration software is easy to use and deploy; therefore, services like support/training and maintenance are usually required with specific software. This in turn means that vendors operating in this market earn revenue largely from software sales or software subscription. The software segment is further bifurcated into on premise and cloud based. In 2017, on premise technical illustration software occupied the largest share in the market. However, it is expected that during the forecast period, cloud-based deployment model will gain traction among end-users. On the basis of services, the market is categorized into implementation, support & maintenance, and consulting services. In 2017, support & maintenance services occupied the largest share. Some illustration software requires support services, particularly training. Booklets and guide materials are provided by illustration software vendors to help designers and illustrators.
In terms of technology, the technical illustration software market is categorized into 2D and 3D technology. In 2017, 3D based technology occupied the largest share in the overall market. 3D based technology is expected to continue its dominance during the forecast period as well. The reason for the same is growing demand for 3D based illustration among designers and illustrators across the globe.
Based on end-user, the market is divided into aerospace and defense, healthcare, energy & power, manufacturing, automotive, transportation, and others. The others subsegment includes media and entertainment and third party technical illustration service providers. In 2017, manufacturing and automotive were the largest end-user segments in the technical illustration software market.
On the basis of region, the market is divided into North America, Europe, AsiaPacific, South America and Middle East & Africa. In 2017, North America was the largest market for technical illustration software. Europe and Asia Pacific are expected to witness significant growth during the forecast period due to new project initiations every year, particularly in the manufacturing and automotive sector. Moreover, many independent illustrators and designers are working as freelancers in these regions, giving a further push to the market.
Major players operating in the global technical illustration software market include Autodesk Inc. Dassault Systemes , PTC Inc., Canvas GFX, Inc., Corel Corporation, Siemens Product Lifecycle Management Software Inc., QuadriSpace Corporation, Auto-Trol Technology Corporation, and Cyient. These players are focusing on acquisitions and new strategic collaborations in order to increase their market share in the global technical illustration software market.
Technical Upgrades and Ease of Conveying Complex Information to Non-Technical Audience will sow the Seeds of Growth across the Technical Illustration Software Market
1. Preface
1.1. Market Scope
1.2. Market Segmentation
1.3. Key Research Objectives
2. Assumptions and Research Methodology
2.1. Market Taxonomy - Segment Definitions
2.2. Research Methodology
2.2.1. List of Primary and Secondary Sources
2.3. Key Assumptions for Data Modelling
3. Executive Summary : Global Technical Illustration Software Market
4. Market Overview
4.1. Introduction
4.2. Global Market – Macro Economic Factors Overview
4.2.1. World GDP Indicator – For Top 20 Economies
4.2.2. Global ICT Spending (US$ Mn), 2012, 2018, 2026
4.2.3. Key Regional Socio-Political-Technological Developments and Their Impact Considerations
4.3. Technology/Product Roadmap
4.4. Market Factor Analysis
4.4.1. Porter’s Five Forces Analysis
4.4.2. PESTEL Analysis
4.4.3. Ecosystem Analysis
4.5. Market Dynamics (Growth Influencers)
4.5.1. Drivers
4.5.2. Restraints
4.5.3. Opportunities
4.5.4. Impact Analysis of Drivers & Restraints
4.6. Technical Illustration Software Market Analysis, By Operating System
4.6.1. Windows
4.6.2. MAC
4.6.3. IOS
4.6.4. Android
4.7. Pricing Model
4.7.1. Subscription
4.7.2. License
4.8. Global Technical Illustration Software Market Analysis and Forecast, 2012 - 2026
4.8.1. Market Revenue Analysis (US$ Mn)
4.8.1.1. Historic Growth Trends, 2012-2017
4.8.1.2. Forecast Trends, 2018-2026
4.9. Market Attractiveness Analysis – By Region/Country (Global/North America/Europe/Asia Pacific/Middle East & Africa/South America)
4.9.1. By Region/Country
4.9.2. By Component
4.9.3. By Technology
4.9.4. By End-user
4.10. Market Outlook
4.11. Competitive Scenario and Trends
4.11.1. Technical Illustration Software Market Concentration Rate
4.11.1.1. List of New Entrants
4.11.2. Mergers & Acquisitions, Expansions
5. Global Technical Illustration Software Market Analysis and Forecast, By Component
5.1. Overview & Definitions
5.2. Key Segment Analysis
5.3. Technical Illustration Software Market Size (US$ Mn) Forecast, By Component, 2016 - 2026
5.3.1. Software
5.3.1.1. On-premise
5.3.1.2. Cloud
5.3.2. Services
5.3.2.1. Implementation
5.3.2.2. Support & Maintenance
5.3.2.3. Consulting
6. Global Technical Illustration Software Market Analysis and Forecast, By Technology
6.1. Overview & Definitions
6.2. Key Segment Analysis
6.3. Technical Illustration Software Market Size (US$ Mn) Forecast, By Technology, 2016 - 2026
6.3.1. 2D
6.3.2. 3D
7. Global Technical Illustration Software Market Analysis and Forecast, By End-user
7.1. Overview & Definitions
7.2. Key Segment Analysis
7.3. Technical Illustration Software Market Size (US$ Mn) Forecast, By End-user, 2016 - 2026
7.3.1. Aerospace and Defense
7.3.2. Healthcare
7.3.3. Energy & power
7.3.4. Manufacturing
7.3.5. Automotive
7.3.6. Transportation
7.3.7. Others
8. Global Technical Illustration Software Market Analysis and Forecast, By Region
8.1. Overview
8.2. Key Segment Analysis
8.3. Technical Illustration Software Market Size (US$ Mn) Forecast, by Region, 2016 - 2026
8.3.1. North America
8.3.2. Europe
8.3.3. Asia Pacific
8.3.4. Middle East & Africa
8.3.5. South America
9. North America Technical Illustration Software Market Analysis and Forecast
9.1. Key Findings
9.2. Impact Analysis of Drivers and Restraint
9.3. Technical Illustration Software Market Size (US$ Mn) Forecast, By Component, 2016 - 2026
9.3.1. Software
9.3.1.1. On-premise
9.3.1.2. Cloud
9.3.2. Services
9.3.2.1. Implementation
9.3.2.2. Support & Maintenance
9.3.2.3. Consulting
9.4. Technical Illustration Software Market Size (US$ Mn) Forecast, By Technology, 2016 - 2026
9.4.1. 2D
9.4.2. 3D
9.5. Technical Illustration Software Market Size (US$ Mn) Forecast, By End-user, 2016 - 2026
9.5.1. Aerospace and Defense
9.5.2. Healthcare
9.5.3. Energy & power
9.5.4. Manufacturing
9.5.5. Automotive
9.5.6. Transportation
9.5.7. Others
9.6. Technical Illustration Software Market Size (US$ Mn) Forecast, By Country, 2016 - 2026
9.6.1. The U.S.
9.6.2. Canada
9.6.3. Rest of North America
10. Europe Technical Illustration Software Market Analysis and Forecast
10.1. Key Findings
10.2. Impact Analysis of Drivers and Restraint
10.3. Technical Illustration Software Market Size (US$ Mn) Forecast, By Component, 2016 - 2026
10.3.1. Software
10.3.1.1. On-premise
10.3.1.2. Cloud
10.3.2. Services
10.3.2.1. Implementation
10.3.2.2. Support & Maintenance
10.3.2.3. Consulting
10.4. Technical Illustration Software Market Size (US$ Mn) Forecast, By Technology, 2016 - 2026
10.4.1. 2D
10.4.2. 3D
10.5. Technical Illustration Software Market Size (US$ Mn) Forecast, By End-user, 2016 - 2026
10.5.1. Aerospace and Defense
10.5.2. Healthcare
10.5.3. Energy & power
10.5.4. Manufacturing
10.5.5. Automotive
10.5.6. Transportation
10.5.7. Others
10.6. Technical Illustration Software Market Size (US$ Mn) Forecast, By Country, 2016 - 2026
10.6.1. Germany
10.6.2. France
10.6.3. UK
10.6.4. Rest of Europe
11. Asia Pacific Technical Illustration Software Market Analysis and Forecast
11.1. Key Findings
11.2. Impact Analysis of Drivers and Restraint
11.3. Technical Illustration Software Market Size (US$ Mn) Forecast, By Component, 2016 - 2026
11.3.1. Software
11.3.1.1. On-premise
11.3.1.2. Cloud
11.3.2. Services
11.3.2.1. Implementation
11.3.2.2. Support & Maintenance
11.3.2.3. Consulting
11.4. Technical Illustration Software Market Size (US$ Mn) Forecast, By Technology, 2016 - 2026
11.4.1. 2D
11.4.2. 3D
11.5. Technical Illustration Software Market Size (US$ Mn) Forecast, By End-user, 2016 - 2026
11.5.1. Aerospace and Defense
11.5.2. Healthcare
11.5.3. Energy & power
11.5.4. Manufacturing
11.5.5. Automotive
11.5.6. Transportation
11.5.7. Others
11.6. Technical Illustration Software Market Size (US$ Mn) Forecast, By Country, 2016 - 2026
11.6.1. China
11.6.2. Japan
11.6.3. India
11.6.4. Rest of Asia Pacific
12. Middle East & Africa (MEA) Technical Illustration Software Market Analysis and Forecast
12.1. Key Findings
12.2. Impact Analysis of Drivers and Restraint
12.3. Technical Illustration Software Market Size (US$ Mn) Forecast, By Component, 2016 - 2026
12.3.1. Software
12.3.1.1. On-premise
12.3.1.2. Cloud
12.3.2. Services
12.3.2.1. Implementation
12.3.2.2. Support & Maintenance
12.3.2.3. Consulting
12.4. Technical Illustration Software Market Size (US$ Mn) Forecast, By Technology, 2016 - 2026
12.4.1. 2D
12.4.2. 3D
12.5. Technical Illustration Software Market Size (US$ Mn) Forecast, By End-user, 2016 - 2026
12.5.1. Aerospace and Defense
12.5.2. Healthcare
12.5.3. Energy & power
12.5.4. Manufacturing
12.5.5. Automotive
12.5.6. Transportation
12.5.7. Others
12.6. Technical Illustration Software Market Size (US$ Mn) Forecast, By Country, 2016 - 2026
12.6.1. GCC
12.6.2. South Africa
12.6.3. Rest of MEA
13. South America Technical Illustration Software Market Analysis and Forecast
13.1. Key Findings
13.2. Impact Analysis of Drivers and Restraint
13.3. Technical Illustration Software Market Size (US$ Mn) Forecast, By Component, 2016 - 2026
13.3.1. Software
13.3.1.1. On-premise
13.3.1.2. Cloud
13.3.2. Services
13.3.2.1. Implementation
13.3.2.2. Support & Maintenance
13.3.2.3. Consulting
13.4. Technical Illustration Software Market Size (US$ Mn) Forecast, By Technology, 2016 - 2026
13.4.1. 2D
13.4.2. 3D
13.5. Technical Illustration Software Market Size (US$ Mn) Forecast, By End-user, 2016 - 2026
13.5.1. Aerospace and Defense
13.5.2. Healthcare
13.5.3. Energy & power
13.5.4. Manufacturing
13.5.5. Automotive
13.5.6. Transportation
13.5.7. Others
13.6. Technical Illustration Software Market Size (US$ Mn) Forecast, By Country, 2016 - 2026
13.6.1. Brazil
13.6.2. Rest of South America
14. Competition Landscape
14.1. Market Player – Competition Matrix
14.2. Market Share Analysis (2017)
15. Company Profiles (Details – Business Overview, Key Competitors, Sales Area/Geographical Presence, Revenue and Strategy)
15.1. Adobe
15.1.1. Basic Overview
15.1.2. Sales Area/Geographical Presence
15.1.3. Revenue
15.1.4. SWOT Analysis
15.1.5. Strategy
15.2. Autodesk Inc.
15.2.1. Basic Overview
15.2.2. Sales Area/Geographical Presence
15.2.3. Revenue
15.2.4. SWOT Analysis
15.2.5. Strategy
15.3. Auto-Trol
15.3.1. Basic Overview
15.3.2. Sales Area/Geographical Presence
15.3.3. Revenue
15.3.4. SWOT Analysis
15.3.5. Strategy
15.4. Canvas GFX, Inc.
15.4.1. Basic Overview
15.4.2. Sales Area/Geographical Presence
15.4.3. Revenue
15.4.4. SWOT Analysis
15.4.5. Strategy
15.5. Corel Corporation
15.5.1. Basic Overview
15.5.2. Sales Area/Geographical Presence
15.5.3. Revenue
15.5.4. SWOT Analysis
15.5.5. Strategy
15.6. Cyient
15.6.1. Basic Overview
15.6.2. Sales Area/Geographical Presence
15.6.3. Revenue
15.6.4. SWOT Analysis
15.6.5. Strategy
15.7. Dassault Systèmes
15.7.1. Basic Overview
15.7.2. Sales Area/Geographical Presence
15.7.3. Revenue
15.7.4. SWOT Analysis
15.7.5. Strategy
15.8. PTC
15.8.1. Basic Overview
15.8.2. Sales Area/Geographical Presence
15.8.3. Revenue
15.8.4. SWOT Analysis
15.8.5. Strategy
15.9. Siemens Product Lifecycle Management Software Inc.
15.9.1. Basic Overview
15.9.2. Sales Area/Geographical Presence
15.9.3. Revenue
15.9.4. SWOT Analysis
15.9.5. Strategy
15.10. Serif Ltd
15.10.1. Basic Overview
15.10.2. Sales Area/Geographical Presence
15.10.3. Revenue
15.10.4. SWOT Analysis
15.10.5. Strategy
15.11. QuadriSpace Corporation
15.11.1. Basic Overview
15.11.2. Sales Area/Geographical Presence
15.11.3. Revenue
15.11.4. SWOT Analysis
15.11.5. Strategy
16. Key Takeaways
List of Tables
Table 1: Technical Illustration Software Market Revenue (US$ Mn) Forecast, by Component, 2016 - 2026
Table 2: Global Technical Illustration Software Market Revenue (US$ Mn) Forecast, by Software, 2016 - 2026
Table 3: Global Technical Illustration Software Market Revenue (US$ Mn) Forecast, by Services, 2016 - 2026
Table 4: Global Technical Illustration Software Market Revenue (US$ Mn) Forecast, by End-user, 2016 - 2026
Table 5: Global Technical Illustration Software Market Revenue (US$ Mn) Forecast, by Technology, 2016 - 2026
Table 6: Global Technical Illustration Software Market Revenue (US$ Mn) Forecast, by Region, 2016 - 2026
Table 7: North America Technical Illustration Software Market Revenue (US$ Mn) Forecast, by Component, 2016 - 2026
Table 8: North America Technical Illustration Software Market Revenue (US$ Mn) Forecast, by Software, 2016 - 2026
Table 9: North America Technical Illustration Software Market Revenue (US$ Mn) Forecast, by Services, 2016 - 2026
Table 10: North America Technical Illustration Software Market Revenue (US$ Mn) Forecast, by End-user, 2016 - 2026
Table 11: North America Technical Illustration Software Market Revenue (US$ Mn) Forecast, by Technology, 2016 - 2026
Table 12: North America Technical Illustration Software Market Revenue (US$ Mn) Forecast, by Country, 2016 - 2026
Table 13: Europe Technical Illustration Software Market Revenue (US$ Mn) Forecast, by Component, 2016 - 2026
Table 14: Europe Technical Illustration Software Market Revenue (US$ Mn) Forecast, by Software, 2016 - 2026
Table 15: Europe Technical Illustration Software Market Revenue (US$ Mn) Forecast, by Services, 2016 - 2026
Table 16: Europe Technical Illustration Software Market Revenue (US$ Mn) Forecast, by End-user, 2016 - 2026
Table 17: Europe Technical Illustration Software Market Revenue (US$ Mn) Forecast, by Technology, 2016 - 2026
Table 18: Europe Technical Illustration Software Market Revenue (US$ Mn) Forecast, by Country, 2016 - 2026
Table 19: Asia Pacific Technical Illustration Software Market Revenue (US$ Mn) Forecast, by Component, 2016 - 2026
Table 20: Asia Pacific Technical Illustration Software Market Revenue (US$ Mn) Forecast, by Software, 2016 - 2026
Table 21: Asia Pacific Technical Illustration Software Market Revenue (US$ Mn) Forecast, by Services, 2016 - 2026
Table 22: Asia Pacific Technical Illustration Software Market Revenue (US$ Mn) Forecast, by End-user, 2016 - 2026
Table 23: Asia Pacific Technical Illustration Software Market Revenue (US$ Mn) Forecast, by Technology, 2016 - 2026
Table 24: Asia Pacific Technical Illustration Software Market Revenue (US$ Mn) Forecast, by Country, 2016 - 2026
Table 25: Middle East & Africa Technical Illustration Software Market Revenue (US$ Mn) Forecast, by Component, 2016 - 2026
Table 26: Middle East & Africa Technical Illustration Software Market Revenue (US$ Mn) Forecast, by Software, 2016 - 2026
Table 27: Middle East & Africa Technical Illustration Software Market Revenue (US$ Mn) Forecast, by Services, 2016 - 2026
Table 28: Middle East & Africa Technical Illustration Software Market Revenue (US$ Mn) Forecast, by End-user, 2016 - 2026
Table 29: Middle East & Africa Technical Illustration Software Market Revenue (US$ Mn) Forecast, by Technology, 2016 - 2026
Table 30: Middle East & Africa Technical Illustration Software Market Revenue (US$ Mn) Forecast, by Country, 2016 - 2026
Table 31: South America Technical Illustration Software Market Revenue (US$ Mn) Forecast, by Component, 2016 - 2026
Table 32: South America Technical Illustration Software Market Revenue (US$ Mn) Forecast, by Software, 2016 - 2026
Table 33: South America Technical Illustration Software Market Revenue (US$ Mn) Forecast, by Services, 2016 - 2026
Table 34: South America Technical Illustration Software Market Revenue (US$ Mn) Forecast, by End-user, 2016 - 2026
Table 35: South America Technical Illustration Software Market Revenue (US$ Mn) Forecast, by Technology, 2016 - 2026
Table 36: South America Technical Illustration Software Market Revenue (US$ Mn) Forecast, by Country, 2016 - 2026
List of Figures
Figure 1: Global Technical Illustration Software Size (US$ Mn) Forecast, 2016–2026
Figure 2: Global CAGR Analysis
Figure 3: Technical Illustration Software Market, Regional Outline
Figure 4: Technical Illustration Software Market, Top Segment Analysis
Figure 5: North America Market growth
Figure 6: North America Technical Illustration Software Share Analysis, by Component, 2017
Figure 7: North America Technical Illustration Software Share Analysis, by Technology, 2017
Figure 8: North America Technical Illustration Software Share Analysis, by End-user, 2017
Figure 9: Europe Market growth
Figure 10: Europe Technical Illustration Software Share Analysis, by Component, 2017
Figure 11: Europe Technical Illustration Software Share Analysis, by Technology, 2017
Figure 12: Europe Technical Illustration Software Share Analysis, by End-user, 2017
Figure 13: Asia-Pacific Market growth
Figure 14: APAC Technical Illustration Software Share Analysis, by Technology, 2017
Figure 15: APAC Technical Illustration Software Share Analysis, by Component, 2017
Figure 16: APAC Technical Illustration Software Share Analysis, by End-user, 2017
Figure 17: South America Market growth
Figure 18: South America Technical Illustration Software Share Analysis, by Technology, 2017
Figure 19: South America Technical Illustration Software Share Analysis, by Component, 2017
Figure 20: South America Technical Illustration Software Share Analysis, by End-user, 2017
Figure 21: MEA Market growth
Figure 22: MEA Technical Illustration Software Share Analysis, by Technology, 2017
Figure 23: MEA Technical Illustration Software Share Analysis, by Component, 2017
Figure 24: MEA Technical Illustration Software Share Analysis, by End-user, 2017
Figure 25: Technology/Product Roadmap
Figure 26: Ecosystem Analysis
Figure 27: Mobile Penetration (2017), by Population
Figure 28: Drivers and Restraint Impact Analysis
Figure 29: Global Technical Illustration Software Market Revenue Forecast, 2012 –2017 (US$ Mn)
Figure 30: Global Technical Illustration Software Market Y-o-Y Growth (%), 2013 –2017
Figure 31: Global Technical Illustration Software Market Revenue Forecast, 2016 –2026 (US$ Mn)
Figure 32: Global Technical Illustration Software Market Y-o-Y Growth (%), 2017 –2026
Figure 33: Top Technical Illustration Software, by Operating System
Figure 34: Top Technical Illustration Software, by Operating System
Figure 35: Worldwide Desktop Operating System Market Share, 2016 (%)
Figure 36: Worldwide Desktop Operating System Users, 2017 (%)
Figure 37: Overall Revenue Share Analysis, by Pricing Model
Figure 38: Global Average Selling Price (ASP) of Technical Illustration Software
Figure 39: Global Technical Illustration Software Market Attractiveness Analysis, by Component, by Software
Figure 40: Global Technical Illustration Software Market Parameter for Attractiveness Analysis, by Component, by Software
Figure 41: Global Technical Illustration Software Market Attractiveness Analysis, by End-user
Figure 42: Global Technical Illustration Software Market Parameter for Attractiveness Analysis, by End-user
Figure 43: Global Technical Illustration Software Market Attractiveness Analysis, by Technology
Figure 44: Global Technical Illustration Software Market Parameter for Attractiveness Analysis, by Technology
Figure 45: Global Technical Illustration Software Market Attractiveness Analysis, by Region
Figure 46: Global Technical Illustration Software Market Parameter for Attractiveness Analysis, by Region
Figure 47: North America Technical Illustration Software Market Attractiveness Analysis, by Component, by Software
Figure 48: North America Technical Illustration Software Market Parameter for Attractiveness Analysis, by Component, by Software
Figure 49: North America Technical Illustration Software Market Attractiveness Analysis, by Technology
Figure 50: North America Technical Illustration Software Market Parameter for Attractiveness Analysis, by Technology
Figure 51: North America Technical Illustration Software Market Attractiveness Analysis, by End-user
Figure 52: North America Technical Illustration Software Market Parameter for Attractiveness Analysis, by End-user
Figure 53: North America Technical Illustration Software Market Attractiveness Analysis, by Country
Figure 54: North America Technical Illustration Software Market Parameter for Attractiveness Analysis, by Country
Figure 55: Europe Technical Illustration Software Market Attractiveness Analysis, by Component, by Software
Figure 56: Europe Technical Illustration Software Market Parameter for Attractiveness Analysis, by Component, by Software
Figure 57: Europe Technical Illustration Software Market Attractiveness Analysis, by Technology
Figure 58: Europe Technical Illustration Software Market Parameter for Attractiveness Analysis, by Technology
Figure 59: Europe Technical Illustration Software Market Attractiveness Analysis, by End-user
Figure 60: Europe Technical Illustration Software Market Parameter for Attractiveness Analysis, by End-user
Figure 61: Europe Technical Illustration Software Market Parameter for Attractiveness Analysis, by Country
Figure 62: Europe Technical Illustration Software Market Parameter for Attractiveness Analysis, by Country
Figure 63: Asia Pacific Technical Illustration Software Market Attractiveness Analysis, by Component, by Software
Figure 64: Asia Pacific Technical Illustration Software Market Parameter for Attractiveness Analysis, by Component, by Software
Figure 65: Asia Pacific Technical Illustration Software Market Attractiveness Analysis, by Technology
Figure 66: Asia Pacific Technical Illustration Software Market Parameter for Attractiveness Analysis, by Technology
Figure 67: Asia Pacific Technical Illustration Software Market Attractiveness Analysis, by End-user
Figure 68: Asia Pacific Technical Illustration Software Market Parameter for Attractiveness Analysis, by End-user
Figure 69: Asia Pacific Technical Illustration Software Market Attractiveness Analysis, by Country
Figure 70: Asia Pacific Technical Illustration Software Market Parameter for Attractiveness Analysis, by Country
Figure 71: Middle East & Africa Technical Illustration Software Market Attractiveness Analysis, by Component, by Software
Figure 72: Middle East & Africa Technical Illustration Software Market Parameter for Attractiveness Analysis, by Component, by Software
Figure 73: Middle East & Africa Technical Illustration Software Market Attractiveness Analysis, by Technology
Figure 74: Middle East & Africa Technical Illustration Software Market Parameter for Attractiveness Analysis, by Technology
Figure 75: Middle East & Africa Technical Illustration Software Market Attractiveness Analysis, by End-user
Figure 76: Middle East & Africa Technical Illustration Software Market Parameter for Attractiveness Analysis, by End-user
Figure 77: Middle East & Africa Technical Illustration Software Market Attractiveness Analysis, by Country
Figure 78: Middle East & Africa Technical Illustration Software Market Parameter for Attractiveness Analysis, by Country
Figure 79: South America Technical Illustration Software Market Attractiveness Analysis, by Component, by Software
Figure 80: South America Technical Illustration Software Market Parameter for Attractiveness Analysis, by Component, by Software
Figure 81: South America Technical Illustration Software Market Attractiveness Analysis, by Technology
Figure 82: South America Technical Illustration Software Market Parameter for Attractiveness Analysis, by Technology
Figure 83: South America Technical Illustration Software Market Attractiveness Analysis, by End-user
Figure 84: South America Technical Illustration Software Market Parameter for Attractiveness Analysis, by End-user
Figure 85: South America Technical Illustration Software Market Attractiveness Analysis, by Country
Figure 86: South America Technical Illustration Software Market Parameter for Attractiveness Analysis, by Country
Figure 87: Global Technical Illustration Software Market CAGR (%), by Software (2018 – 2026)
Figure 88: Global Technical Illustration Software Market CAGR (%), by Technology (2018 – 2026)
Figure 89: Global Technical Illustration Software Market CAGR (%), by Services (2018 – 2026)
Figure 90: Global Technical Illustration Software Market CAGR (%), by End-user (2018 – 2026)
Figure 91: Global Technical Illustration Software Market Value Share, by Component (2018)
Figure 92: Global Technical Illustration Software Market Value Share, by Component (2026)
Figure 93: Global Technical Illustration Software Market Value Share, by End-user (2018)
Figure 94: Global Technical Illustration Software Market Value Share, by End-user (2026)
Figure 95: Global Technical Illustration Software Market Value Share, by Technology (2018)
Figure 96: Global Technical Illustration Software Market Value Share, by Technology (2026)
Figure 97: Global Technical Illustration Software Market Value Share Analysis, by Region, 2018 and 2026
Figure 98: North America Technical Illustration Software Market Revenue (US$ Mn) and Y-o-Y Forecast, 2018 – 2026
Figure 99: North America Technical Illustration Software Market Opportunity Growth Analysis (US$ Mn), 2016 – 2026
Figure 100: North America Technical Illustration Software Market Value Share, by Component (2018)
Figure 101: North America Technical Illustration Software Market Value Share, by Component (2026)
Figure 102: North America Technical Illustration Software Market Value Share, by End-user (2018)
Figure 103: North America Technical Illustration Software Market Value Share, by End-user (2026)
Figure 104: North America Technical Illustration Software Market Value Share, by Technology (2018)
Figure 105: North America Technical Illustration Software Market Value Share, by Technology (2026)
Figure 106: North America Technical Illustration Software Market Value Share, by Country (2018)
Figure 107: North America Technical Illustration Software Market Value Share, by Country (2026)
Figure 108: Europe Technical Illustration Software Market Revenue (US$ Mn) and Y-o-Y Forecast, 2018 – 2026
Figure 109: Europe Technical Illustration Software Market Opportunity Growth Analysis (US$ Mn), 2016 – 2026
Figure 110: Europe Technical Illustration Software Market Value Share, by Component (2018)
Figure 111: Europe Technical Illustration Software Market Value Share, by Component (2026)
Figure 112: Europe Technical Illustration Software Market Value Share, by End-user (2018)
Figure 113: Europe Technical Illustration Software Market Value Share, by End-user (2026)
Figure 114: Europe Technical Illustration Software Market Value Share, by Technology (2018)
Figure 115: Europe Technical Illustration Software Market Value Share, by Technology (2026)
Figure 116: Europe Technical Illustration Software Market Value Share, by Country (2018)
Figure 117: Europe Technical Illustration Software Market Value Share, by Country (2026)
Figure 118: Asia Pacific Technical Illustration Software Market Revenue (US$ Mn) and Y-o-Y Forecast, 2018 – 2026
Figure 119: Asia Pacific Technical Illustration Software Market Opportunity Growth Analysis (US$ Mn), 2016 – 2026
Figure 120: Asia Pacific Technical Illustration Software Market Value Share, by Component (2018)
Figure 121: Asia Pacific Technical Illustration Software Market Value Share, by Component (2026)
Figure 122: Asia Pacific Technical Illustration Software Market Value Share, by End-user (2018)
Figure 123: Asia Pacific Technical Illustration Software Market Value Share, by End-user (2026)
Figure 124: Asia Pacific Technical Illustration Software Market Value Share, by Technology (2018)
Figure 125: Asia Pacific Technical Illustration Software Market Value Share, by Technology (2026)
Figure 126: Asia Pacific Technical Illustration Software Market Value Share, by Country (2018)
Figure 127: Asia Pacific Technical Illustration Software Market Value Share, by Country (2026)
Figure 128: Middle East & Africa Technical Illustration Software Market Revenue (US$ Mn) and Y-o-Y Forecast, 2018 – 2026
Figure 129: Middle East & Africa Technical Illustration Software Market Opportunity Growth Analysis (US$ Mn), 2016 – 2026
Figure 130: Middle East & Africa Technical Illustration Software Market Value Share, by Component (2018)
Figure 131: Middle East & Africa Technical Illustration Software Market Value Share, by Component (2026)
Figure 132: Middle East & Africa Technical Illustration Software Market Value Share, by End-user (2018)
Figure 133: Middle East & Africa Technical Illustration Software Market Value Share, by End-user (2026)
Figure 134: Middle East & Africa Technical Illustration Software Market Value Share, by Technology (2018)
Figure 135: Middle East & Africa Technical Illustration Software Market Value Share, by Technology (2026)
Figure 136: Middle East & Africa Technical Illustration Software Market Value Share, by Country (2018)
Figure 137: Middle East & Africa Technical Illustration Software Market Value Share, by Country (2026)
Figure 138: South America Technical Illustration Software Market Revenue (US$ Mn) and Y-o-Y Forecast, 2018 – 2026
Figure 139: South America Technical Illustration Software Market Opportunity Growth Analysis (US$ Mn), 2016 – 2026
Figure 140: South America Technical Illustration Software Market Value Share, by Component (2018)
Figure 141: South America Technical Illustration Software Market Value Share, by Component (2026)
Figure 142: South America Technical Illustration Software Market Value Share, by End-user (2018)
Figure 143: South America Technical Illustration Software Market Value Share, by End-user (2026)
Figure 144: South America Technical Illustration Software Market Value Share, by Technology (2018)
Figure 145: South America Technical Illustration Software Market Value Share, by Technology (2026)
Figure 146: South America Technical Illustration Software Market Value Share, by Country (2018)
Figure 147: South America Technical Illustration Software Market Value Share, by Country (2026)
Figure 148: Global Market Share, by Key Vendors (2017)
Figure 149: Technical Illustration Software Market Share Assessment, by Company, End-user (2017)
Figure 150: Technical Illustration Software Market Share Assessment, by Company, Component (2017)
Figure 151: Technical Illustration Software Market Share Assessment, by Company, Technology (2017)
Figure 152: Technical Illustration Software Market Share Assessment, by Company, Country (2017)
Copyright © Transparency Market Research, Inc. All Rights reserved
Trust Online

Technical Illustration Software Market