
Reports
Reports
Global Taps and Dies Market: Overview
The rising usage of high speed steel and tin coated taps and dies is expected to bolster the demand in the global taps and dies market in coming years. Furthermore, increasing demand from the industrial sector is also expected to favor the augmentation of the global taps and dies market in coming years. Players and manufacturers in the global taps and dies market are focusing on leveraging their rotary thread programs in order to develop high quality taps as well as dies on a steady basis. Advancements in the instrumentation engineering over the last couple of decades have also assisted in the development of the global taps and dies market. Furthermore, application of new lubricants as well as programming of CNC machines are also expected to fuel the demand in the global taps and dies market in coming years.
Halting of production facilities during the COVID-19 pandemic adversely impacted the growth of the global taps and dies market. Furthermore, there was a massive decline in the demand from various end use industries, which resulted in sluggish growth of the global taps and dies market in the last two years. Majority of the players and manufacturers in the global taps and dies market are focused on adopting various strategies as well as operational models that can aid them in fighting off the economic slowdown. One of the key strategies adopted by the players in the global taps and dies market is reskilling their labor force to adapt to digital mediums.
Furthermore, players and manufacturers in the global taps and dies market are also increasing expenditure aimed at automating their production and manufacturing processes. This trend is anticipated to favor the growth of the global taps and dies market in the long run. Increasing adoption of connected devices, industry 4.0, and internet of things technologies is also expected to favor the expansion of the global taps and dies market in the next few years. some other strategies implemented by the players in the global taps and dies market include product innovations and acquisitions.
Taps and dies are specific tools that are used in threading that refers to the creation of threads around screws. There are several cutting and forming tools involved in the procedure. Taps are essentially used to cut or create the female part of the pair, whereas a die is generally used to form the male part of the pair, for instance, taps are used to form the nut whereas dies are used to form a bolt. Tapping is the term that refers to the process formation of threads or cutting while the term threading is associated with dies.
The global market for taps and dies is expected to grow at a listless rate in the coming years. Transparency Market Research in its recent research report on global taps and dies market has covered several scenarios associated with the growth of the market which associated with the adoption of taps and dies across various applications around the globe. Various aspects such as trends, key developments, growth drivers, restraints and challenges associated with the taps and dies market are covered in this extensive research report. Moreover, the research report covers historical analysis of the global taps and dies market along with current market scenario as well as future market projections of the global market which is carried out for a period of nine years, starting from 2017 till 2026.
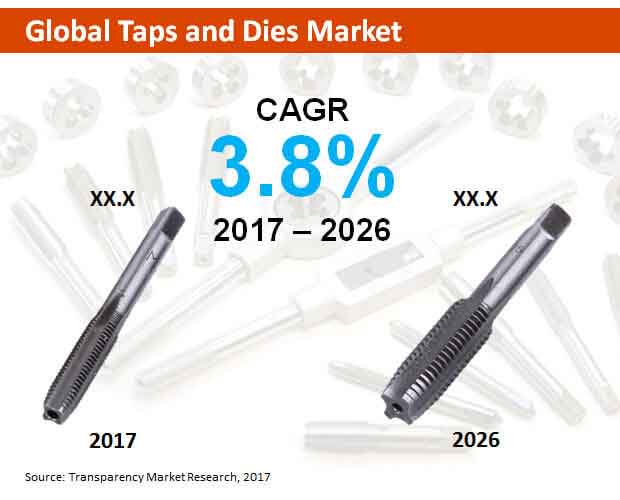
According to this analytical research study, the global market for taps and dies is expected to grow at a sluggish CAGR to reach a market estimation of over US$ 2.3 Bn by the end of the year of assessment from a value of around US$ 1700 Mn in 2017.
Europe has been a lucrative region for the growth of the taps and dies market since 2012. The use of taps and dies in Europe has been growing since the 2012-2016 timeline and is expected to reach a higher valuation by the end of the year of assessment. Moreover, the European market is expected to be the largest and the region is expected to dominate the global taps and dies market in the coming years. The growth of taps and dies market in Europe is mainly pushed by increasing adoption of taps and dies across industrial and household sectors in the region, especially in European countries such as Germany, United Kingdom and France. Of these, Germany is the largest contributor for growth of the taps and dies market in Europe and the market in Germany is estimated to reach a valuation higher than US$ 200 Mn by the end of the year of assessment, whereas on the other hand, there is cut throat competition in taps and dies market in UK and France. Asia Pacific excluding Japan (APEJ) region is the fastest growing that is expected to showcase increasing adoption of taps and dies owing to increasing household purposes and industrial projects in the region. North America is anticipated to be the second largest region with US being the main growth contributor in the region.
Taps and dies are widely used in household and industrial sectors across the globe. Of these the industrial application segment is expected to be the largest with a high market valuation and is anticipated to lead the global market for taps and dies. Also, this segment is projected to grow at a relatively high rate throughout the period of assessment, 2017-2026.
The informative research report on global taps and dies market covers analysis of various key players involved in the market. Aspects such as company overview, key financial aspects, product portfolio, developments and strategies of the key players have been covered thus offering a complete intelligence package. Major players such as Kennametal, Cleveland, Triump Twist Drill, Titex Tools, Guhring, Chicago Latrobe, OSG, Michigan Drill, Accupro, M.A. Ford, Atrax and Kyocera have been profiled in this research report.
Need for New Geometries Drives Product Development in Taps and Dies Market
Machinery and tools used for making nuts and bolts have witnessed advancements over the years, in a bid to meet the changing demands in end-use industries. Taps and dies are used to develop threading over the female and male parts respectively as they are called. Engineers have also come out with cutting tools to meet specialized requirements, propelling the strides in the taps and dies market. The adoption of better tapping processes has enabled the production of new geometries with the help of taps and dies. Some of the types of taps attracting industries’ interest are spiral point taps, spiral flute taps, forming taps, serial taps, wire-insertion taps, and forming taps. Advent of new materials used to make taps and dies is a key developmental trend for the taps and dies market. Companies are increasingly focused on leveraging the rotary thread programs to produce quality taps and dies at steady basis. Advances in the instrumentation engineering over the past few decades have helped boost the demand potential in the taps and dies market. The programming of CNC machines and application of new lubricants are key trends broadening the horizon for revenue generation in the market.
The COVID-19 pandemic has led to severe, long-term impacts on the economic activities of countries around the world. The production in several industries were drawn to screeching halt due to restrictions on the movement of labor, including in machinery production. Moreover, the large decline in demand in the end-use industries also led to decreasing bottomline for players in the value chain. A growing number of players in the taps and dies market are keen on adopting strategic frameworks and operational models to fight off the economic downturn. In particular, they are reskilling their workforce to connect on digital mediums. On another level, they are also spending automating a part of the production processes. All these will shape the contours of the taps and dies market in coming years.
Taps and Dies Market is projected to reach US$ 2300 Mn by 2026
Key vendors in the Taps and Dies Market are Kyocera, Atrax, M.A. Ford, Accupro, Michigan Drill, OSG, Chicago Latrobe, Guhring, Titex Tools, Triump Twist Drill, Cleveland and Kennametal
The Taps and Dies Market is expected to grow at a CAGR of 3.8% during 2017 - 2026
Taps and Dies product type, end user, price category, distribution channel, and region.
Europe Takes Lead in the Taps and Dies Market
1. Global Economic Outlook
2. Global Taps and Dies Tools Market - Executive Summary
2.1. Opportunity Assessment
2.2. Mega Trends
3. Global Taps and Dies Tools Market Overview
3.1. Introduction
3.1.1. Global Taps and Dies Tools Market Taxonomy
3.1.2. Global Taps and Dies Tools Market Definition
3.2. Global Taps and Dies Tools Market Size (US$ Mn) and Forecast, 2012-2026
3.2.1. Global Taps and Dies Tools Market Y-o-Y Growth
3.3. Overall Hand Tools Market Analysis
3.3.1. Market Drivers
3.3.2. Market opportunities
3.3.3. Market Trends
3.3.3.1 Impact Analysis by Product Type
3.3.3.2 Impact Analysis by Sales Channel
3.3.3.3 Impact Analysis by Applications
3.4. Global Taps and Dies Tools Market Dynamics
3.5. Supply Chain
3.6. Cost Structure
3.7. PESTLE Analysis
3.8. Porter Analysis
3.9. PLC Analysis
3.10. Macro-Economic Factors
3.11. Competition Matrix
3.12. Investment Feasibility Matrix
3.13. Global Taps and Dies Tools Market Scenario forecast
3.13.1. Conservative Scenario
3.13.2. Likely Scenario
3.13.3. Optimistic Scenario
3.14. Service Provider List
3.15. Key Participants Market Presence (Intensity Map) By Region
4. Pricing Point Analysis
4.1. Price Point Assessment by Region
4.2. Price Point Assessment by Material Type
4.3. Price Forecast till 2026
4.4. Factors Influencing Pricing
4.5. Value Chain Pricing Mark-ups
5. Global Taps and Dies Tools Market Analysis and Forecast 2012-2026
5.1. Global Taps and Dies Tools Market Size and Forecast By Material Type, 2012-2026
5.1.1. Carbon Steel Market Size and Forecast, 2012-2026
5.1.1.1. Revenue (US$ Mn) Comparison, By Region
5.1.1.2. Market Share Comparison, By Region
5.1.1.3. Y-o-Y growth Comparison, By Region
5.1.2. High Speed Steel Market Size and Forecast, 2012-2026
5.1.2.1. Revenue (US$ Mn) Comparison, By Region
5.1.2.2. Market Share Comparison, By Region
5.1.2.3. Y-o-Y growth Comparison, By Region
5.1.3. Alloy Steel Market Size and Forecast, 2012-2026
5.1.3.1. Revenue (US$ Mn) Comparison, By Region
5.1.3.2. Market Share Comparison, By Region
5.1.3.3. Y-o-Y growth Comparison, By Region
5.1.4. TIN Coated Market Size and Forecast, 2012-2026
5.1.4.1. Revenue (US$ Mn) Comparison, By Region
5.1.4.2. Market Share Comparison, By Region
5.1.4.3. Y-o-Y growth Comparison, By Region
5.2. Global Taps and Dies Tools Market Size and Forecast By Applications, 2012-2026
5.2.1. Industrial Market Size and Forecast, 2012-2026
5.2.1.1. Revenue (US$ Mn) Comparison, By Region
5.2.1.2. Market Share Comparison, By Region
5.2.1.3. Y-o-Y growth Comparison, By Region
5.2.2. household and DIY Market Size and Forecast, 2012-2026
5.2.2.1. Revenue (US$ Mn) Comparison, By Region
5.2.2.2. Market Share Comparison, By Region
5.2.2.3. Y-o-Y growth Comparison, By Region
5.3. Global Taps and Dies Tools Market Size and Forecast By Sales Channel, 2012-2026
5.3.1. Online Market Size and Forecast, 2012-2026
5.3.1.1. Revenue (US$ Mn) Comparison, By Region
5.3.1.2. Market Share Comparison, By Region
5.3.1.3. Y-o-Y growth Comparison, By Region
5.3.2. Retail Market Size and Forecast, 2012-2026
5.3.2.1. Revenue (US$ Mn) Comparison, By Region
5.3.2.2. Market Share Comparison, By Region
5.3.2.3. Y-o-Y growth Comparison, By Region
5.3.3. Distributors Market Size and Forecast, 2012-2026
5.3.3.1. Revenue (US$ Mn) Comparison, By Region
5.3.3.2. Market Share Comparison, By Region
5.3.3.3. Y-o-Y growth Comparison, By Region
6. North America Taps and Dies Tools Market Size and Forecast, 2012-2026
6.1. North America Outlook
6.2. North America Parent Market Outlook
6.3. North America Target Market Outlook
6.4. Revenue (US$ Mn) Comparison, By Country
6.4.1. US Market Size and Forecast (US$ Mn), 2012-2026
6.4.2. Canada Market Size and Forecast (US$ Mn), 2012-2026
6.5. Revenue (US$ Mn) Comparison, By Material Type
6.6. Revenue (US$ Mn) Comparison, By Sales Channel
6.7. Revenue (US$ Mn) Comparison, By Application
7. Latin America Taps and Dies Tools Market Size and Forecast, 2012-2026
7.1. Latin America Outlook
7.2. Latin America Parent Market Outlook
7.3. Latin America Target Market Outlook
7.4. Revenue (US$ Mn) Comparison, By Country
7.4.1. Brazil Market Size and Forecast (US$ Mn), 2012-2026
7.4.2. Mexico Market Size and Forecast (US$ Mn), 2012-2026
7.4.3. Argentina Market Size and Forecast (US$ Mn), 2012-2026
7.4.4. Rest of Latin America Market Size and Forecast (US$ Mn), 2012-2026
7.5. Revenue (US$ Mn) Comparison, By Material Type
7.6. Revenue (US$ Mn) Comparison, By Sales Channel
7.7. Revenue (US$ Mn) Comparison, By Application
8. Europe Taps and Dies Tools Market Size and Forecast, 2012-2026
8.1. Europe Outlook
8.2. Europe Parent Market Outlook
9.3. Europe Target Market Outlook
8.4. Revenue (US$ Mn) Comparison, By Country
8.4.1. Germany Market Size and Forecast (US$ Mn), 2012-2026
8.4.2. UK Market Size and Forecast (US$ Mn), 2012-2026
8.4.3. France Market Size and Forecast (US$ Mn), 2012-2026
8.4.4. Spain Market Size and Forecast (US$ Mn), 2012-2026
8.4.5. Italy Market Size and Forecast (US$ Mn), 2012-2026
8.4.6. Rest of Europe Market Size and Forecast (US$ Mn), 2012-2026
8.5. Revenue (US$ Mn) Comparison, By Material Type
8.6. Revenue (US$ Mn) Comparison, By Sales Channel
9.7. Revenue (US$ Mn) Comparison, By Application
9. Japan Taps and Dies Tools Market Size and Forecast, 2012-2026
9.1. Japan Outlook
9.2. Japan Parent Market Outlook
9.3. Japan Target Market Outlook
9.4. Revenue (US$ Mn) Comparison, By Country
9.4.1. Japan Market Size and Forecast (US$ Mn), 2012-2026
9.5. Revenue (US$ Mn) Comparison, By Material Type
9.6. Revenue (US$ Mn) Comparison, By Sales Channel
9.7. Revenue (US$ Mn) Comparison, By Application
10. APEJ Taps and Dies Tools Market Size and Forecast, 2012-2026
10.1. APEJ Outlook
10.2. APEJ Parent Market Outlook
10.3. APEJ Target Market Outlook
10.4. Revenue (US$ Mn) Comparison, By Country
10.4.1. China Market Size and Forecast (US$ Mn), 2012-2026
10.4.2. India Market Size and Forecast (US$ Mn), 2012-2026
10.4.3. Malaysia Market Size and Forecast (US$ Mn), 2012-2026
10.4.4. Singapore Market Size and Forecast (US$ Mn), 2012-2026
10.4.5. Australia Market Size and Forecast (US$ Mn), 2012-2026
10.4.6. Rest of APEJ Market Size and Forecast (US$ Mn), 2012-2026
10.5. Revenue (US$ Mn) Comparison, By Material Type
10.6. Revenue (US$ Mn) Comparison, By Sales Channel
10.7. Revenue (US$ Mn) Comparison, By Application
11. MEA Taps and Dies Tools Market Size and Forecast, 2012-2026
11.1. MEA Outlook
11.2. MEA Parent Market Outlook
11.3. MEA Target Market Outlook
11.4. Revenue (US$ Mn) Comparison, By Country
11.4.1. GCC Countries Market Size and Forecast (US$ Mn), 2012-2026
11.4.2. South Africa Market Size and Forecast (US$ Mn), 2012-2026
11.4.3. Turkey Market Size and Forecast (US$ Mn), 2012-2026
11.4.4. Israel Market Size and Forecast (US$ Mn), 2012-2026
11.4.5. Rest of MEA Market Size and Forecast (US$ Mn), 2012-2026
11.5. Revenue (US$ Mn) Comparison, By Material Type
11.6. Revenue (US$ Mn) Comparison, By Sales Channel
11.7. Revenue (US$ Mn) Comparison, By Application
12. Global Taps and Dies Tools Market Company Share, Competition Landscape and Company Profiles
12.1. Company Share Analysis
12.2. Competition Dashboard
12.3. Competitive Scenario (Organized & Un-organized Players)
12.4. Company Profiles
12.4.1. Kennametal
12.4.2. Cleveland
12.4.3. Triump Twist Drill
12.4.4. Titex Tools
12.4.5. Guhring Inc.
12.4.6. Apex Tools Group
12.4.7. OSG
12.4.8. Michigan Drill
12.4.9. Accupro
12.4.10. Kyocera Precision Tools Inc.
13. Research Methodology
14. Disclaimer
List of Tables
TABLE 1 Global Taps and Dies Tools Market Value (US$ Mn), 2012-2017
TABLE 2 Global Taps and Dies Tools Market Value (US$ Mn), 2018-2026
TABLE 3 Global Taps and Dies Tools Market Value (US$ Mn) and Y-o-Y, 2017-2026
TABLE 4 Global Carbon Steel Segment Value (US$ Mn), By Region 2012-2017
TABLE 5 Global Carbon Steel Segment Value (US$ Mn), By Region 2018-2026
TABLE 6 Global Carbon Steel Segment Market Share, By Region 2012-2017
TABLE 7 Global Carbon Steel Segment Market Share, By Region 2018-2026
TABLE 8 Global Carbon Steel Segment Y-o-Y, By Region 2017-2026
TABLE 9 Global High Speed Steel Segment Value (US$ Mn), By Region 2012-2017
TABLE 10 Global High Speed Steel Segment Value (US$ Mn), By Region 2018-2026
TABLE 11 Global High Speed Steel Segment Market Share, By Region 2012-2017
TABLE 12 Global High Speed Steel Segment Market Share, By Region 2018-2026
TABLE 13 Global High Speed Steel Segment Y-o-Y, By Region 2017-2026
TABLE 14 Global Alloy Steel Segment Value (US$ Mn), By Region 2012-2017
TABLE 15 Global Alloy Steel Segment Value (US$ Mn), By Region 2018-2026
TABLE 16 Global Alloy Steel Segment Market Share, By Region 2012-2017
TABLE 17 Global Alloy Steel Segment Market Share, By Region 2018-2026
TABLE 18 Global Alloy Steel Segment Y-o-Y, By Region 2017-2026
TABLE 19 Global TIN Coated Segment Value (US$ Mn), By Region 2012-2017
TABLE 20 Global TIN Coated Segment Value (US$ Mn), By Region 2018-2026
TABLE 21 Global TIN Coated Segment Market Share, By Region 2012-2017
TABLE 22 Global TIN Coated Segment Market Share, By Region 2018-2026
TABLE 23 Global TIN Coated Segment Y-o-Y, By Region 2017-2026
TABLE 24 Global Industrial Segment Value (US$ Mn), By Region 2012-2017
TABLE 25 Global Industrial Segment Value (US$ Mn), By Region 2018-2026
TABLE 26 Global Industrial Segment Market Share, By Region 2012-2017
TABLE 27 Global Industrial Segment Market Share, By Region 2018-2026
TABLE 28 Global Industrial Segment Y-o-Y, By Region 2017-2026
TABLE 29 Global household and DIY Segment Value (US$ Mn), By Region 2012-2017
TABLE 30 Global household and DIY Segment Value (US$ Mn), By Region 2018-2026
TABLE 31 Global household and DIY Segment Market Share, By Region 2012-2017
TABLE 32 Global household and DIY Segment Market Share, By Region 2018-2026
TABLE 33 Global household and DIY Segment Y-o-Y, By Region 2017-2026
TABLE 34 Global Online Segment Value (US$ Mn), By Region 2012-2017
TABLE 35 Global Online Segment Value (US$ Mn), By Region 2018-2026
TABLE 36 Global Online Segment Market Share, By Region 2012-2017
TABLE 37 Global Online Segment Market Share, By Region 2018-2026
TABLE 38 Global Online Segment Y-o-Y, By Region 2017-2026
TABLE 39 Global Retail Segment Value (US$ Mn), By Region 2012-2017
TABLE 40 Global Retail Segment Value (US$ Mn), By Region 2018-2026
TABLE 41 Global Retail Segment Market Share, By Region 2012-2017
TABLE 42 Global Retail Segment Market Share, By Region 2018-2026
TABLE 43 Global Retail Segment Y-o-Y, By Region 2017-2026
TABLE 44 Global Distributors Segment Value (US$ Mn), By Region 2012-2017
TABLE 45 Global Distributors Segment Value (US$ Mn), By Region 2018-2026
TABLE 46 Global Distributors Segment Market Share, By Region 2012-2017
TABLE 47 Global Distributors Segment Market Share, By Region 2018-2026
TABLE 48 Global Distributors Segment Y-o-Y, By Region 2017-2026
TABLE 49 North America Taps and Dies Tools Market Value (US$ Mn), By Country 2012-2017
TABLE 50 North America Taps and Dies Tools Market Value (US$ Mn), By Country 2018-2026
TABLE 51 North America Taps and Dies Tools Market Value (US$ Mn), By Material Type 2012-2017
TABLE 52 North America Taps and Dies Tools Market Value (US$ Mn), By Material Type 2018-2026
TABLE 53 North America Taps and Dies Tools Market Value (US$ Mn), By Application 2012-2017
TABLE 54 North America Taps and Dies Tools Market Value (US$ Mn), By Application 2018-2026
TABLE 55 North America Taps and Dies Tools Market Value (US$ Mn), By Sales Channel 2012-2017
TABLE 56 North America Taps and Dies Tools Market Value (US$ Mn), By Sales Channel 2018-2026
TABLE 57 Latin America Taps and Dies Tools Market Value (US$ Mn), By Country 2012-2017
TABLE 58 Latin America Taps and Dies Tools Market Value (US$ Mn), By Country 2018-2026
TABLE 59 Latin America Taps and Dies Tools Market Value (US$ Mn), By Material Type 2012-2017
TABLE 60 Latin America Taps and Dies Tools Market Value (US$ Mn), By Material Type 2018-2026
TABLE 61 Latin America Taps and Dies Tools Market Value (US$ Mn), By Application 2012-2017
TABLE 62 Latin America Taps and Dies Tools Market Value (US$ Mn), By Application 2018-2026
TABLE 63 Latin America Taps and Dies Tools Market Value (US$ Mn), By Sales Channel 2012-2017
TABLE 64 Latin America Taps and Dies Tools Market Value (US$ Mn), By Sales Channel 2018-2026
TABLE 65 Europe Taps and Dies Tools Market Value (US$ Mn), By Country 2012-2017
TABLE 66 Europe Taps and Dies Tools Market Value (US$ Mn), By Country 2018-2026
TABLE 67 Europe Taps and Dies Tools Market Value (US$ Mn), By Material Type 2012-2017
TABLE 68 Europe Taps and Dies Tools Market Value (US$ Mn), By Material Type 2018-2026
TABLE 69 Europe Taps and Dies Tools Market Value (US$ Mn), By Application 2012-2017
TABLE 70 Europe Taps and Dies Tools Market Value (US$ Mn), By Application 2018-2026
TABLE 71 Europe Taps and Dies Tools Market Value (US$ Mn), By Sales Channel 2012-2017
TABLE 72 Europe Taps and Dies Tools Market Value (US$ Mn), By Sales Channel 2018-2026
TABLE 73 Japan Taps and Dies Tools Market Value (US$ Mn), By Country 2012-2017
TABLE 74 Japan Taps and Dies Tools Market Value (US$ Mn), By Country 2018-2026
TABLE 75 Japan Taps and Dies Tools Market Value (US$ Mn), By Material Type 2012-2017
TABLE 76 Japan Taps and Dies Tools Market Value (US$ Mn), By Material Type 2018-2026
TABLE 77 Japan Taps and Dies Tools Market Value (US$ Mn), By Application 2012-2017
TABLE 78 Japan Taps and Dies Tools Market Value (US$ Mn), By Application 2018-2026
TABLE 79 Japan Taps and Dies Tools Market Value (US$ Mn), By Sales Channel 2012-2017
TABLE 80 Japan Taps and Dies Tools Market Value (US$ Mn), By Sales Channel 2018-2026
TABLE 81 APEJ Taps and Dies Tools Market Value (US$ Mn), By Country 2012-2017
TABLE 82 APEJ Taps and Dies Tools Market Value (US$ Mn), By Country 2018-2026
TABLE 83 APEJ Taps and Dies Tools Market Value (US$ Mn), By Material Type 2012-2017
TABLE 84 APEJ Taps and Dies Tools Market Value (US$ Mn), By Material Type 2018-2026
TABLE 85 APEJ Taps and Dies Tools Market Value (US$ Mn), By Application 2012-2017
TABLE 86 APEJ Taps and Dies Tools Market Value (US$ Mn), By Application 2018-2026
TABLE 87 APEJ Taps and Dies Tools Market Value (US$ Mn), By Sales Channel 2012-2017
TABLE 88 APEJ Taps and Dies Tools Market Value (US$ Mn), By Sales Channel 2018-2026
TABLE 89 MEA Taps and Dies Tools Market Value (US$ Mn), By Country 2012-2017
TABLE 90 MEA Taps and Dies Tools Market Value (US$ Mn), By Country 2018-2026
TABLE 91 MEA Taps and Dies Tools Market Value (US$ Mn), By Material Type 2012-2017
TABLE 92 MEA Taps and Dies Tools Market Value (US$ Mn), By Material Type 2018-2026
TABLE 93 MEA Taps and Dies Tools Market Value (US$ Mn), By Application 2012-2017
TABLE 94 MEA Taps and Dies Tools Market Value (US$ Mn), By Application 2018-2026
TABLE 95 MEA Taps and Dies Tools Market Value (US$ Mn), By Sales Channel 2012-2017
TABLE 96 MEA Taps and Dies Tools Market Value (US$ Mn), By Sales Channel 2018-2026
List of Figures
FIG. 1 Global Taps and Dies Tools Market Value (US$ Mn), 2012-2017
FIG. 2 Global Taps and Dies Tools Market Value (US$ Mn) Forecast, 2018-2026
FIG. 3 Global Taps and Dies Tools Market Value (US$ Mn) and Y-o-Y, 2017-2026
FIG. 4 Global Carbon Steel Segment Market Value (US$ Mn) By Region, 2012-2017
FIG. 5 Global Carbon Steel Segment Market Value (US$ Mn) By Region, 2018-2026
FIG. 6 Global Carbon Steel Segment Y-o-Y Growth Rate, By Region, 2017-2026
FIG. 7 Global High Speed Steel Segment Market Value (US$ Mn) By Region, 2012-2017
FIG. 8 Global High Speed Steel Segment Market Value (US$ Mn) By Region, 2018-2026
FIG. 9 Global High Speed Steel Segment Y-o-Y Growth Rate, By Region, 2017-2026
FIG. 10 Global Alloy Steel Segment Market Value (US$ Mn) By Region, 2012-2017
FIG. 11 Global Alloy Steel Segment Market Value (US$ Mn) By Region, 2018-2026
FIG. 12 Global Alloy Steel Segment Y-o-Y Growth Rate, By Region, 2017-2026
FIG. 13 Global TIN Coated Segment Market Value (US$ Mn) By Region, 2012-2017
FIG. 14 Global TIN Coated Segment Market Value (US$ Mn) By Region, 2018-2026
FIG. 15 Global TIN Coated Segment Y-o-Y Growth Rate, By Region, 2017-2026
FIG. 16 Global Industrial Segment Market Value (US$ Mn) By Region, 2012-2017
FIG. 17 Global Industrial Segment Market Value (US$ Mn) By Region, 2018-2026
FIG. 18 Global Industrial Segment Y-o-Y Growth Rate, By Region, 2017-2026
FIG. 19 Global household and DIY Segment Market Value (US$ Mn) By Region, 2012-2017
FIG. 20 Global household and DIY Segment Market Value (US$ Mn) By Region, 2018-2026
FIG. 21 Global household and DIY Segment Y-o-Y Growth Rate, By Region, 2017-2026
FIG. 22 Global Online Segment Market Value (US$ Mn) By Region, 2012-2017
FIG. 23 Global Online Segment Market Value (US$ Mn) By Region, 2018-2026
FIG. 24 Global Online Segment Y-o-Y Growth Rate, By Region, 2017-2026
FIG. 25 Global Retail Segment Market Value (US$ Mn) By Region, 2012-2017
FIG. 26 Global Retail Segment Market Value (US$ Mn) By Region, 2018-2026
FIG. 27 Global Retail Segment Y-o-Y Growth Rate, By Region, 2017-2026
FIG. 28 Global Distributors Segment Market Value (US$ Mn) By Region, 2012-2017
FIG. 29 Global Distributors Segment Market Value (US$ Mn) By Region, 2018-2026
FIG. 30 Global Distributors Segment Y-o-Y Growth Rate, By Region, 2017-2026
FIG. 31 North America Taps and Dies Tools Market Value (US$ Mn), By Country 2012-2017
FIG. 32 North America Taps and Dies Tools Market Value (US$ Mn), By Country 2018-2026
FIG. 33 North America Taps and Dies Tools Market Value (US$ Mn), By Material Type 2012-2017
FIG. 34 North America Taps and Dies Tools Market Value (US$ Mn), By Material Type 2018-2026
FIG. 35 North America Taps and Dies Tools Market Value (US$ Mn), By Application 2012-2017
FIG. 36 North America Taps and Dies Tools Market Value (US$ Mn), By Application 2018-2026
FIG. 37 North America Taps and Dies Tools Market Value (US$ Mn), By Sales Channel 2012-2017
FIG. 38 North America Taps and Dies Tools Market Value (US$ Mn), By Sales Channel 2018-2026
FIG. 39 Latin America Taps and Dies Tools Market Value (US$ Mn), By Country 2012-2017
FIG. 40 Latin America Taps and Dies Tools Market Value (US$ Mn), By Country 2018-2026
FIG. 41 Latin America Taps and Dies Tools Market Value (US$ Mn), By Material Type 2012-2017
FIG. 42 Latin America Taps and Dies Tools Market Value (US$ Mn), By Material Type 2018-2026
FIG. 43 Latin America Taps and Dies Tools Market Value (US$ Mn), By Application 2012-2017
FIG. 44 Latin America Taps and Dies Tools Market Value (US$ Mn), By Application 2018-2026
FIG. 45 Latin America Taps and Dies Tools Market Value (US$ Mn), By Sales Channel 2012-2017
FIG. 46 Latin America Taps and Dies Tools Market Value (US$ Mn), By Sales Channel 2018-2026
FIG. 47 Europe Taps and Dies Tools Market Value (US$ Mn), By Country 2012-2017
FIG. 48 Europe Taps and Dies Tools Market Value (US$ Mn), By Country 2018-2026
FIG. 49 Europe Taps and Dies Tools Market Value (US$ Mn), By Material Type 2012-2017
FIG. 50 Europe Taps and Dies Tools Market Value (US$ Mn), By Material Type 2018-2026
FIG. 51 Europe Taps and Dies Tools Market Value (US$ Mn), By Application 2012-2017
FIG. 52 Europe Taps and Dies Tools Market Value (US$ Mn), By Application 2018-2026
FIG. 53 Europe Taps and Dies Tools Market Value (US$ Mn), By Sales Channel 2012-2017
FIG. 54 Europe Taps and Dies Tools Market Value (US$ Mn), By Sales Channel 2018-2026
FIG. 55 Japan Taps and Dies Tools Market Value (US$ Mn), By Country 2012-2017
FIG. 56 Japan Taps and Dies Tools Market Value (US$ Mn), By Country 2018-2026
FIG. 57 Japan Taps and Dies Tools Market Value (US$ Mn), By Material Type 2012-2017
FIG. 58 Japan Taps and Dies Tools Market Value (US$ Mn), By Material Type 2018-2026
FIG. 59 Japan Taps and Dies Tools Market Value (US$ Mn), By Sales Channel 2012-2017
FIG. 60 Japan Taps and Dies Tools Market Value (US$ Mn), By Application 2018-2026
FIG. 61 Japan Taps and Dies Tools Market Value (US$ Mn), By Sales Channel 2012-2017
FIG. 62 Japan Taps and Dies Tools Market Value (US$ Mn), By Sales Channel 2018-2026
FIG. 63 APEJ Taps and Dies Tools Market Value (US$ Mn), By Country 2012-2017
FIG. 64 APEJ Taps and Dies Tools Market Value (US$ Mn), By Country 2018-2026
FIG. 65 APEJ Taps and Dies Tools Market Value (US$ Mn), By Material Type 2012-2017
FIG. 66 APEJ Taps and Dies Tools Market Value (US$ Mn), By Material Type 2018-2026
FIG. 67 APEJ Taps and Dies Tools Market Value (US$ Mn), By Application 2012-2017
FIG. 68 APEJ Taps and Dies Tools Market Value (US$ Mn), By Application 2018-2026
FIG. 69 APEJ Taps and Dies Tools Market Value (US$ Mn), By Sales Channel 2012-2017
FIG. 70 APEJ Taps and Dies Tools Market Value (US$ Mn), By Sales Channel 2018-2026
FIG. 71 MEA Taps and Dies Tools Market Value (US$ Mn), By Country 2012-2017
FIG. 72 MEA Taps and Dies Tools Market Value (US$ Mn), By Country 2018-2026
FIG. 73 MEA Taps and Dies Tools Market Value (US$ Mn), By Material Type 2012-2017
FIG. 74 MEA Taps and Dies Tools Market Value (US$ Mn), By Material Type 2018-2026
FIG. 75 MEA Taps and Dies Tools Market Value (US$ Mn), By Application 2012-2017
FIG. 76 MEA Taps and Dies Tools Market Value (US$ Mn), By Application 2018-2026
FIG. 77 MEA Taps and Dies Tools Market Value (US$ Mn), By Sales Channel 2012-2017
FIG. 78 MEA Taps and Dies Tools Market Value (US$ Mn), By Sales Channel 2018-2026
Copyright © Transparency Market Research, Inc. All Rights reserved
Trust Online

Taps and Dies Market Analysis, Outlook 2026