
Reports
Reports
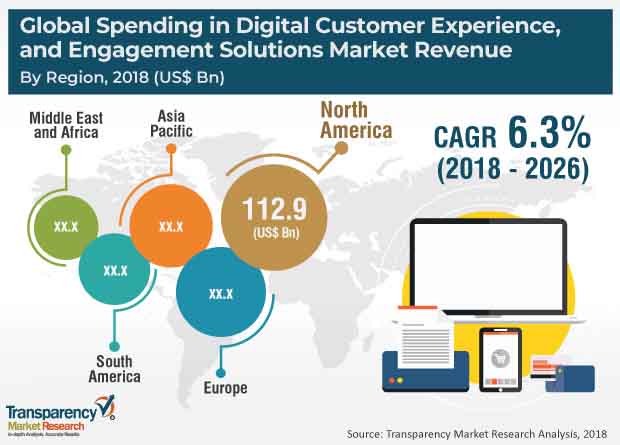
Digital customer experience and engagement solutions are cloud-based or on premise solutions that provide efficient management of customer data. Spending in digital customer experience and engagement solutions comprises the expenditure that a company invests in digitalizing the customer experience both at the front end as well as back end. Primarily, the solutions provide customer awareness, customer engagement, online maintenance requests & tracking, transaction processing, online marketing, advertising etc. Spending in digital customer experience and engagement solutions helps organizations to create customer awareness and engagement. Various software are developed for data analytics, marketing, advertising, user interface designing etc. Digital customer experience and engagement solutions are gaining importance in retail, banking, and manufacturing industry. In addition, digital customer experience and engagement solutions providers are emphasizing on developing software solutions and establishing appropriate frameworks to increase the customer base for the companies. Further, the market is flourishing due to the developments in technology as well as the increasing awareness about the technology amongst customers.
Customer expectations in terms of user experience are increasing radically. Customers are expecting a user friendly approach that involves an approachable User Interface (UI), and well-developed customer support and personalization facilities. Rapid response to queries and faster support facilities are also demanded by customers. Presently, customers have become more digitally conscious due to their increasing participation in social media and because information on the web is easily accessible. Moreover, users are demanding speed in their daily transactions or online activities. Exceeding customer expectations and providing solutions to both explicit customer requests and implicit customer needs are the primary objectives of organizations these days. This obliges organizations to implement improved user experiences in order to engage more customers. An omni-channel experience can be defined as a cross channel approach that enables various interfaces such as social media, web, and mobile to integrate for customer engagement. An omni-channel approach increases the involvement of customers with the organization, as all the communication channels are utilized in an integrated manner. This helps in broadening the customer base.
In terms of business type, the spending in digital customer experience and engagement solutions market has been categorized into Business to Business (B2B), Business to Customer (B2C), and Business to Business to Consumer (B2B2C). Touch point segment of the market is bifurcated into social media, Gamification, digital marketing, and mobility. Based on industries, the bifurcation includes banking, insurance, manufacturing, public sector, telecommunications, utilities, retail & wholesale, services & consumer, and transport. In terms of enterprise size, the market is divided into small enterprises, medium enterprises, and large enterprises. Based on solutions, the market is segmented into customer awareness, customer engagement, purchase & relation, and support services. Customer awareness is sub segmented into customer data management platforms, customer analytics, and advertising & marketing. Advertising & marketing comprises email/campaign management, social media analytics, SEO/ Web analytics, targeted marketing, and content marketing. Customer engagement is further sub divided into personalization/ content targeting, cross selling/ up selling, and UI design. Purchase relation segment includes loyalty programs, transactions/ sales, and virtual trials/ displays. Support services segment includes Chatbot, self-serve tools, digital surveys, and case management.
Adoption of B2B business type is growing majorly in North America due to escalation in industrialization and major technological advancements. Social media is projected to be adopted majorly as the channel for customer experience and engagement solutions. In Europe, the retail and wholesale industry is estimated to hold the major share, as customers are becoming digitally conscious. The APAC region will see major adoption of support services followed by customer awareness solutions.
Key players profiled in the spending in digital customer experience and engagement solutions market include Accenture, Capgemini SE, Cognizant, IBM Corporation, KOFAX INC.,Liferay Inc.,MEGA International, NCR Corporation, Orange Business Services, SAS Institute Inc., Tata Consultancy Services Limited, Tieto, and Zendesk, Inc.
1. Preface
1.1. Market Scope
1.2. Market Segmentation
1.3. Key Research Objectives
2. Assumptions and Research Methodology
2.1. Research Methodology
2.1.1. List of Primary and Secondary Sources
2.2. Key Assumptions for Data Modeling
3. Executive Summary: Global Spending in Digital Customer Experience and Engagement Solutions Market
4. Market Overview
4.1. Introduction
4.2. Global Market – Macro Economic Factors Overview
4.2.1. Global ICT Spending (US$ Bn), 2012, 2018, 2026
4.3. Market Factor Analysis
4.3.1. Porter’s Five Forces Analysis
4.3.2. PESTEL Analysis
4.3.3. Value Chain Analysis
4.3.4. Market Dynamics (Growth Influencers)
4.3.4.1. Drivers
4.3.4.2. Restraints
4.3.4.3. Opportunities
4.3.4.4. Impact Analysis of Drivers & Restraints
4.3.5. Technology Roadmap
4.4. Regulations and Policies
4.5. Global Spending in Digital Customer Experience and Engagement Solutions Market Analysis and Forecast, 2012– 2026
4.5.1. Market Revenue Analysis (US$ Bn)
4.5.1.1. Historic Growth Trends, 2013-2017
4.5.1.2. Forecast Trends, 2018-2026
4.6. Market Opportunity Analysis– By Region (Global/North America/Europe/Asia Pacific/Middle East & Africa/South America)
4.6.1. By Business Type
4.6.2. By Touch Points
4.6.3. By Industry
4.6.4. By Enterprise Size
4.6.5. By Solution
4.7. Competitive Scenario and Trends
4.7.1. Spending in Digital Customer Experience and Engagement Solutions Market Concentration Rate
4.7.1.1. List of New Entrants
4.7.2. Mergers & Acquisitions, Expansions
4.8. Market Outlook
5. Global Spending in Digital Customer Experience and Engagement Solutions Market Analysis and Forecast, by Business Type
5.1. Key Segment Analysis
5.2. Spending in Digital Customer Experience and Engagement Solutions Market Size (US$ Bn) Forecast, by Business Type, 2016 - 2026
5.2.1. Business to Business (B2B)
5.2.2. Business to Consumer (B2C)
5.2.3. Business to Business to Consumer (B2B2C)
6. Global Spending in Digital Customer Experience and Engagement Solutions Market Analysis and Forecast, by Touch Points
6.1. Overview
6.2. Key Segment Analysis
6.3. Spending in Digital Customer Experience and Engagement Solutions Market Size (US$ Bn) Forecast, by Touch Points 2016 - 2026
6.3.1. Social media
6.3.2. Gamification
6.3.3. Digital Marketing
6.3.4. Mobility
7. Global Spending in Digital Customer Experience and Engagement Solutions Market Analysis and Forecast, by Industry
7.1. Overview
7.2. Key Segment Analysis
7.3. Spending in Digital Customer Experience and Engagement Solutions Market Size (US$ Bn) Forecast, By Industry, 2016 - 2026
7.3.1. Banking
7.3.2. Insurance
7.3.3. Manufacturing
7.3.4. Public Sector
7.3.5. Telecommunications
7.3.6. Utilities
7.3.7. Retail and wholesale
7.3.8. Services & Consumers
7.3.9. Transport
8. Global Spending in Digital Customer Experience and Engagement Solutions Market Analysis and Forecast, by Enterprise Size
8.1. Key Segment Analysis
8.2. Spending in Digital Customer Experience and Engagement Solutions Market Size (US$ Bn) Forecast, By Enterprise Size, 2016 - 2026
8.2.1. Small Enterprises
8.2.2. Medium Enterprises
8.2.3. Large Enterprises
9. Global Spending in Digital Customer Experience and Engagement Solutions Market Analysis and Forecast, by Solution
9.1. Overview
9.2. Key Segment Analysis
9.3. Spending in Digital Customer Experience and Engagement Solutions Market Size (US$ Bn) Forecast, by Solution, 2016 - 2026
9.3.1. Customer Awareness
9.3.1.1. Customer data management platforms
9.3.1.2. Customer Analytics
9.3.1.3. Advertising & Marketing
9.3.1.3.1. Email/ Campaign management
9.3.1.3.2. Social Media Analytics
9.3.1.3.3. SEO/ Web Analytics
9.3.1.3.4. Targeted Marketing
9.3.1.3.5. Content Marketing
9.3.2. Customer Engagement
9.3.2.1. Personalization/Content Targeting
9.3.2.2. Cross Selling/ Up selling
9.3.2.3. UI Design
9.3.3. Purchase and relation
9.3.3.1. Loyalty Programs
9.3.3.2. Transactions/ Sales
9.3.3.3. Virtual Trials/ Displays
9.3.4. Support Services
9.3.4.1. Chatbot
9.3.4.2. Self-serve tools
9.3.4.3. Digital surveys
9.3.4.4. Case Management
10. Global Spending in Digital Customer Experience and Engagement Solutions Market Analysis and Forecast, by Region
10.1. Overview
10.2. Key Segment Analysis
10.3. Spending in Digital Customer Experience and Engagement Solutions Market Size (US$ Bn) Forecast, by Region, 2016 - 2026
10.3.1. North America
10.3.2. Europe
10.3.3. Asia Pacific
10.3.4. Middle East & Africa
10.3.5. South America
11. North America Spending in Digital Customer Experience and Engagement Solutions Market Analysis and Forecast
11.1. Key Findings
11.2. Impact Analysis of Drivers and Restraints
11.3. Spending in Digital Customer Experience and Engagement Solutions Market Size (US$ Bn) Forecast, by Business Type, 2016 - 2026
11.3.1. Business to Business (B2B)
11.3.2. Business to Consumer (B2C)
11.3.3. Business to Business to Consumer (B2B2C)
11.4. Spending in Digital Customer Experience and Engagement Solutions Market Size (US$ Bn) Forecast, by Touch Points 2016 - 2026
11.4.1. Social media
11.4.2. Gamification
11.4.3. Digital Marketing
11.4.4. Mobility
11.5. Spending in Digital Customer Experience and Engagement Solutions Market Size (US$ Bn) Forecast, by Industry, 2016 - 2026
11.5.1. Banking
11.5.2. Insurance
11.5.3. Manufacturing
11.5.4. Public Sector
11.5.5. Telecommunications
11.5.6. Utilities
11.5.7. Retail and wholesale
11.5.8. Services & Consumers
11.5.9. Transport
11.6. Spending in Digital Customer Experience and Engagement Solutions Market Size (US$ Bn) Forecast, by Enterprise Size, 2016 - 2026
11.6.1. Small Enterprises
11.6.2. Medium Enterprises
11.6.3. Large Enterprises
11.7. Spending in Digital Customer Experience and Engagement Solutions Market Size (US$ Bn) Forecast, by Solution, 2016 - 2026
11.7.1. Customer Awareness
11.7.1.1. Customer data management platforms
11.7.1.2. Customer Analytics
11.7.1.3. Advertising & Marketing
11.7.1.3.1. Email/ Campaign management
11.7.1.3.2. Social Media Analytics
11.7.1.3.3. SEO/ Web Analytics
11.7.1.3.4. Targeted Marketing
11.7.1.3.5. Content Marketing
11.7.2. Customer Engagement
11.7.2.1. Personalization/Content Targeting
11.7.2.2. Cross Selling/ Up selling
11.7.2.3. UI Design
11.7.3. Purchase and relation
11.7.3.1. Loyalty Programs
11.7.3.2. Transactions/ Sales
11.7.3.3. Virtual Trials/ Displays
11.7.4. Support Services
11.7.4.1. Chatbot
11.7.4.2. Self-serve tools
11.7.4.3. Digital surveys
11.7.4.4. Case Management
11.8. Spending in Digital Customer Experience and Engagement Solutions Market Size (US$ Bn) Forecast, by Country & Sub-region, 2016 - 2026
11.8.1. The U.S.
11.8.2. Canada
11.8.3. Rest of North America
12. Europe Spending in Digital Customer Experience and Engagement Solutions Market Analysis and Forecast
12.1. Key Findings
12.2. Impact Analysis of Drivers and Restraints
12.3. Spending in Digital Customer Experience and Engagement Solutions Market Size (US$ Bn) Forecast, by Business Type, 2016 - 2026
12.3.1. Business to Business (B2B)
12.3.2. Business to Consumer
12.3.3. Business to Business to Consumer (B2B2C)
12.4. Spending in Digital Customer Experience and Engagement Solutions Market Size (US$ Bn) Forecast, by Touch Points 2016 - 2026
12.4.1. Social media
12.4.2. Gamification
12.4.3. Digital Marketing
12.4.4. Mobility
12.5. Spending in Digital Customer Experience and Engagement Solutions Market Size (US$ Bn) Forecast, by Industry, 2016 - 2026
12.5.1. Banking
12.5.2. Insurance
12.5.3. Manufacturing
12.5.4. Public Sector
12.5.5. Telecommunications
12.5.6. Utilities
12.5.7. Retail and wholesale
12.5.8. Services & Consumers
12.5.9. Transport
12.6. Spending in Digital Customer Experience and Engagement Solutions Market Size (US$ Bn) Forecast, by Enterprise Size, 2016 - 2026
12.6.1. Small Enterprises
12.6.2. Medium Enterprises
12.6.3. Large Enterprises
12.7. Spending in Digital Customer Experience and Engagement Solutions Market Size (US$ Bn) Forecast, by Solution, 2016 - 2026
12.7.1. Customer Awareness
12.7.1.1. Customer data management platforms
12.7.1.2. Customer Analytics
12.7.1.3. Advertising & Marketing
12.7.1.3.1. Email/ Campaign management
12.7.1.3.2. Social Media Analytics
12.7.1.3.3. SEO/ Web Analytics
12.7.1.3.4. Targeted Marketing
12.7.1.3.5. Content Marketing
12.7.2. Customer Engagement
12.7.2.1. Personalization/Content Targeting
12.7.2.2. Cross Selling/ Up selling
12.7.2.3. UI Design
12.7.3. Purchase and relation
12.7.3.1. Loyalty Programs
12.7.3.2. Transactions/ Sales
12.7.3.3. Virtual Trials/ Displays
12.7.4. Support Services
12.7.4.1. Chatbot
12.7.4.2. Self-serve tools
12.7.4.3. Digital surveys
12.7.4.4. Case Management
12.8. Spending in Digital Customer Experience and Engagement Solutions Market Size (US$ Bn) Forecast, by Country & Sub-region, 2016 - 2026
12.8.1. Germany
12.8.2. France
12.8.3. The U.K.
12.8.4. Rest of Europe
13. Asia Pacific Spending in Digital Customer Experience and Engagement Solutions Market Analysis and Forecast
13.1. Key Findings
13.2. Impact Analysis of Drivers and Restraints
13.3. Spending in Digital Customer Experience and Engagement Solutions Market Size (US$ Bn) Forecast, by Business Type, 2016 - 2026
13.3.1. Business to Business (B2B)
13.3.2. Business to Consumer
13.3.3. Business to Business to Consumer (B2B2C)
13.4. Spending in Digital Customer Experience and Engagement Solutions Market Size (US$ Bn) Forecast, by Touch Points 2016 - 2026
13.4.1. Social media
13.4.2. Gamification
13.4.3. Digital Marketing
13.4.4. Mobility
13.5. Spending in Digital Customer Experience and Engagement Solutions Market Size (US$ Bn) Forecast, by Industry, 2016 - 2026
13.5.1. Banking
13.5.2. Insurance
13.5.3. Manufacturing
13.5.4. Public Sector
13.5.5. Telecommunications
13.5.6. Utilities
13.5.7. Retail and wholesale
13.5.8. Services & Consumers
13.5.9. Transport
13.6. Spending in Digital Customer Experience and Engagement Solutions Market Size (US$ Bn) Forecast, by Enterprise Size, 2016 - 2026
13.6.1. Small Enterprises
13.6.2. Medium Enterprises
13.6.3. Large Enterprises
13.7. Spending in Digital Customer Experience and Engagement Solutions Market Size (US$ Bn) Forecast, by Solution, 2016 - 2026
13.7.1. Customer Awareness
13.7.1.1. Customer data management platforms
13.7.1.2. Customer Analytics
13.7.1.3. Advertising & Marketing
13.7.1.3.1. Email/ Campaign management
13.7.1.3.2. Social Media Analytics
13.7.1.3.3. SEO/ Web Analytics
13.7.1.3.4. Targeted Marketing
13.7.1.3.5. Content Marketing
13.7.2. Customer Engagement
13.7.2.1. Personalization/Content Targeting
13.7.2.2. Cross Selling/ Up selling
13.7.2.3. UI Design
13.7.3. Purchase and relation
13.7.3.1. Loyalty Programs
13.7.3.2. Transactions/ Sales
13.7.3.3. Virtual Trials/ Displays
13.7.4. Support Services
13.7.4.1. Chatbot
13.7.4.2. Self-serve tools
13.7.4.3. Digital surveys
13.7.4.4. Case Management
13.8. Spending in Digital Customer Experience and Engagement Solutions Market Size (US$ Bn) Forecast, by Country & Sub-region, 2016 - 2026
13.8.1. China
13.8.2. India
13.8.3. Japan
13.8.4. Rest of Asia Pacific
14. Middle East & Africa (MEA) Spending in Digital Customer Experience and Engagement Solutions Market Analysis and Forecast
14.1. Key Findings
14.2. Impact Analysis of Drivers and Restraints
14.3. Spending in Digital Customer Experience and Engagement Solutions Market Size (US$ Bn) Forecast, by Business Type, 2016 - 2026
14.3.1. Business to Business (B2B)
14.3.2. Business to Consumer (B2C)
14.3.3. Business to Business to Consumer (B2B2C)
14.4. Spending in Digital Customer Experience and Engagement Solutions Market Size (US$ Bn) Forecast, by Touch Points 2016 - 2026
14.4.1. Social media
14.4.2. Gamification
14.4.3. Digital Marketing
14.4.4. Mobility
14.5. Spending in Digital Customer Experience and Engagement Solutions Market Size (US$ Bn) Forecast, by Industry, 2016 - 2026
14.5.1. Banking
14.5.2. Insurance
14.5.3. Manufacturing
14.5.4. Public Sector
14.5.5. Telecommunications
14.5.6. Utilities
14.5.7. Retail and wholesale
14.5.8. Services & Consumers
14.5.9. Transport
14.6. Spending in Digital Customer Experience and Engagement Solutions Market Size (US$ Bn) Forecast, by Enterprise Size, 2016 - 2026
14.6.1. Small Enterprises
14.6.2. Medium Enterprises
14.6.3. Large Enterprises
14.7. Spending in Digital Customer Experience and Engagement Solutions Market Size (US$ Bn) Forecast, by Solution, 2016 - 2026
14.7.1. Customer Awareness
14.7.1.1. Customer data management platforms
14.7.1.2. Customer Analytics
14.7.1.3. Advertising & Marketing
14.7.1.3.1. Email/ Campaign management
14.7.1.3.2. Social Media Analytics
14.7.1.3.3. SEO/ Web Analytics
14.7.1.3.4. Targeted Marketing
14.7.1.3.5. Content Marketing
14.7.2. Customer Engagement
14.7.2.1. Personalization/Content Targeting
14.7.2.2. Cross Selling/ Up selling
14.7.2.3. UI Design
14.7.3. Purchase and relation
14.7.3.1. Loyalty Programs
14.7.3.2. Transactions/ Sales
14.7.3.3. Virtual Trials/ Displays
14.7.4. Support Services
14.7.4.1. Chatbot
14.7.4.2. Self-serve tools
14.7.4.3. Digital surveys
14.7.4.4. Case Management
14.8. Spending in Digital Customer Experience and Engagement Solutions Market Size (US$ Bn) Forecast, by Country & Sub-region, 2016 - 2026
14.8.1. GCC Countries
14.8.2. South Africa
14.8.3. Rest of Middle East & Africa
15. South America Spending in Digital Customer Experience and Engagement Solutions Market Analysis and Forecast
15.1. Key Findings
15.2. Impact Analysis of Drivers and Restraints
15.3. Spending in Digital Customer Experience and Engagement Solutions Market Size (US$ Bn) Forecast, by Business Type, 2016 - 2026
15.3.1. Business to Business (B2B)
15.3.2. Business to Consumer (B2C)
15.3.3. Business to Business to Consumer (B2B2C)
15.4. Spending in Digital Customer Experience and Engagement Solutions Market Size (US$ Bn) Forecast, by Touch Points 2016 - 2026
15.4.1. Social media
15.4.2. Gamification
15.4.3. Digital Marketing
15.4.4. Mobility
15.5. Spending in Digital Customer Experience and Engagement Solutions Market Size (US$ Bn) Forecast, by Industry, 2016 - 2026
15.5.1. Banking
15.5.2. Insurance
15.5.3. Manufacturing
15.5.4. Public Sector
15.5.5. Telecommunications
15.5.6. Utilities
15.5.7. Retail and wholesale
15.5.8. Services & Consumers
15.5.9. Transport
15.6. Spending in Digital Customer Experience and Engagement Solutions Market Size (US$ Bn) Forecast, by Enterprise Size, 2016 - 2026
15.6.1. Small Enterprises
15.6.2. Medium Enterprises
15.6.3. Large Enterprises
15.7. Spending in Digital Customer Experience and Engagement Solutions Market Size (US$ Bn) Forecast, by Solution, 2016 - 2026
15.7.1. Customer Awareness
15.7.1.1. Customer data management platforms
15.7.1.2. Customer Analytics
15.7.1.3. Advertising & Marketing
15.7.1.3.1. Email/ Campaign management
15.7.1.3.2. Social Media Analytics
15.7.1.3.3. SEO/ Web Analytics
15.7.1.3.4. Targeted Marketing
15.7.1.3.5. Content Marketing
15.7.2. Customer Engagement
15.7.2.1. Personalization/Content Targeting
15.7.2.2. Cross Selling/ Up selling
15.7.2.3. UI Design
15.7.3. Purchase and relation
15.7.3.1. Loyalty Programs
15.7.3.2. Transactions/ Sales
15.7.3.3. Virtual Trials/ Displays
15.7.4. Support Services
15.7.4.1. Chatbot
15.7.4.2. Self-serve tools
15.7.4.3. Digital surveys
15.7.4.4. Case Management
15.8. Spending in Digital Customer Experience and Engagement Solutions Market Size (US$ Bn) Forecast, by Country & Sub-region, 2016 - 2026
15.8.1. Brazil
15.8.2. Rest of South America
16. Competition Landscape
16.1. Market Player – Competition Matrix
16.2. Market Share Analysis (%), by Company (2017)
16.3. Company Profiles
16.3.1. Accenture PLC
16.3.1.1. Business Overview
16.3.1.2. Business segment
16.3.1.3. Financial
16.3.1.4. Strategy
16.3.2. Capgemini SE
16.3.2.1. Overview
16.3.2.2. Financial
16.3.2.3. Strategy
16.3.3. Cognizant
16.3.3.1. Overview
16.3.3.2. Financial
16.3.3.3. Strategy
16.3.4. IBM Corporation
16.3.4.1. Overview
16.3.4.2. Financial
16.3.4.3. Strategy
16.3.5. KOFAX INC.
16.3.5.1. Overview
16.3.5.2. Financial
16.3.5.3. Strategy
16.3.6. Liferay Inc.
16.3.6.1. Overview
16.3.6.2. Financial
16.3.6.3. Strategy
16.3.7. MEGA International
16.3.7.1. Overview
16.3.7.2. Financial
16.3.7.3. Strategy
16.3.8. NCR Corporation
16.3.8.1. Overview
16.3.8.2. Financial
16.3.8.3. Strategy
16.3.9. Orange Business Services
16.3.9.1. Overview
16.3.9.2. Financial
16.3.9.3. Strategy
16.3.10. SAS Institute Inc.
16.3.10.1. Overview
16.3.10.2. Financial
16.3.10.3. Strategy
16.3.11. Tata Consultancy Services Limited
16.3.11.1. Overview
16.3.11.2. Financial
16.3.11.3. Strategy
16.3.12. Tieto Corporation
16.3.12.1. Overview
16.3.12.2. Financial
16.3.12.3. Strategy
16.3.13. Zendesk. Inc.
16.3.13.1. Overview
16.3.13.2. Financial
16.3.13.3. Strategy
17. Key Takeaways
List of Tables
Table 1: North America ICT Spending (US$ Bn)
Table 2: Europe ICT Spending (US$ Bn)
Table 3: Asia Pacific ICT Spending (US$ Bn)
Table 4: MEA ICT Spending (US$ Bn)
Table 5: South America ICT Spending (US$ Bn)
Table 6: Regulatory Framework
Table 7: Regulatory Framework
Table 8: Global Spending in Digital Customer Experience and Engagement Solutions Market Revenue (US$ Bn) Forecast, by Business Type, 2016 - 2026
Table 9: Global Spending in Digital Customer Experience and Engagement Solutions Market Revenue (US$ Bn) Forecast, by Touch Points, 2016 - 2026
Table 10: Global Spending in Digital Customer Experience and Engagement Solutions Market Revenue (US$ Bn) Forecast, by Industry, 2016 - 2026
Table 11: Global Spending in Digital Customer Experience and Engagement Solutions Market Revenue (US$ Bn) Forecast, by Enterprise Size, 2016 - 2026
Table 12: Global Spending in Digital Customer Experience and Engagement Solutions Market Revenue (US$ Bn) Forecast, by Solutions, 2016 - 2026
Table 13: Global Spending in Digital Customer Experience and Engagement Solutions Market Revenue (US$ Bn) Forecast, by Solutions, 2016 - 2026
Table 14: Global Spending in Digital Customer Experience and Engagement Solutions Market Revenue (US$ Bn) Forecast, by Solutions, 2016 - 2026
Table 15: Global Spending in Digital Customer Experience and Engagement Solutions Market Revenue (US$ Bn) Forecast, by Region, 2016 - 2026
Table 16: North America Spending in Digital Customer Experience and Engagement Solutions Market Revenue (US$ Bn) Forecast, by Business Type, 2016 - 2026
Table 17: North America Spending in Digital Customer Experience and Engagement Solutions Market Revenue (US$ Bn) Forecast, by Touch Points, 2016 - 2026
Table 18: North America Spending in Digital Customer Experience and Engagement Solutions Market Revenue (US$ Bn) Forecast, by Industry, 2016 - 2026
Table 19: North America Spending in Digital Customer Experience and Engagement Solutions Market Revenue (US$ Bn) Forecast, by Enterprise Size, 2016 - 2026
Table 20: North America Spending in Digital Customer Experience and Engagement Solutions Market Revenue (US$ Bn) Forecast, by Solutions, 2016 - 2026
Table 21: North America Spending in Digital Customer Experience and Engagement Solutions Market Revenue (US$ Bn) Forecast, by Solutions, 2016 - 2026
Table 22: North America Spending in Digital Customer Experience and Engagement Solutions Market Revenue (US$ Bn) Forecast, by Solutions, 2016 - 2026
Table 23: North America Spending in Digital Customer Experience and Engagement Solutions Market Revenue (US$ Bn) Forecast, by Country, 2016 - 2026
Table 24: Europe Spending in Digital Customer Experience and Engagement Solutions Market Revenue (US$ Bn) Forecast, by Business Type, 2016 - 2026
Table 25: Europe Spending in Digital Customer Experience and Engagement Solutions Market Revenue (US$ Bn) Forecast, by Touch Points, 2016 - 2026
Table 26: Europe Spending in Digital Customer Experience and Engagement Solutions Market Revenue (US$ Bn) Forecast, by Industry, 2016 - 2026
Table 27: Europe Spending in Digital Customer Experience and Engagement Solutions Market Revenue (US$ Bn) Forecast, by Enterprise Size, 2016 - 2026
Table 28: Europe Spending in Digital Customer Experience and Engagement Solutions Market Revenue (US$ Bn) Forecast, by Solutions, 2016 - 2026
Table 29: Europe Spending in Digital Customer Experience and Engagement Solutions Market Revenue (US$ Bn) Forecast, by Solutions, 2016 - 2026
Table 30: Europe Spending in Digital Customer Experience and Engagement Solutions Market Revenue (US$ Bn) Forecast, by Solutions, 2016 - 2026
Table 31: Europe Spending in Digital Customer Experience and Engagement Solutions Market Revenue (US$ Bn) Forecast, by Enterprise Country, 2016 - 2026
Table 32: Asia Pacific Spending in Digital Customer Experience and Engagement Solutions Market Revenue (US$ Bn) Forecast, by Business Type, 2016 - 2026
Table 33: Asia Pacific Spending in Digital Customer Experience and Engagement Solutions Market Revenue (US$ Bn) Forecast, by Touch Points, 2016 - 2026
Table 34: Asia Pacific Spending in Digital Customer Experience and Engagement Solutions Market Revenue (US$ Bn) Forecast, by Industry, 2016 - 2026
Table 35: Asia Pacific Spending in Digital Customer Experience and Engagement Solutions Market Revenue (US$ Bn) Forecast, by Enterprise Size, 2016 - 2026
Table 36: Asia Pacific Spending in Digital Customer Experience and Engagement Solutions Market Revenue (US$ Bn) Forecast, by Solutions, 2016 - 2026
Table 37: Asia Pacific Spending in Digital Customer Experience and Engagement Solutions Market Revenue (US$ Bn) Forecast, by Solutions, 2016 - 2026
Table 38: Asia Pacific Spending in Digital Customer Experience and Engagement Solutions Market Revenue (US$ Bn) Forecast, by Solutions, 2016 - 2026
Table 39: Asia Pacific Spending in Digital Customer Experience and Engagement Solutions Market Revenue (US$ Bn) Forecast, by Enterprise Country, 2016 - 2026
Table 40: MEA Spending in Digital Customer Experience and Engagement Solutions Market Revenue (US$ Bn) Forecast, by Business Type, 2016 - 2026
Table 41: MEA Spending in Digital Customer Experience and Engagement Solutions Market Revenue (US$ Bn) Forecast, by Touch Points, 2016 - 2026
Table 42: MEA Spending in Digital Customer Experience and Engagement Solutions Market Revenue (US$ Bn) Forecast, by Industry, 2016 - 2026
Table 43: MEA Spending in Digital Customer Experience and Engagement Solutions Market Revenue (US$ Bn) Forecast, by Enterprise Size, 2016 - 2026
Table 44: MEA Spending in Digital Customer Experience and Engagement Solutions Market Revenue (US$ Bn) Forecast, by Solutions, 2016 - 2026
Table 45: MEA Spending in Digital Customer Experience and Engagement Solutions Market Revenue (US$ Bn) Forecast, by Solutions, 2016 - 2026
Table 46: MEA Spending in Digital Customer Experience and Engagement Solutions Market Revenue (US$ Bn) Forecast, by Solutions, 2016 - 2026
Table 47: MEA Spending in Digital Customer Experience and Engagement Solutions Market Revenue (US$ Bn) Forecast, by Enterprise Country, 2016 - 2026
Table 48: South America Spending in Digital Customer Experience and Engagement Solutions Market Revenue (US$ Bn) Forecast, by Business Type, 2016 - 2026
Table 49: South America Spending in Digital Customer Experience and Engagement Solutions Market Revenue (US$ Bn) Forecast, by Touch Points, 2016 - 2026
Table 50: South America Spending in Digital Customer Experience and Engagement Solutions Market Revenue (US$ Bn) Forecast, by Industry, 2016 - 2026
Table 51: South America Spending in Digital Customer Experience and Engagement Solutions Market Revenue (US$ Bn) Forecast, by Enterprise Size, 2016 - 2026
Table 52: South America Spending in Digital Customer Experience and Engagement Solutions Market Revenue (US$ Bn) Forecast, by Solutions, 2016 - 2026
Table 53: South America Spending in Digital Customer Experience and Engagement Solutions Market Revenue (US$ Bn) Forecast, by Solutions, 2016 - 2026
Table 54: South America Spending in Digital Customer Experience and Engagement Solutions Market Revenue (US$ Bn) Forecast, by Solutions, 2016 - 2026
Table 55: South America Spending in Digital Customer Experience and Engagement Solutions Market Revenue (US$ Bn) Forecast, by Enterprise Country, 2016 - 2026
List of Figures
Figure 1: Spending in Digital Customer Experience and Engagement Solutions Market: Global Industry Analysis, Size, Share, Growth, Trends and Forecast, 2018 – 2026
Figure 2: Top Economies GDP Landscape
Figure 3: Gross Domestic Product (GDP) per Capita; Analysis (1/2) (US$ Tn), By Major Countries, 2012-2017
Figure 4: Global Spending in Digital Customer Experience and Engagement Solutions Market Size (US$ Bn) and Historic Growth, 2012 – 2017
Figure 5: Global Spending in Digital Customer Experience and Engagement Solutions Market Size (US$ Bn) and Forecast Growth, 2018 – 2016
Figure 6: Global Market Opportunity Assessment, by Business Type
Figure 7: Global Market Opportunity Assessment, by Touch Points
Figure 8: North America Market Opportunity Assessment, by Industry
Figure 9: North America Market Opportunity Assessment, by Enterprise Size
Figure 10: Global Market Opportunity Assessment, by Solutions
Figure 11: Global Market Opportunity Assessment, by Region
Figure 12: Global Spending in Digital Customer Experience and Engagement Solutions Market Value Share (Value %), by Business Type, 2018 & 2026
Figure 13: Global Spending in Digital Customer Experience and Engagement Solutions Market Value Share (Value %), by Touch Points, 2018 & 2026
Figure 14: Global Spending in Digital Customer Experience and Engagement Solutions Market Value Share (Value %), by Industry, 2018 & 2026
Figure 15: Global Spending in Digital Customer Experience and Engagement Solutions Market Value Share (Value %), by Enterprise Size, 2018 & 2026
Figure 16: Global Spending in Digital Customer Experience and Engagement Solutions Market Value Share (Value %), by Solution, 2018 & 2026
Figure 17: Global Spending in Digital Customer Experience and Engagement Solutions Market Value Share (Value %), by Region, 2018 & 2026
Figure 18: North America Spending in Digital Customer Experience and Engagement Solutions Market Share Analysis, by Business Type, 2018 and 2026
Figure 19: North America Spending in Digital Customer Experience and Engagement Solutions Market Share Analysis, by Touch Points, 2018 and 2026
Figure 20: North America Spending in Digital Customer Experience and Engagement Solutions Market Share Analysis, by Industry, 2018 and 2026
Figure 21: North America Spending in Digital Customer Experience and Engagement Solutions Market Share Analysis, by Enterprise Size, 2018 and 2026
Figure 22: North America Spending in Digital Customer Experience and Engagement Solutions Market Share Analysis, by Solution, 2018 and 2026
Figure 23: North America Spending in Digital Customer Experience and Engagement Solutions Market Share Analysis, by Country, 2018 and 2026
Figure 24: Europe Spending in Digital Customer Experience and Engagement Solutions Market Share Analysis, by Business Type, 2018 and 2026
Figure 25: Europe Spending in Digital Customer Experience and Engagement Solutions Market Share Analysis, by Touch Points, 2018 and 2026
Figure 26: Europe Spending in Digital Customer Experience and Engagement Solutions Market Share Analysis, by Industry, 2018 and 2026
Figure 27: Europe Spending in Digital Customer Experience and Engagement Solutions Market Share Analysis, by Enterprise Size, 2018 and 2026
Figure 28: Europe Spending in Digital Customer Experience and Engagement Solutions Market Share Analysis, by Solution, 2018 and 2026
Figure 29: Europe Spending in Digital Customer Experience and Engagement Solutions Market Share Analysis, by Country, 2018 and 2026
Figure 30: Asia Pacific Spending in Digital Customer Experience and Engagement Solutions Market Share Analysis, by Business Type, 2018 and 2026
Figure 31: Asia Pacific Spending in Digital Customer Experience and Engagement Solutions Market Share Analysis, by Touch Points, 2018 and 2026
Figure 32: Asia Pacific Spending in Digital Customer Experience and Engagement Solutions Market Share Analysis, by Industry, 2018 and 2026
Figure 33: Asia Pacific Spending in Digital Customer Experience and Engagement Solutions Market Share Analysis, by Enterprise Size, 2018 and 2026
Figure 34: Asia Pacific Spending in Digital Customer Experience and Engagement Solutions Market Share Analysis, by Solution, 2018 and 2026
Figure 35: Asia Pacific Spending in Digital Customer Experience and Engagement Solutions Market Share Analysis, by Country, 2018 and 2026
Figure 36: MEA Spending in Digital Customer Experience and Engagement Solutions Market Share Analysis, by Business Type, 2018 and 2026
Figure 37: MEA Spending in Digital Customer Experience and Engagement Solutions Market Share Analysis, by Touch Points, 2018 and 2026
Figure 38: MEA Spending in Digital Customer Experience and Engagement Solutions Market Share Analysis, by Industry, 2018 and 2026
Figure 39: MEA Spending in Digital Customer Experience and Engagement Solutions Market Share Analysis, by Enterprise Size, 2018 and 2026
Figure 40: MEA Spending in Digital Customer Experience and Engagement Solutions Market Share Analysis, by Solution, 2018 and 2026
Figure 41: MEA Spending in Digital Customer Experience and Engagement Solutions Market Share Analysis, by Country, 2018 and 2026
Figure 42: South America Spending in Digital Customer Experience and Engagement Solutions Market Share Analysis, by Business Type, 2018 and 2026
Figure 43: South America Spending in Digital Customer Experience and Engagement Solutions Market Share Analysis, by Touch Points, 2018 and 2026
Figure 44: South America Spending in Digital Customer Experience and Engagement Solutions Market Share Analysis, by Industry, 2018 and 2026
Figure 45: South America Spending in Digital Customer Experience and Engagement Solutions Market Share Analysis, by Enterprise Size, 2018 and 2026
Figure 46: South America Spending in Digital Customer Experience and Engagement Solutions Market Share Analysis, by Solution, 2018 and 2026
Figure 47: South America Spending in Digital Customer Experience and Engagement Solutions Market Share Analysis, by Country, 2018 and 2026
Figure 48: Accenture PLC Breakdown of Net Revenue, by Region, 2018
Figure 49: Accenture PLC Revenue (US$ Bn) & Y-o-Y Growth (%), 2016–2018
Figure 50: CapgeminiBreakdown of Net Revenue, by Region, 2017
Figure 51: CapgeminiRevenue (US$ Bn) & Y-o-Y Growth (%), 2015–2017
Figure 52: IBM Corporation Breakdown of Net Revenue, by Region, 2017
Figure 53: IBM Corporation Revenue (US$ Bn) & Y-o-Y Growth (%), 2015–2017
Figure 54: Tata Consultancy Services Limited Breakdown of Net Revenue, by Region, 2018
Figure 55: Tata Consultancy Services Limited Revenue (US$ Bn) & Y-o-Y Growth (%), 2016–2018
Figure 56: Zendesk, Inc. Breakdown of Net Revenue, by Region, 2018
Figure 57: Zendesk, Inc. Revenue (US$ Bn) & Y-o-Y Growth (%), 2016–2018
Figure 58: Cognizant Breakdown of Net Revenue, by Region, 2017
Figure 59: Cognizant Revenue (US$ Bn) & Y-o-Y Growth (%), 2015–2017
Figure 60: SAS Institute Inc. Breakdown of Net Revenue, by Region, 2018
Figure 61: SAS Institute Inc. Revenue (US$ Bn) & Y-o-Y Growth (%), 2015–2017
Figure 62: Orange Business Services Breakdown of Net Revenue, by Region, 2017
Figure 63: Orange Business Services Revenue (US$ Bn) & Y-o-Y Growth (%), 2015–2017
Figure 64: Tieto Corporation Breakdown of Net Sales, By Country 2018
Figure 65: Tieto Corporation Revenue (US$ Bn) & Y-o-Y Growth (%), 2016–2018
Figure 66: NCR Corporation Breakdown of Net Sales, By Geography, 2017
Figure 67: NCR Corporation Revenue (US$ Bn) & Y-o-Y Growth (%), 2015–2017
Copyright © Transparency Market Research, Inc. All Rights reserved
Trust Online

Spending In Digital Customer Experience and Engagement Solutions Market