
Reports
Reports
While the mining sector continues to face the brunt of global recession downturns, mining companies find the need to determine ways to sustain in a market that is also categorized by a widening talent gap, rising stakeholder demands, and deteriorating access to key aspects such as water and energy. Today’s scenario has made it vital for miners to concentrate on differentiating their business models to generate long-term value, with which they can not only attract more investors but also generate significant profits. Smart technology incorporation continues to remain a go-to approach in order to attain this success. Rise in the adoption of technology, globally, is not just changing the demand dynamics of some commodities, but is also modifying the traditional approach to mining.
The deployment of smart mining solutions allows mining companies to boost production efficiency by using real-time monitoring and communication, and reduce labor expense. In a recently published extensive study on the smart mining solution market by Transparency Market Research (TMR), analysts showcase a positive viewpoint of the industry. The study unveils the key elements driving industry growth, while listing the developments made by market competitors.
Since the beginning of civilization, individuals have utilized mining techniques to extract minerals from the surface of the Earth. Discoveries have highlighted the extraction of flint pebbles from deposits in Britain and France, back in the New Stone Age. In ancient times, as far back as 3000 BCE, Egyptians mined copper. In the initial stage, mining was slow-paced, hazardous, and involved the use of heavy and complex equipment. However, with progress in time, the mining industry has witnessed the development of safe and accurate methods of discovering and mining substances found in the Earth. Mining technology has made tremendous advances in the past three decades, in wake of the Industry 4.0 Revolution.
With the rising adoption of sensor technology, Industrial Internet of Things (IIoT), and smart devices and gadgets, the demand for smart mining solutions has risen tremendously, translating into significant market numbers. The smart mining solution market is expected to reach a valuation of ~ US$ 9.2 Bn in 2019. Continuous innovations in technology and the growing applicability of smart mining solutions are expected to drive the growth of the market, registering a CAGR of 11.5% throughout the period of forecast.
Artificial Intelligence: Disrupting the Smart Mining Space
Technologies such as Artificial Intelligence are not just bringing transformations across several industries, but also laying the ground for the mining sector, for becoming a digitally disrupted and supported industry. Apart from offering real-time tracking, predictive maintenance for equipment, and environmental and emission monitoring, AI-enabled systems and solutions are driving operational excellence and safety. Protecting fatal open-cast accidents on mining sites is made possible with such futuristic systems.
Autonomous Vehicles: Changing the Face of Future Mining Capabilities
Autonomous and remote-controlled vehicles are becoming the new face of the automotive sector. Beyond this, their significance continues to grow across the mining space, wherein, miners would be able to operate vehicles remotely without human intervention. Another significant development witnessed across the mining sector is the deployment of drone solutions for both, surface and underground mining.
Smart Wearable Devices: Promise for Miners’ Safety
Mining safety continues to remain a major concern for mine operators, compelling them to adopt effective tools that can help improve on the safety quotient. The Internet of Things provides a bunch of alternatives in the form of wearable safety technology, including glasses, smart jackets, and helmets to ensure the safety of miners.
Although the smart mining solution market continues to proliferate, certain aspects are likely to impact the market negatively. High expenses associated with deployment technology, unavailability of adequate infrastructure, and lack of skilled labor workforce to run smart technologies are likely to impede market growth.
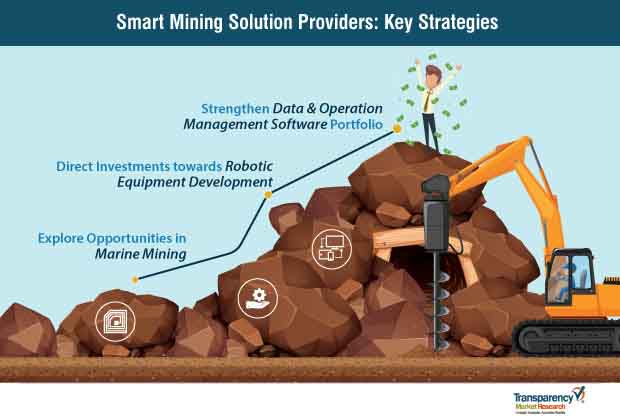
Key Strategies for Smart Mining Solution Providers
Strengthen Data & Operation Management Software Portfolio
Data and operation management plays a crucial role in the mining industry, as major emphasis is given to achieving operational efficiency. The integration of mine operations with data and operation management solutions enables workforces to connect with equipment in real time, and perform automated execution, predictive production scheduling, and respond to changes within seconds. With significant demand for such solutions, leading smart mining solution market players strategize to expand this portfolio.
Direct Investments towards Robotic Equipment Development
Optimal performance, reduced operational costs, and greater efficiency in functioning, all associated with the use of robotic equipment, are capturing the attention of miners. Smart mining solution providers are, therefore, ruminating over the profitable avenues associated with robotic trucks, further directing investments towards the development of the same. Robotic or self-driven trucks have been successfully used across regions such as Australia over the past few years, and are presently employed in North America and Latin America.
Explore Opportunities in Marine Mining
There has been a significant rise in interest for extracting deep sea mineral deposits over the past couple of years. This is attributed to the depletion of the terrestrial deposits of metals. Moreover, the increasing demand for metals for the production of electronic devices and green technologies has resulted in the rise in marine mining activities. As smart mining solutions ease processes across deep-sea mining, resulting in lower environmental impact, significant opportunities are witnessed for smart mining solution market competitors.
Mapping the Competitive Landscape
In March 2019, ABB launched a digital portfolio - ABB Ability MineOptimize. This system has digitalization at its core, and connects all automation, electrification, and digital offerings to optimize all the processes, ranging from designing and building to operation and services in any underground or open-pit mine and minerals processing plant.
In 2018, Hexagon’s mining division acquired Guardvant, a provider of integrated safety solutions for the mining sector. This acquisition strengthens Hexagon’s safety portfolio.
In July 2018, Newmont Mining Corporation and Caterpillar entered into a collaboration agreement to improve automation technology for underground hard rock mining vehicles. The collaboration aims at enhancing the existing technology, and accelerate the validation and deployment of new features.
The smart mining solution market consists of several established players, with a high concentration of small- and medium-sized players. Technology or service providers operating in the smart mining solution market comprise companies engaged in developing hardware and software solutions and services for the mining industry. The pricing of products and services or brand image and technological processes of manufacturers play a vital role in the smart mining solution market. Collaborations between mining companies and smart mining solution providers are majorly witnessed. Apart from this, companies continue to focus on incorporating cutting-edge technology in their offerings.
TMR Analysts Weigh in on Market Opportunities
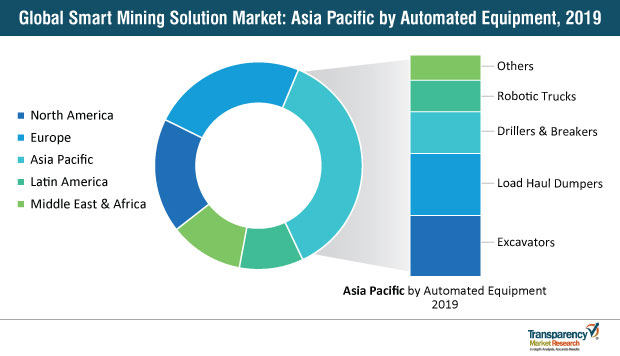
Key focus on increasing production, improvement in safety, process optimization and automation, cost reduction, and compliance with environment-related regulations are driving the use of automated equipment across the mining space. Owing to this, TMR analysts cite the high growth potential in the smart mining solution industry. Asia Pacific is the leading region in the global smart mining solution market, and is likely to offer substantial opportunities to vendors and service providers involved in the development and delivery of hardware and software platforms for smart mining, during the forecast period. Rise in the demand for metals and minerals from various sectors, and strong growth of the manufacturing sector in the region, particularly in China, have laid the foundation for the smart mining solution business in Asia Pacific. New players could consider expansion across this region. Increase in international mandates and increased focus on the development safe mining infrastructure, coupled with the incorporation of automation technologies, are major factors assisting new players in entering the smart mining solution market.
Smart Mining Solutions
Rise in Demand for Metal in Manufacturing, Construction, and Other Industries
Lack of Skilled Workforce Likely to Hamper the Smart Mining Solution Market
Increasing Interest in Deep Sea Mineral Deposits
Recent Developments, Expansions, Acquisitions, and New Contracts
Asia Pacific Anticipated to be Highly Lucrative in the Global Smart Mining Solution Market
Large Players Dominating the Global Smart Mining Solution Market
1. Preface
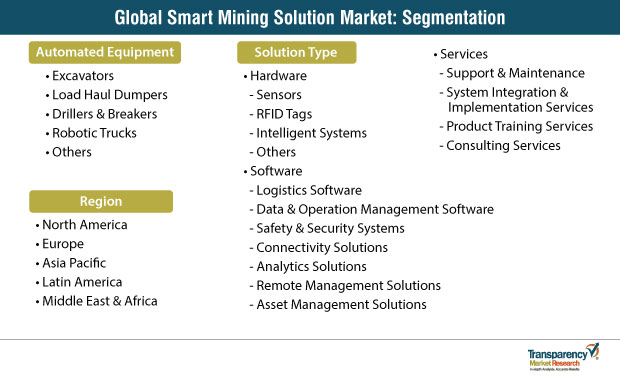
1.1. Report Scope and Market Segmentation
1.2. Research Highlights
2. Assumptions and Research Methodology
2.1. Assumptions and Acronyms Used
2.2. Research Methodology
3. Executive Summary: Global Smart Mining Solution Market
3.1. Market Value, Indicative (US$ Mn)
3.2. Top Three Trends
4. Market Overview
4.1. Product Overview
4.2. Market Indicators
5. Market Dynamics
5.1. Drivers and Restraints Snapshot Analysis
5.1.1.1. Drivers
5.1.1.2. Restraints
5.1.1.3. Opportunities
5.2. Global Smart Mining Solution Market Value (US$ Mn) Forecast, 2018-2027
5.3. Porter’s Five Forces Analysis
5.3.1. Threat of Substitutes
5.3.2. Bargaining Power of Buyers
5.3.3. Bargaining Power of Suppliers
5.3.4. Threat of New Entrants
5.3.5. Degree of Competition
5.4. Regulatory Scenario
5.5. Value Chain Analysis
6. Global Smart Mining Solution Market Volume (Units) and Value (US$ Mn) Analysis, by Automated Equipment
6.1. Key Findings and Introduction
6.2. Global Smart Mining Solution Market Volume (Units) and Value (US$ Mn) Forecast, by Automated Equipment, 2018–2027
6.2.1. Global Smart Mining Solution Market Volume (Units) and Value (US$ Mn) Forecast, by Excavators, 2018–2027
6.2.2. Global Smart Mining Solution Market Volume (Units) and Value (US$ Mn) Forecast, by Load Haul Dumpers, 2018–2027
6.2.3. Global Smart Mining Solution Market Volume (Units) and Value (US$ Mn) Forecast, by Drillers & Breakers, 2018–2027
6.2.4. Global Smart Mining Solution Market Volume (Units) and Value (US$ Mn) Forecast, by Robotic Trucks, 2018–2027
6.2.5. Global Smart Mining Solution Market Volume (Units) and Value (US$ Mn) Forecast, by Others, 2018–2027
6.3. Global Smart Mining Solution Market Attractiveness Analysis, by Automated Equipment
7. Global Smart Mining Solution Market Value (US$ Mn) Analysis, by Solution Type
7.1. Key Findings and Introduction
7.2. Global Smart Mining Solution Market Value (US$ Mn) Forecast, by Solution Type, 2018–2027
7.2.1. Global Smart Mining Solution Market Value (US$ Mn) Forecast, by Hardware, 2018–2027
7.2.1.1. Global Smart Mining Solution Market Value (US$ Mn) Forecast, by Sensors, 2018–2027
7.2.1.2. Global Smart Mining Solution Market Value (US$ Mn) Forecast, by RFID Tags, 2018–2027
7.2.1.3. Global Smart Mining Solution Market Value (US$ Mn) Forecast, by Intelligent Systems, 2018–2027
7.2.1.4. Global Smart Mining Solution Market Value (US$ Mn) Forecast, by Others, 2018–2027
7.2.2. Global Smart Mining Solution Market Value (US$ Mn) Forecast, by Electrical & Software, 2018–2027
7.2.2.1. Global Smart Mining Solution Market Value (US$ Mn) Forecast, by Logistics Software, 2018–2027
7.2.2.2. Global Smart Mining Solution Market Value (US$ Mn) Forecast, by Data & Operation Management Software, 2018–2027
7.2.2.3. Global Smart Mining Solution Market Value (US$ Mn) Forecast, by Safety & Security Systems, 2018–2027
7.2.2.4. Global Smart Mining Solution Market Value (US$ Mn) Forecast, by Connectivity Solutions, 2018–2027
7.2.2.5. Global Smart Mining Solution Market Value (US$ Mn) Forecast, by Analytics Solutions, 2018–2027
7.2.2.6. Global Smart Mining Solution Market Value (US$ Mn) Forecast, by Remote Management Solutions, 2018–2027
7.2.2.7. Global Smart Mining Solution Market Value (US$ Mn) Forecast, by Asset Management Solutions, 2018–2027
7.2.3. Global Smart Mining Solution Market Value (US$ Mn) Forecast, by Services, 2018–2027
7.2.3.1. Global Smart Mining Solution Market Value (US$ Mn) Forecast, by Support & Maintenance, 2018–2027
7.2.3.2. Global Smart Mining Solution Market Value (US$ Mn) Forecast, by System Integration & Implementation Services, 2018–2027
7.2.3.3. Global Smart Mining Solution Market Value (US$ Mn) Forecast, by Product Training Services, 2018–2027
7.2.3.4. Global Smart Mining Solution Market Value (US$ Mn) Forecast, by Consulting Services, 2018–2027
7.3. Global Smart Mining Solution Market Attractiveness Analysis, by Solution Type
8. Global Smart Mining Solution Market Analysis, by Region
8.1. Key Findings
8.2. Global Smart Mining Solution Market Value (US$ Mn) Forecast, by Region
8.2.1. North America
8.2.2. Europe
8.2.3. Asia Pacific
8.2.4. Latin America
8.2.5. Middle East & Africa
8.3. Global Smart Mining Solution Market Attractiveness Analysis, by Region
9. North America Smart Mining Solution Market Overview
9.1. Key Findings
9.2. North America Smart Mining Solution Market Volume (Units) and Value (US$ Mn) Forecast, by Automated Equipment, 2018–2027
9.3. North America Smart Mining Solution Market Value (US$ Mn) Forecast, by Solution Type, 2018–2027
9.4. North America Smart Mining Solution Market Value (US$ Mn) Forecast, by Country
9.4.1. U.S. Smart Mining Solution Market Volume (Units) and Value (US$ Mn) Forecast, by Automated Equipment, 2018–2027
9.4.2. U.S. Smart Mining Solution Market Value (US$ Mn) Forecast, by Solution Type, 2018–2027
9.4.3. Canada Smart Mining Solution Market Volume (Units) and Value (US$ Mn) Forecast, by Automated Equipment, 2018–2027
9.4.4. Canada Smart Mining Solution Market Value (US$ Mn) Forecast, by Solution Type, 2018–2027
9.5. North America Smart Mining Solution Market Attractiveness Analysis, by Automated Equipment
9.6. North America Smart Mining Solution Market Attractiveness Analysis, by Solution Type
9.7. North America Smart Mining Solution Market Attractiveness Analysis, by Country
10. Europe Smart Mining Solution Market Overview
10.1. Key Findings
10.2. Europe Smart Mining Solution Market Volume (Units) and Value (US$ Mn) Forecast, by Automated Equipment, 2018–2027
10.3. Europe Smart Mining Solution Market Value (US$ Mn) Forecast, by Solution Type, 2018–2027
10.4. Europe Smart Mining Solution Market Value (US$ Mn) and Forecast, by Country and Sub-region
10.4.1. France Smart Mining Solution Market Volume (Units) and Value (US$ Mn) Forecast, by Automated Equipment, 2018–2027
10.4.2. France Smart Mining Solution Market Value (US$ Mn) Forecast, by Solution Type, 2018–2027
10.4.3. Germany Smart Mining Solution Market Volume (Units) and Value (US$ Mn) Forecast, by Automated Equipment, 2018–2027
10.4.4. Germany Smart Mining Solution Market Value (US$ Mn) Forecast, by Solution Type, 2018–2027
10.4.5. Rest of Europe Smart Mining Solution Market Volume (Units) and Value (US$ Mn) Forecast, by Automated Equipment, 2018–2027
10.4.6. Rest of Europe Smart Mining Solution Market Value (US$ Mn) Forecast, by Solution Type, 2018–2027
10.5. Europe Smart Mining Solution Market Attractiveness Analysis, by Automated Equipment
10.6. Europe Smart Mining Solution Market Attractiveness Analysis, by Solution Type
10.7. Europe Smart Mining Solution Market Attractiveness Analysis, by Country and Sub-region
11. Asia Pacific Smart Mining Solution Market Overview
11.1. Key Findings
11.2. Asia Pacific Smart Mining Solution Market Volume (Units) and Value (US$ Mn) Forecast, by Automated Equipment, 2018–2027
11.3. Asia Pacific Smart Mining Solution Market Value (US$ Mn) Forecast, by Solution Type, 2018–2027
11.4. Asia Pacific Smart Mining Solution Market Value (US$ Mn) Forecast, by Country and Sub-region
11.4.1. China Smart Mining Solution Market Volume (Units) and Value (US$ Mn) Forecast, by Automated Equipment, 2018–2027
11.4.2. China Smart Mining Solution Market Value (US$ Mn) Forecast, by Solution Type, 2018–2027
11.4.3. India Smart Mining Solution Market Value (US$ Mn) Forecast, by Automated Equipment
11.4.4. India Smart Mining Solution Market Value (US$ Mn) Forecast, by Solution Type, 2018–2027
11.4.5. Rest of Asia Pacific Smart Mining Solution Market Value (US$ Mn) Forecast, by Automated Equipment
11.4.6. Rest of Asia Pacific Smart Mining Solution Market Value (US$ Mn) Forecast, by Solution Type, 2018–2027
11.5. Asia Pacific Smart Mining Solution Market Attractiveness Analysis, by Automated Equipment
11.6. Asia Pacific Smart Mining Solution Market Attractiveness Analysis, by Solution Type
11.7. Asia Pacific Smart Mining Solution Market Attractiveness Analysis, by Country and Sub-region
12. Latin America Smart Mining Solution Market Overview
12.1. Key Findings
12.2. Latin America Smart Mining Solution Market Volume (Units) and Value (US$ Mn) Forecast, by Automated Equipment, 2018–2027
12.3. Latin America Smart Mining Solution Market Value (US$ Mn) Forecast, by Solution Type, 2018–2027
12.4. Latin America Smart Mining Solution Market Value (US$ Mn) Forecast, by Country and Sub-region
12.4.1. Brazil Smart Mining Solution Market Volume (Units) and Value (US$ Mn) Forecast, by Automated Equipment, 2018–2027
12.4.2. Brazil Smart Mining Solution Market Value (US$ Mn) Forecast, by Solution Type, 2018–2027
12.4.3. Mexico Smart Mining Solution Market Volume (Units) and Value (US$ Mn) Forecast, by Automated Equipment, 2018–2027
12.4.4. Mexico Smart Mining Solution Market Value (US$ Mn) Forecast, by Solution Type, 2018–2027
12.4.5. Rest of Latin America Smart Mining Solution Market Volume (Units) and Value (US$ Mn) Forecast, by Automated Equipment, 2018–2027
12.4.6. Rest of Latin America Smart Mining Solution Market Value (US$ Mn) Forecast, by Solution Type, 2018–2027
12.5. Latin America Smart Mining Solution Market Attractiveness Analysis, by Automated Equipment
12.6. Latin America Smart Mining Solution Market Attractiveness Analysis, by Solution Type
12.7. Latin America Smart Mining Solution Market Attractiveness Analysis, by Country and Sub-region
13. Middle East & Africa Smart Mining Solution Market Overview
13.1. Key Findings
13.2. Middle East & Africa Smart Mining Solution Market Volume (Units) and Value (US$ Mn) Forecast, by Automated Equipment, 2018–2027
13.3. Middle East & Africa Smart Mining Solution Market Value (US$ Mn) Forecast, by Solution Type, 2018–2027
13.4. Middle East & Africa Smart Mining Solution Market Value (US$ Mn) Forecast, by Country and Sub-region
13.4.1. GCC Smart Mining Solution Market Volume (Units) and Value (US$ Mn) Forecast, by Automated Equipment, 2018–2027
13.4.2. GCC Smart Mining Solution Market Value (US$ Mn) Forecast, by Solution Type, 2018–2027
13.4.3. South Africa Smart Mining Solution Market Volume (Units) and Value (US$ Mn) Forecast, by Automated Equipment, 2018–2027
13.4.4. South Africa Smart Mining Solution Market Value (US$ Mn) Forecast, by Solution Type, 2018–2027
13.4.5. Rest of Middle East & Africa Smart Mining Solution Market Volume (Units) and Value (US$ Mn) Forecast, by Automated Equipment, 2018–2027
13.4.6. Rest of Middle East & Africa Smart Mining Solution Market Value (US$ Mn) Forecast, by Solution Type, 2018–2027
13.5. Middle East & Africa Smart Mining Solution Market Attractiveness Analysis, by Automated Equipment
13.6. Middle East & Africa Smart Mining Solution Market Attractiveness Analysis, by Solution Type
13.7. Middle East & Africa Smart Mining Solution Market Attractiveness Analysis, by Country and Sub-region
14. Competition Landscape
14.1. Global Smart Mining Solution Market Share Analysis, by Company (2018)
14.2. Competition Matrix
14.2.1. Atlas Copco
14.2.2. Caterpillar Inc.
14.2.3. Hitachi Construction Machinery Co., Ltd.
14.2.4. Komatsu Ltd.
14.3. Company Profiles
14.3.1. Rockwell Automation, Inc.
14.3.1.1. Company Details
14.3.1.2. Company Description
14.3.1.3. Business Overview
14.3.1.4. Financial Details
14.3.1.5. Strategic Overview
14.3.2. SAP SE
14.3.2.1. Company Details
14.3.2.2. Company Description
14.3.2.3. Business Overview
14.3.2.4. Financial Details
14.3.2.5. Strategic Overview
14.3.3. Trimble Navigation Limited
14.3.3.1. Company Details
14.3.3.2. Company Description
14.3.3.3. Business Overview
14.3.3.4. Financial Details
14.3.3.5. Strategic Overview
14.3.4. Hexagon AB
14.3.4.1. Company Details
14.3.4.2. Company Description
14.3.4.3. Business Overview
14.3.4.4. Financial Details
14.3.4.5. Strategic Overview
14.3.5. Stone Three Mining Pty Ltd
14.3.5.1. Company Details
14.3.5.2. Company Description
14.3.5.3. Business Overview
14.3.6. Symboticware Inc.
14.3.6.1. Company Details
14.3.6.2. Company Description
14.3.6.3. Business Overview
14.3.7. Alastri
14.3.7.1. Company Details
14.3.7.2. Company Description
14.3.7.3. Business Overview
14.3.8. IntelliSense.io
14.3.8.1. Company Details
14.3.8.2. Company Description
14.3.8.3. Business Overview
14.3.9. ABB Ltd.
14.3.9.1. Company Details
14.3.9.2. Company Description
14.3.9.3. Business Overview
14.3.9.4. Financial Details
14.3.9.5. Strategic Overview
14.3.10. Epiroc
14.3.10.1. Company Details
14.3.10.2. Company Description
14.3.10.3. .Business Overview
14.3.10.4. Financial Details
14.3.10.5. Strategic Overview
14.3.11. Caterpillar Inc.
14.3.11.1. Company Details
14.3.11.2. Company Description
14.3.11.3. Business Overview
14.3.11.4. Financial Details
14.3.11.5. Strategic Overview
14.3.12. Hitachi Construction Machinery Co., Ltd.
14.3.12.1. Company Details
14.3.12.2. Company Description
14.3.12.3. Business Overview
14.3.12.4. Financial Details
14.3.12.5. Strategic Overview
14.3.13. Joy Global Inc.
14.3.13.1. Company Details
14.3.13.2. Company Description
14.3.13.3. Business Overview
14.3.14. Komatsu Ltd.
14.3.14.1. Company Details
14.3.14.2. Company Description
14.3.14.3. Business Overview
14.3.14.4. Financial Details
14.3.14.5. Strategic Overview
14.3.15. Sandvik AB
14.3.15.1. Company Details
14.3.15.2. Company Description
14.3.15.3. Business Overview
14.3.15.4. Financial Details
14.3.15.5. Strategic Overview
14.3.16. Cisco Systems, Inc.
14.3.16.1. Company Details
14.3.16.2. Company Description
14.3.16.3. Business Overview
14.3.16.4. Financial Details
14.3.16.5. Strategic Overview
14.3.17. Alcatel-Lucent
14.3.17.1. Company Details
14.3.17.2. Company Description
14.3.17.3. Business Overview
14.3.17.4. Financial Details
14.3.17.5. Strategic Overview
List of Tables
Table 01: Global Smart Mining Solution Market Volume (Units) Forecast, by Automated Equipment, 2018–2027
Table 02: Global Smart Mining Solution Market Value (US$ Mn) Forecast, by Automated Equipment, 2018–2027
Table 03: Global Smart Mining Solution Market Value (US$ Mn) Forecast, by Solution Type, 2018–2027
Table 04: Global Smart Mining Solution Market Value (US$ Mn) Forecast, by Software, 2018–2027
Table 05: Global Smart Mining Solution Market Value (US$ Mn) Forecast, by Hardware, 2018–2027
Table 06: Global Smart Mining Solution Market Value (US$ Mn) Forecast, by Services, 2018–2027
Table 07: Global Smart Mining Solution Market Value (US$ Mn) Forecast, by Region, 2018–2027
Table 08: North America Smart Mining Solution Market Value (US$ Mn) Forecast, by Country, 2018–2027
Table 09: North America Smart Mining Solution Market Volume (Units) Forecast, by Automated Equipment, 2018–2027
Table 10: North America Smart Mining Solution Market Value (US$ Mn) Forecast, by Automated Equipment, 2018–2027
Table 11: North America Smart Mining Solution Market Value (US$ Mn) Forecast, by Solution Type, 2018–2027
Table 12: North America Smart Mining Solution Market Value (US$ Mn) Forecast, by Software Solution, 2018–2027
Table 13: North America Smart Mining Solution Market Value (US$ Mn) Forecast, by Hardware Solution, 2018–2027
Table 14: North America Smart Mining Solution Market Value (US$ Mn) Forecast, by Services, 2018–2027
Table 15: U.S. Smart Mining Solution Market Volume (Units) Forecast, by Automated Equipment, 2018–2027
Table 16: U.S. Smart Mining Solution Market Value (US$ Mn) Forecast, by Automated Equipment, 2018–2027
Table 17: U.S. Smart Mining Solution Market Value (US$ Mn) Forecast, by Solution Type, 2018–2027
Table 18: U.S. Smart Mining Solution Market Value (US$ Mn) Forecast, by Software Solution, 2018–2027
Table 19: U.S. Smart Mining Solution Market Value (US$ Mn) Forecast, by Hardware Solution, 2018–2027
Table 20: U.S. Smart Mining Solution Market Value (US$ Mn) Forecast, by Services, 2018–2027
Table 21: Canada Smart Mining Solution Market Volume (Units) Forecast, by Automated Equipment, 2018–2027
Table 22: Canada Smart Mining Solution Market Value (US$ Mn) Forecast, by Automated Equipment, 2018–2027
Table 23: Canada Smart Mining Solution Market Value (US$ Mn) Forecast, by Solution Type, 2018–2027
Table 24: Canada Smart Mining Solution Market Value (US$ Mn) Forecast, by Software Solution, 2018–2027
Table 25: Canada Smart Mining Solution Market Value (US$ Mn) Forecast, by Hardware Solution, 2018–2027
Table 26: Canada Smart Mining Solution Market Value (US$ Mn) Forecast, by Services, 2018–2027
Table 27: Europe Smart Mining Solution Market Value (US$ Mn) Forecast, by Country and Sub-region, 2018–2027
Table 28: Europe Smart Mining Solution Market Volume (Units) Forecast, by Automated Equipment, 2018–2027
Table 29: Europe Smart Mining Solution Market Value (US$ Mn) Forecast, by Automated Equipment, 2018–2027
Table 30: Europe Smart Mining Solution Market Value (US$ Mn) Forecast, by Solution Type, 2018–2027
Table 31: Europe Smart Mining Solution Market Value (US$ Mn) Forecast, by Software Solution, 2018–2027
Table 32: Europe Smart Mining Solution Market Value (US$ Mn) Forecast, by Hardware Solution, 2018–2027
Table 33: Europe Smart Mining Solution Market Value (US$ Mn) Forecast, by Services, 2018–2027
Table 34: France Smart Mining Solution Market Volume (Units) Forecast, by Automated Equipment, 2018–2027
Table 35: France Smart Mining Solution Market Value (US$ Mn) Forecast, by Automated Equipment, 2018–2027
Table 36: France Smart Mining Solution Market Value (US$ Mn) Forecast, by Solution Type, 2018–2027
Table 37: France Smart Mining Solution Market Value (US$ Mn) Forecast, by Software Solution, 2018–2027
Table 38: France Smart Mining Solution Market Value (US$ Mn) Forecast, by Hardware Solution, 2018–2027
Table 39: France Smart Mining Solution Market Value (US$ Mn) Forecast, by Services, 2018–2027
Table 40: Germany Smart Mining Solution Market Volume (Units) Forecast, by Automated Equipment, 2018–2027
Table 41: Germany Smart Mining Solution Market Value (US$ Mn) Forecast, by Automated Equipment, 2018–2027
Table 42: Germany Smart Mining Solution Market Value (US$ Mn) Forecast, by Solution Type, 2018–2027
Table 43: Germany Smart Mining Solution Market Value (US$ Mn) Forecast, by Software Solution, 2018–2027
Table 44: Germany Smart Mining Solution Market Value (US$ Mn) Forecast, by Hardware Solution, 2018–2027
Table 45: Germany Smart Mining Solution Market Value (US$ Mn) Forecast, by Services, 2018–2027
Table 46: Rest of Europe Smart Mining Solution Market Volume (Units) Forecast, by Automated Equipment, 2018–2027
Table 47: Rest of Europe Smart Mining Solution Market Value (US$ Mn) Forecast, by Automated Equipment, 2018–2027
Table 48: Rest of Europe Smart Mining Solution Market Value (US$ Mn) Forecast, by Solution Type, 2018–2027
Table 49: Rest of Europe Smart Mining Solution Market Value (US$ Mn) Forecast, by Software Solution, 2018–2027
Table 50: Rest of Europe Smart Mining Solution Market Value (US$ Mn) Forecast, by Hardware Solution, 2018–2027
Table 51: Rest of Europe Smart Mining Solution Market Value (US$ Mn) Forecast, by Services, 2018–2027
Table 52: Asia Pacific Smart Mining Solution Market Value (US$ Mn) Forecast, by Country and Sub-region, 2018–2027
Table 53: Asia Pacific Smart Mining Solution Market Volume (Units) Forecast, by Automated Equipment, 2018–2027
Table 54: Asia Pacific Smart Mining Solution Market Value (US$ Mn) Forecast, by Automated Equipment, 2018–2027
Table 55: Asia Pacific Smart Mining Solution Market Value (US$ Mn) Forecast, by Solution Type, 2018–2027
Table 56: Asia Pacific Smart Mining Solution Market Value (US$ Mn) Forecast, by Software Solution, 2018–2027
Table 57: Asia Pacific Smart Mining Solution Market Value (US$ Mn) Forecast, by Hardware Solution, 2018–2027
Table 58: Asia Pacific Smart Mining Solution Market Value (US$ Mn) Forecast, by Services, 2018–2027
Table 59: China Smart Mining Solution Market Volume (Units) Forecast, by Automated Equipment, 2018–2027
Table 60: China Smart Mining Solution Market Value (US$ Mn) Forecast, by Automated Equipment, 2018–2027
Table 61: China Smart Mining Solution Market Value (US$ Mn) Forecast, by Solution Type, 2018–2027
Table 62: China Smart Mining Solution Market Value (US$ Mn) Forecast, by Software Solution, 2018–2027
Table 63: China Smart Mining Solution Market Value (US$ Mn) Forecast, by Hardware Solution, 2018–2027
Table 64: China Smart Mining Solution Market Value (US$ Mn) Forecast, by Services, 2018–2027
Table 65: India Smart Mining Solution Market Volume (Units) Forecast, by Automated Equipment, 2018–2027
Table 66: India Smart Mining Solution Market Value (US$ Mn) Forecast, by Automated Equipment, 2018–2027
Table 67: India Smart Mining Solution Market Value (US$ Mn) Forecast, by Solution Type, 2018–2027
Table 68: India Smart Mining Solution Market Value (US$ Mn) Forecast, by Software Solution, 2018–2027
Table 69: India Smart Mining Solution Market Value (US$ Mn) Forecast, by Hardware Solution, 2018–2027
Table 70: India Smart Mining Solution Market Value (US$ Mn) Forecast, by Services, 2018–2027
Table 71: Rest of Asia Pacific Smart Mining Solution Market Volume (Units) Forecast, by Automated Equipment, 2018–2027
Table 72: Rest of Asia Pacific Smart Mining Solution Market Value (US$ Mn) Forecast, by Automated Equipment, 2018–2027
Table 73: Rest of Asia Pacific Smart Mining Solution Market Value (US$ Mn) Forecast, by Solution Type, 2018–2027
Table 74: Rest of Asia Pacific Smart Mining Solution Market Value (US$ Mn) Forecast, by Software Solution, 2018–2027
Table 75: Rest of Asia Pacific Smart Mining Solution Market Value (US$ Mn) Forecast, by Hardware Solution, 2018–2027
Table 76: Rest of Asia Pacific Smart Mining Solution Market Value (US$ Mn) Forecast, by Services, 2018–2027
Table 77: Latin America Smart Mining Solution Market Value (US$ Mn) Forecast, by Country and Sub-region, 2018–2027
Table 78: Latin America Smart Mining Solution Market Volume (Units) Forecast, by Automated Equipment, 2018–2027
Table 79: Latin America Smart Mining Solution Market Value (US$ Mn) Forecast, by Automated Equipment, 2018–2027
Table 80: Latin America Smart Mining Solution Market Value (US$ Mn) Forecast, by Solution Type, 2018–2027
Table 81: Latin America Smart Mining Solution Market Value (US$ Mn) Forecast, by Software Solution, 2018–2027
Table 82: Latin America Smart Mining Solution Market Value (US$ Mn) Forecast, by Hardware Solution, 2018–2027
Table 83: Latin America Smart Mining Solution Market Value (US$ Mn) Forecast, by Services, 2018–2027
Table 84: Brazil Smart Mining Solution Market Volume (Units) Forecast, by Automated Equipment, 2018–2027
Table 85: Brazil Smart Mining Solution Market Value (US$ Mn) Forecast, by Automated Equipment, 2018–2027
Table 86: Brazil Smart Mining Solution Market Value (US$ Mn) Forecast, by Solution Type, 2018–2027
Table 87: Brazil Smart Mining Solution Market Value (US$ Mn) Forecast, by Software Solution, 2018–2027
Table 88: Brazil Smart Mining Solution Market Value (US$ Mn) Forecast, by Hardware Solution, 2018–2027
Table 89: Brazil Smart Mining Solution Market Value (US$ Mn) Forecast, by Services, 2018–2027
Table 90: Mexico Smart Mining Solution Market Volume (Units) Forecast, by Automated Equipment, 2018–2027
Table 91: Mexico Smart Mining Solution Market Value (US$ Mn) Forecast, by Automated Equipment, 2018–2027
Table 92: Mexico Smart Mining Solution Market Value (US$ Mn) Forecast, by Solution Type, 2018–2027
Table 93: Mexico Smart Mining Solution Market Value (US$ Mn) Forecast, by Software Solution, 2018–2027
Table 94: Mexico Smart Mining Solution Market Value (US$ Mn) Forecast, by Hardware Solution, 2018–2027
Table 95: Mexico Smart Mining Solution Market Value (US$ Mn) Forecast, by Services, 2018–2027
Table 96: Rest of Latin America Smart Mining Solution Market Volume (Units) Forecast, by Automated Equipment, 2018–2027
Table 97: Rest of Latin America Smart Mining Solution Market Value (US$ Mn) Forecast, by Automated Equipment, 2018–2027
Table 98: Rest of Latin America Smart Mining Solution Market Value (US$ Mn) Forecast, by Solution Type, 2018–2027
Table 99: Rest of Latin America Smart Mining Solution Market Value (US$ Mn) Forecast, by Software Solution, 2018–2027
Table 100: Rest of Latin America Smart Mining Solution Market Value (US$ Mn) Forecast, by Hardware Solution, 2018–2027
Table 101: Rest of Latin America Smart Mining Solution Market Value (US$ Mn) Forecast, by Services, 2018–2027
Table 102: Middle East & Africa Smart Mining Solution Market Value (US$ Mn) Forecast, by Country and Sub-region, 2018–2027
Table 103: Middle East & Africa Smart Mining Solution Market Volume (Units) Forecast, by Automated Equipment, 2018–2027
Table 104: Middle East & Africa Smart Mining Solution Market Value (US$ Mn) Forecast, by Automated Equipment, 2018–2027
Table 105: Middle East & Africa Smart Mining Solution Market Value (US$ Mn) Forecast, by Solution Type, 2018–2027
Table 106: Middle East & Africa Smart Mining Solution Market Value (US$ Mn) Forecast, by Software Solution, 2018–2027
Table 107: Middle East & Africa Smart Mining Solution Market Value (US$ Mn) Forecast, by Hardware Solution, 2018–2027
Table 108: Middle East & Africa Smart Mining Solution Market Value (US$ Mn) Forecast, by Services, 2018–2027
Table 109: GCC Smart Mining Solution Market Volume (Units) Forecast, by Automated Equipment, 2018–2027
Table 110: GCC Smart Mining Solution Market Value (US$ Mn) Forecast, by Automated Equipment, 2018–2027
Table 111: GCC Smart Mining Solution Market Value (US$ Mn) Forecast, by Solution Type, 2018–2027
Table 112: GCC Smart Mining Solution Market Value (US$ Mn) Forecast, by Software Solution, 2018–2027
Table 113: GCC Smart Mining Solution Market Value (US$ Mn) Forecast, by Hardware Solution, 2018–2027
Table 114: GCC Smart Mining Solution Market Value (US$ Mn) Forecast, by Services, 2018–2027
Table 115: South Africa Smart Mining Solution Market Volume (Units) Forecast, by Automated Equipment, 2018–2027
Table 116: South Africa Smart Mining Solution Market Value (US$ Mn) Forecast, by Automated Equipment, 2018–2027
Table 117: South Africa Smart Mining Solution Market Value (US$ Mn) Forecast, by Solution Type, 2018–2027
Table 118: South Africa Smart Mining Solution Market Value (US$ Mn) Forecast, by Software Solution, 2018–2027
Table 119: South Africa Smart Mining Solution Market Value (US$ Mn) Forecast, by Hardware Solution, 2018–2027
Table 120: South Africa Smart Mining Solution Market Value (US$ Mn) Forecast, by Services, 2018–2027
Table 121: Rest of Middle East & Africa Smart Mining Solution Market Volume (Units) Forecast, by Automated Equipment, 2018–2027
Table 122: Rest of Middle East & Africa Smart Mining Solution Market Value (US$ Mn) Forecast, by Automated Equipment, 2018–2027
Table 123: Rest of Middle East & Africa Smart Mining Solution Market Value (US$ Mn) Forecast, by Solution Type, 2018–2027
Table 124: Rest of Middle East & Africa Smart Mining Solution Market Value (US$ Mn) Forecast, by Software Solution, 2018–2027
Table 125: Rest of Middle East & Africa Smart Mining Solution Market Value (US$ Mn) Forecast, by Hardware Solution, 2018–2027
Table 126: Rest of Middle East & Africa Smart Mining Solution Market Value (US$ Mn) Forecast, by Services, 2018–2027
List of Figures
Figure 01: Global Smart Mining Solution Market Value (US$ Mn) Analysis, 2018–2027
Figure 02: Global Smart Mining Solution Market Value Share Analysis, by Automated Equipment, 2018 and 2027
Figure 03: Global Smart Mining Solution Market Attractiveness Analysis, by Automated Equipment
Figure 04: Global Smart Mining Solution Market Value Share Analysis, by Solution Type, 2018 and 2027
Figure 05: Global Smart Mining Solution Market Value Share Analysis, by Software, 2018 and 2027
Figure 06: Global Smart Mining Solution Market Value Share Analysis, by Services, 2018 and 2027
Figure 07: Global Smart Mining Solution Market Value Share Analysis, by Hardware, 2018 and 2027
Figure 08: Global Smart Mining Solution Market Attractiveness Analysis, by Solution Type, 2019–2027
Figure 09: Global Smart Mining Solution Market Value Share Analysis, by Region, 2018 and 2027
Figure 10: Global Smart Mining Solution Market Attractiveness Analysis, by Region
Figure 11: North America Smart Mining Solution Market Value Share Analysis, by Country, 2018 and 2027
Figure 12: North America Smart Mining Solution Market Attractiveness Analysis, by Automated Equipment
Figure 13: North America Smart Mining Solution Market Attractiveness Analysis, by Solution Type
Figure 14: North America Smart Mining Solution Market Attractiveness Analysis, by Country
Figure 15: Europe Smart Mining Solution Market Value Share Analysis, by Country and Sub-region 2018 and 2027
Figure 16: Europe Smart Mining Solution Market Attractiveness Analysis, by Automated Equipment
Figure 17: Europe Smart Mining Solution Market Attractiveness Analysis, by Solution Type
Figure 18: Europe Smart Mining Solution Market Attractiveness Analysis, by Country and Sub-region
Figure 19: Asia Pacific Market Value Share Analysis, by Country and Sub-region, 2018 and 2027
Figure 20: Asia Pacific Smart Mining Solution Market Attractiveness Analysis, by Automated Equipment
Figure 21: Asia Pacific Smart Mining Solution Market Attractiveness Analysis, by Solution Type
Figure 22: Asia Pacific Smart Mining Solution Market Attractiveness Analysis, by Country and Sub-region
Figure 23: Latin America Smart Mining Solution Market Value Share Analysis, by Country and Sub-region, 2018 and 2027
Figure 24: Latin America Smart Mining Solution Market Attractiveness Analysis, by Automated Equipment
Figure 25: Latin America Smart Mining Solution Market Attractiveness Analysis, by Solution Type
Figure 26: Latin America Smart Mining Solution Market Attractiveness Analysis, by Country and Sub-region
Figure 27: Middle East & Africa Smart Mining Solution Market Value Share Analysis, by Country and Sub-region, 2018 and 2027
Figure 28: Middle East & Africa Smart Mining Solution Market Attractiveness Analysis, by Automated Equipment
Figure 29: Middle East & Africa Smart Mining Solution Market Attractiveness Analysis, by Solution Type
Figure 30: Middle East & Africa Smart Mining Solution Market Attractiveness Analysis, by Country and Sub-region
Figure 31: Global Smart Mining Solution Market Value Share Analysis, by Automated Equipment, 2018
Figure 32: Global Smart Mining Solution Market Value Share Analysis, by Mining Software, 2018
Copyright © Transparency Market Research, Inc. All Rights reserved
Trust Online

Smart Mining Solution Market Trends, 2019-2027