
Reports
Reports
Global Single-use Bioprocessing Sensors and Probes Market: Snapshot
Success-hungry dominant players in the global single-use bioprocessing sensors and probes market have mostly grown through strategic alliances and acquisitions that have helped them enhance their product base. Currently, a handful of big global names and many regional companies operate in the market. A key trend in the market is differentiated products which serves to lessen the intensity of competition among players.
A number of factors are helping to catalyze growth in the global single-use bioprocessing sensors and probes market. They are thrust on easier, improved monitoring of bioprocess, robust demand from industrial bioprocessing, growing preference for customization of single-use products keeping in mind the specific needs of the consumer, and reduced cost and technologically advanced products. Acting as a roadblock to the market, on the other hand, is the limitations and technical issues in the use of single-use sensors and environmental concerns over the use of disposables.
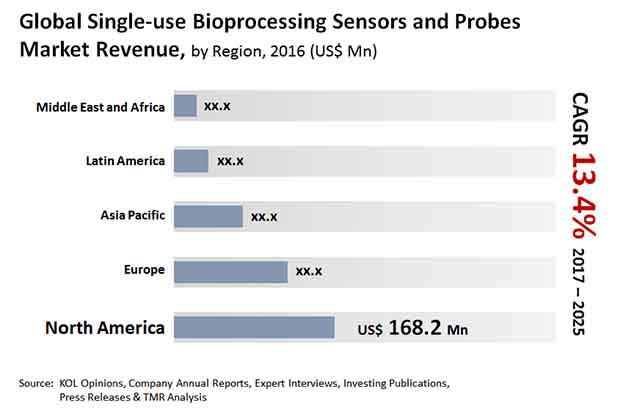
According to a report by Transparency Market Research, the global single-use bioprocessing sensors and probes will likely expand at a robust 13.4% CAGR between 2017 and 2025 to become worth US$1281 mn by 2025 from US$418.3 mn in 2016.
Bench Top Control Systems to Remain Dominant Segment
Depending upon the type of product, the global single-use bioprocessing sensors and probes market can be segmented into market pH sensor, valve, bench top control system, spectroscopy technology, optochemical DO (dissolved oxygen), temperature sensor, pressure sensor, fill weight, fill level, conductivity sensors, flow rate sensors, pCO2 sensors and osmolality. At present, the bench top control system leads the market and in 2016, its leading share was around 24.1%. In future too, the segment is expected to hold onto its leading share by expanding at a CAGR of 13.9%. At this rate, the segment will become worth US$323.3 mn in 2025 from US$101.0 mn in 2016.
The valve segment trails the bench top control system segment in terms of market share. In 2016, the segment held a share of about 19.7% in the market from US$81.3 mn in 2016. The segment is likely to reach value of US$252.5 mn by 2025. In terms of growth rate, however, the pCO2 segment is expected to lead the market by clocking a CAGR of 15.0% from 2017 to 2025. pCO2 sensors are instruments used in the bioprocess industry to measure the partial carbon dioxide. These sensors provide air and pCO2 measurement in bioprocessing.
Adoption of Upcoming Technologies to Help Asia Pacific to Clock Maximum Growth
From a geographical perspective, North America held a leading share of 40.2% share in 2016 in the global single-use bioprocessing sensors and probes market. The market in the region is powered primarily by the U.S. which has made gigantic progress on account of the swift uptake of latest technologies, presence of a well-established bioprocessing and pharmaceutical industry, early availability of newest technologies, and heightened research activities. Going forward, North America is expected to grow its share further in the market.
Europe trails North America in the global single-use bioprocessing sensors and probes market. In the upcoming years, the region is predicted to lose its market share to become worth US$330.8 mn by 2025. In terms of growth rate, Asia Pacific is anticipated to outshine all other regions by registering a CAGR of 13.8% between 2017 and 2025. The region is primarily powered by China, India, and Japan. Adoption of upcoming technologies and expansion of the biotechnology sector is said to be underpinning robust growth in the region.
Prominent companies operating in the global single-use bioprocessing sensors and probes market are Thermo Fisher Scientific Inc., Sartorius AG, Parket Hannifin Corporation, and Hamilton Company.
1. Preface
1.1. Report Scope and Market Segmentation
1.2. Research Highlights
2. Assumptions and Research Methodology
2.1. Assumptions
2.2. Acronyms Used
2.3. Research Methodology
3. Executive Summary
3.1. Global Single-use bioprocessing sensors and probes Market Snapshot
4. Market Overview
4.1. Product Overview
4.2. Global Single-use bioprocessing sensors and probes Market Size (US$ Mn) Forecast, 2015–2025
4.3. Key Industry Events
4.4. Porter’s Five Forces Analysis
4.5. Global Single-use bioprocessing sensors and probes Market Outlook
4.6. Overview of Processes
4.7. System Comparison : Reusable Vs. Single-use Systems
4.8. Regulatory Scenario
4.9. Value Chain Analysis
5. Market Dynamics
5.1. Drivers and Restraints Snapshot Analysis
5.2. Drivers
5.2.1. Increased focus on better and easier monitoring of bioprocess
5.2.2. Increased demand for industrial bioprocessing
5.2.3. Increased preference for customization of single-use products as per customer requirements
5.2.4. Cost reduction in overall bioprocessing
5.2.5. Technological advancements and innovation in product offerings
5.2.6. Easier regulatory compliance
5.3. Restraints
5.3.1. Comparatively less industrial adoption of single-use technology
5.3.2. Limitations and technical difficulties in the use of single-use sensors
5.3.3. Environmental concerns over the use of disposables
5.4. Opportunity Analysis
6. Global Single-use bioprocessing sensors and probes Market Analysis, by Application Type
6.1. Introduction
6.2. Key Findings
6.3. Global Single-use bioprocessing sensors and probes Market Value Share Analysis, by Application Type, 2016 and 2025
6.4. Global Single-use bioprocessing sensors and probes Market Forecast, by Application Type 2015–2025
6.5. Global Single-use bioprocessing sensors and probes Market Attractiveness Analysis, by Application Type, 2015–2025
7. Global Single-use bioprocessing sensors and probes Market Analysis, by Product
7.1. Introduction
7.2. Key Findings
7.3. Global Single-use bioprocessing sensors and probes Market Value Share Analysis, by Product Type, 2016 and 2025
7.4. Global Single-use bioprocessing sensors and probes Market Forecast, by Product Type 2015–2025
7.5. Global Single-use bioprocessing sensors and probes Market Attractiveness Analysis, by Product Type, 2015–2025
8. Global Single-use bioprocessing sensors and probes Market Analysis, by Region
8.1. Global Market Scenario by Country
8.2. Global Single-use bioprocessing sensors and probes Market Value Share Analysis, by Region, 2016 and 2025
8.3. Single-use bioprocessing sensors and probes Market Forecast, by Region, 2015–2025
8.4. Global Single-use bioprocessing sensors and probes Market Attractiveness Analysis, by Region, 2015–2025
9. North America Single-use bioprocessing sensors and probes Market Analysis
9.1. Key Findings
9.2. Market Overview
9.3. North America Single-use bioprocessing sensors and probes Market Value Share Analysis, by Country
9.4. North America Single-use bioprocessing sensors and probes Market Forecast, by Country
9.5. North America Single-use Bioprocessing Sensors and Probes Market Value Share Analysis, by Product
9.6. North America Single-use bioprocessing sensors and probes Market Value Share Analysis, by Application
9.7. North America Single-use bioprocessing sensors and probes Market Attractiveness Analysis
9.8. North America Single-use bioprocessing sensors and probes Market Trends
10. Europe Single-use bioprocessing sensors and probes Market Analysis
10.1. Key Findings
10.2. Market Overview
10.3. Europe Single-use bioprocessing sensors and probes Market Value Share Analysis, by Country
10.4. Europe Single-use bioprocessing sensors and probes Market Forecast, by Country 2015–2025
10.5. Europe Single-use bioprocessing sensors and probes Market Value Share Analysis, by Product,
10.6. Europe Single-use bioprocessing sensors and probes Market Value Share Analysis, by Application,
10.7. Europe Single-use bioprocessing sensors and probes Market Attractiveness Analysis
10.8. Europe Single-use bioprocessing sensors and probes Market Trends
11. Asia Pacific Single-use bioprocessing sensors and probes Market Analysis
11.1. Key Findings
11.2. Market Overview
11.3. Asia Pacific Single-use bioprocessing sensors and probes Market Value Share Analysis, by Country
11.4. Asia Pacific Single-use bioprocessing sensors and probes Market Forecast, by Country 2015–2025
11.5. Asia Pacific Single-use bioprocessing sensors and probes Market Value Share Analysis, by Product
11.6. Asia Pacific Single-use bioprocessing sensors and probes Market Forecast, by Application
11.7. Asia Pacific Single-use bioprocessing sensors and probes Market Attractiveness Analysis
11.8. Asia Pacific Single-use bioprocessing sensors and probes Market Trends
12. Latin America Single-use bioprocessing sensors and probes Market Analysis
12.1. Key Findings
12.2. Market Overview
12.3. Latin America Single-use bioprocessing sensors and probes Market Value Share Analysis, by Country
12.4. Latin America Single-use bioprocessing sensors and probes Market Forecast, by Country
12.5. Latin America Single-use bioprocessing sensors and probes Market Value Share Analysis, by Product
12.6. Latin America Single-use bioprocessing sensors and probes Market Value Share Analysis, by Application
12.7. Latin America Single-use bioprocessing sensors and probes Market Attractiveness Analysis
12.8. Latin America Single-use bioprocessing sensors and probes Market Trends
13. Middle East & Africa Single-use bioprocessing sensors and probes Market Analysis
13.1. Key Findings
13.2. Market Overview
13.3. Middle East & Africa Single-use bioprocessing sensors and probes Market Value Share Analysis, by Country
13.4. Middle East & Africa Single-use bioprocessing sensors and probes Market Forecast, by Country 2015–2025
13.5. Middle East & Africa Single-use bioprocessing sensors and probes Market Value Share Analysis, by Product, 2016 and 2025
13.6. Middle East & Africa Single-use bioprocessing sensors and probes Market Value Share Analysis, by Application, 2016 and 2025
13.7. Middle East & Africa Single-use bioprocessing sensors and probes Market Attractiveness Analysis
13.8. Middle East & Africa Single-use bioprocessing sensors and probes Market Trends
14. Competition Landscape
14.1. Competition Matrix
14.2. Company Profiles
14.2.1. Sartorius Stedim Biotech S.A. (Sartorius AG)
14.2.1.1. Company Details
14.2.1.2. Business Overview
14.2.1.3. Financial Overview
14.2.1.4. Strategic Overview
14.2.1.5. SWOT Analysis
14.2.2. Eppendorf AG
14.2.2.1. Company Details
14.2.2.2. Business Overview
14.2.2.3. Financial Overview
14.2.2.4. Strategic Overview
14.2.2.5. SWOT Analysis
14.2.3. Thermo Fisher Scientific, Inc. (Finesse Solutions)
14.2.3.1. Company Details
14.2.3.2. Business Overview
14.2.3.3. Financial Overview
14.2.3.4. Strategic Overview
14.2.3.5. SWOT Analysis
14.2.4. Hamilton Company
14.2.4.1. Company Details
14.2.4.2. Business Overview
14.2.4.3. Financial Overview
14.2.4.4. Strategic Overview
14.2.4.5. SWOT Analysis
14.2.5. Honeywell International, Inc.
14.2.5.1. Company Details
14.2.5.2. Business Overview
14.2.5.3. Financial Overview
14.2.5.4. Strategic Overview
14.2.5.5. SWOT Analysis
14.2.6. Broadley-James Corporation
14.2.6.1. Company Details
14.2.6.2. Business Overview
14.2.6.3. Financial Overview
14.2.6.4. Strategic Overview
14.2.6.5. SWOT Analysis
14.2.7. GE Healthcare
14.2.7.1. Company Details
14.2.7.2. Business Overview
14.2.7.3. Financial Overview
14.2.7.4. Strategic Overview
14.2.7.5. SWOT Analysis
14.2.8. PendoTECH, LLC
14.2.8.1. Company Details
14.2.8.2. Business Overview
14.2.8.3. Financial Overview
14.2.8.4. Strategic Overview
14.2.8.5. SWOT Analysis
14.2.9. Parker Hannifin Corporation.
14.2.9.1. Company Details
14.2.9.2. Business Overview
14.2.9.3. Financial Overview
14.2.9.4. Strategic Overview
14.2.9.5. SWOT Analysis
14.2.10. Polestar Technologies, Inc.
14.2.10.1. Company Details
14.2.10.2. Business Overview
14.2.10.3. Financial Overview
14.2.10.4. Strategic Overview
14.2.10.5. SWOT Analysis
14.2.11. PreSens Precision Sensing GmbH
14.2.11.1. Company Details
14.2.11.2. Business Overview
14.2.11.3. Financial Overview
14.2.11.4. Strategic Overview
14.2.11.5. SWOT Analysis
List of Tables
Table 01: System Comparison: Stainless Steel Vs. Single-use Systems
Table 02: Global Single-use Bioprocessing Sensors and Probes Market Size (US$ Mn) Forecast, by Type of Product, 2015–2025
Table 03: Global Single-use Bioprocessing Sensors and Probes Market Size (US$ Mn) Forecast, by Type of Product – pH Sensor, 2015–2025
Table 04: Global Single-use Bioprocessing Sensors and Probes Market Size (US$ Mn) Forecast, by Type of Product – Valve, 2015–2025
Table 05: Global Single-use Bioprocessing Sensors and Probes Market Size (US$ Mn) Forecast, by Type of Product – Bench Top Control System, 2015–2025
Table 06: Global Single-use Bioprocessing Sensors and Probes Market Size (US$ Mn) Forecast, by Type of Product – Spectroscopy Technology, 2015–2025
Table 07: Global Single-use Bioprocessing Sensors and Probes Market Size (US$ Mn) Forecast, by Application, 2015–2025
Table 08: Global Single-use Bioprocessing Sensors and Probes Market Size (US$ Mn) Forecast, by Region, 2015–2025
Table 09: North America Single-use Bioprocessing Sensors and Probes Market Size (US$ Mn) Forecast, by Country, 2015–2025
Table 10: North America Single-use Bioprocessing Sensors and Probes Market Size (US$ Mn) Forecast, by Type of Product, 2015–2025
Table 11: North America Single-use Bioprocessing Sensors and Probes Market Size (US$ Mn) Forecast, by Type of Product - pH Sensor, 2015–2025
Table 12: North America Single-use Bioprocessing Sensors and Probes Market Size (US$ Mn) Forecast, by Type of Product - Valve, 2015–2025
Table 13: North America Single-use Bioprocessing Sensors and Probes Market Size (US$ Mn) Forecast, by Type of Product - Bench Top Control System, 2015–2025
Table 14: North America Single-use Bioprocessing Sensors and Probes Market Size (US$ Mn) Forecast, by Type of Product - Spectroscopy Technology, 2015–2025
Table 15: North America Single-use Bioprocessing Sensors and Probes Market Size (US$ Mn) Forecast, by Application, 2015–2025
Table 16: Europe Single-use Bioprocessing Sensors and Probes Market Size (US$ Mn) Forecast, by Country, 2015–2025
Table 17: Europe Single-use Bioprocessing Sensors and Probes Market Size (US$ Mn) Forecast, by Type of Product, 2015–2025
Table 18: Europe Single-use Bioprocessing Sensors and Probes Market Size (US$ Mn) Forecast, by Type of Product - pH Sensor, 2015–2025
Table 19: Europe Single-use Bioprocessing Sensors and Probes Market Size (US$ Mn) Forecast, by Type of Product - Valve, 2015–2025
Table 20: Europe Single-use Bioprocessing Sensors and Probes Market Size (US$ Mn) Forecast, by Type of Product - Bench Top Control System, 2015–2025
Table 21: Europe Single-use Bioprocessing Sensors and Probes Market Size (US$ Mn) Forecast, by Application, 2015–2025
Table 22: Asia Pacific Single-use Bioprocessing Sensors and Probes Market Size (US$ Mn) Forecast, by Country, 2015–2025
Table 23: Asia Pacific Single-use Bioprocessing Sensors and Probes Market Size (US$ Mn) Forecast, by Type of Product, 2015–2025
Table 24: Asia Pacific Single-use Bioprocessing Sensors and Probes Market Size (US$ Mn) Forecast, by Type of Product – pH Sensor, 2015–2025
Table 25: Asia Pacific Single-use Bioprocessing Sensors and Probes Market Size (US$ Mn) Forecast, by Type of Product – Valve, 2015–2025
Table 26: Asia Pacific Single-use Bioprocessing Sensors and Probes Market Size (US$ Mn) Forecast, by Type of Product – Bench Top Control System, 2015–2025
Table 27: Asia Pacific Single-use Bioprocessing Sensors and Probes Market Size (US$ Mn) Forecast, by Type of Product – Spectroscopy Technology, 2015–2025
Table 28: Asia Pacific Single-use Bioprocessing Sensors and Probes Market Size (US$ Mn) Forecast, by Application, 2015–2025
Table 29: Latin America Single-use Bioprocessing Sensors and Probes Market Size (US$ Mn) Forecast, by Country, 2015–2025
Table 30: Latin America Single-use Bioprocessing Sensors and Probes Market Size (US$ Mn) Forecast, by Type of Product, 2015–2025
Table 31: Latin America Single-use Bioprocessing Sensors and Probes Market Size (US$ Mn) Forecast, by Type of Product - pH Sensor, 2015–2025
Table 32: Latin America Single-use Bioprocessing Sensors and Probes Market Size (US$ Mn) Forecast, by Type of Product - Valve, 2015–2025
Table 33: Latin America Single-use Bioprocessing Sensors and Probes Market Size (US$ Mn) Forecast, by Type of Product - Bench Top Control System, 2015–2025
Table 34: Latin America Single-use Bioprocessing Sensors and Probes Market Size (US$ Mn) Forecast, by Type of Product - Spectroscopy Technology, 2015–2025
Table 35: Latin America Single-use Bioprocessing Sensors and Probes Market Size (US$ Mn) Forecast, by Application, 2015–2025
Table 36: Middle East & Africa Single-use Bioprocessing Sensors and Probes Market Size (US$ Mn) Forecast, by Country, 2015–2025
Table 37: Middle East & Africa Single-use Bioprocessing Sensors and Probes Market Size (US$ Mn) Forecast, by Type of Product, 2015–2025
Table 38: Middle East & Africa Single-use Bioprocessing Sensors and Probes Market Size (US$ Mn) Forecast, by Type of Product – pH Sensor, 2015–2025
Table 39: Middle East & Africa Single-use Bioprocessing Sensors and Probes Market Size (US$ Mn) Forecast, by Type of Product – Valve, 2015–2025
Table 40: Middle East & Africa Single-use Bioprocessing Sensors and Probes Market Size (US$ Mn) Forecast, by Type of Product – Bench Top Control System, 2015–2025
Table 41: Middle East & Africa Single-use Bioprocessing Sensors and Probes Market Size (US$ Mn) Forecast, by Type of Product – Spectroscopy Technology, 2015–2025
Table 42: Middle East & Africa Single-use Bioprocessing Sensors and Probes Market Size (US$ Mn) Forecast, by Application, 2015–2025
List of Figures
Figure 01: Global Single-use Bioprocessing Sensors and Probes Market Size (US$ Mn) Forecast, 2015–2025
Figure 03: Market Value Share, by Applications (2016)
Figure 02: Market Value Share, by Type of Product (2016)
Figure 04: Market Value Share, by Region (2016)
Figure 05: Overview of Processes carried out using single-use bioprocessing systems
Figure 06: Standard Single-use Products Value Chain
Figure 07: Custom Single-use Products Value Chain
Figure 08: Global Single-use Bioprocessing Sensors and Probes Market Value Share Analysis, by Type of Product, 2016 and 2025
Figure 09: Global Single-use Bioprocessing Sensors and Probes Market Revenue (US$ Mn), by pH Sensor, 2015–2025
Figure 10: Global Single-use Bioprocessing Sensors and Probes Market Revenue (US$ Mn), by Valve, 2015–2025
Figure 11: Global Single-use Bioprocessing Sensors and Probes Market Revenue (US$ Mn), by Bench Top Control System, 2015–2025
Figure 12: Global Single-use Bioprocessing Sensors and Probes Market Revenue (US$ Mn), by Spectroscopy Technology, 2015–2025
Figure 13: Global Single-use Bioprocessing Sensors and Probes Market Revenue (US$ Mn), by Optochemical DO (Dissolved Oxygen), 2015–2025
Figure 14: Global Single-use Bioprocessing Sensors and Probes Market Revenue (US$ Mn), by Temperature, 2015–2025
Figure 15: Global Single-use Bioprocessing Sensors and Probes Market Revenue (US$ Mn), by Pressure, 2015–2025
Figure 16: Global Single-use Bioprocessing Sensors and Probes Market Revenue (US$ Mn), by Fill Weight, 2015–2025
Figure 17: Global Single-use Bioprocessing Sensors and Probes Market Revenue (US$ Mn), by Fill Level, 2015–2025
Figure 18: Global Single-use Bioprocessing Sensors and Probes Market Revenue (US$ Mn), by Conductivity, 2015–2025
Figure 15: Global Single-use Bioprocessing Sensors and Probes Market Revenue (US$ Mn), by Flow Rate, 2015–2025
Figure 16: Global Single-use Bioprocessing Sensors and Probes Market Revenue (US$ Mn), by pCO2, 2015–2025
Figure 17: Global Single-use Bioprocessing Sensors and Probes Market Revenue (US$ Mn), by Osmolality, 2015–2025
Figure 18: Global Single-use Bioprocessing Sensors and Probes Market Revenue (US$ Mn), by UV for Concentration Measurement, 2015–2025
Figure 19: Global Single-use Bioprocessing Sensors and Probes Market Revenue (US$ Mn), by Metabolite Sensors, 2015–2025
Figure 20: Global Single-use Bioprocessing Sensors and Probes Market Revenue (US$ Mn), by Multi-variable Sensors, 2015–2025
Figure 21: Global Single-use Bioprocessing Sensors and Probes Market Revenue (US$ Mn), by Viscosity, 2015–2025
Figure 22: Global Single-use Bioprocessing Sensors and Probes Market Attractiveness Analysis, by Type of Product, 2017–2025
Figure 23: Global Single-use Bioprocessing Sensors and Probes Market Value Share Analysis, by Application, 2016 and 2025
Figure 24: Global Single-use Bioprocessing Sensors and Probes Market Revenue (US$ Mn) and Y-o-Y Growth (%) Projection, by Biotechnology Industry, 2015–2025
Figure 25: Global Single-use Bioprocessing Sensors and Probes Market Revenue (US$ Mn) and Y-o-Y Growth (%) Projection, by Pharmaceutical Industry, 2015–2025
Figure 26: Global Single-use Bioprocessing Sensors and Probes Market Revenue (US$ Mn) and Y-o-Y Growth (%) Projection, by Academic Research, 2015–2025
Figure 27: Global Single-use Bioprocessing Sensors and Probes Market Revenue (US$ Mn) and Y-o-Y Growth (%) Projection, by Others, 2015–2025
Figure 28: Global Single-use Bioprocessing Sensors and Probes Market Attractiveness Analysis, by Application, 2017–2025
Figure 29: Global Single-use Bioprocessing Sensors and Probes Market Value Share Analysis, by Region, 2016 and 2025
Figure 30: Global Single-use Bioprocessing Sensors and Probes Market Attractiveness Analysis, by Region, 2015–2025
Figure 31: North America Single-use Bioprocessing Sensors and Probes Market Size (US$ Mn) Forecast and Y-o-Y Growth (%), 2015–2025
Figure 32: North America Single-use Bioprocessing Sensors and Probes Market Attractiveness Analysis, by Country, 2017–2025
Figure 33: North America Single-use Bioprocessing Sensors and Probes Market Value Share Analysis, by Country, 2016 and 2025
Figure 34: North America Single-use Bioprocessing Sensors and Probes Market Value Share Analysis, by Type of Product, 2016 and 2025
Figure 35: North America Single-use Bioprocessing Sensors and Probes Market Value Share Analysis, by Application, 2016 and 2025
Figure 36: North America Single-use Bioprocessing Sensors and Probes Market Attractiveness Analysis, by Type of Product, 2017–2025
Figure 37: North America Single-use Bioprocessing Sensors and Probes Market Attractiveness Analysis, by Application, 2017–2025
Figure 38: Europe Single-use Bioprocessing Sensors and Probes Market Size (US$ Mn) Forecast and Y-o-Y Growth (%), 2015–2025
Figure 39: Europe Single-use Bioprocessing Sensors and Probes Market Attractiveness Analysis, by Country, 2017–2025
Figure 40: Europe Single-use Bioprocessing Sensors and Probes Market Value Share Analysis, by Country, 2016 and 2025
Figure 41: Europe Single-use Bioprocessing Sensors and Probes Market Value Share Analysis, by Type of Product, 2016 and 2025
Figure 42: Europe Single-use Bioprocessing Sensors and Probes Market Value Share Analysis, by Application, 2016 and 2025
Figure 43: Europe Single-use Bioprocessing Sensors and Probes Market Attractiveness Analysis, by Type of Product, 2017–2025
Figure 44: Europe Single-use Bioprocessing Sensors and Probes Market Attractiveness Analysis, by Application, 2017–2025
Figure 45: Asia Pacific Single-use Bioprocessing Sensors and Probes Market Size (US$ Mn) Forecast and Y-o-Y Growth (%), 2015–2025
Figure 46: Asia Pacific Single-use Bioprocessing Sensors and Probes Market Attractiveness Analysis, by Country, 2017–2025
Figure 47: Asia Pacific Single-use Bioprocessing Sensors and Probes Market Value Share Analysis, by Country, 2016 and 2025
Figure 48: Asia Pacific Single-use Bioprocessing Sensors and Probes Market Value Share Analysis, by Type of Product, 2016 and 2025
Figure 49: Asia Pacific Single-use Bioprocessing Sensors and Probes Market Value Share Analysis, by Application, 2016 and 2025
Figure 50: Asia Pacific Single-use Bioprocessing Sensors and Probes Market Attractiveness Analysis, by Type of Product, 2017–2025
Figure 51: Asia Pacific Single-use Bioprocessing Sensors and Probes Market Attractiveness Analysis, by Application, 2017–2025
Figure 52: Latin America Single-use Bioprocessing Sensors and Probes Market Size (US$ Mn) Forecast and Y-o-Y Growth (%), 2015–2025
Figure 53: Latin America Single-use Bioprocessing Sensors and Probes Market Attractiveness Analysis, by Country, 2017–2025
Figure 54: Latin America Single-use Bioprocessing Sensors and Probes Market Value Share Analysis, by Country, 2016 and 2025
Figure 55: Latin America Single-use Bioprocessing Sensors and Probes Market Value Share Analysis, by Type of Product, 2016 and 2025
Figure 56: Latin America Single-use Bioprocessing Sensors and Probes Market Value Share Analysis, by Application, 2016 and 2025
Figure 57: Latin America Single-use Bioprocessing Sensors and Probes Market Attractiveness Analysis, by Type of Product, 2017–2025
Figure 58: Latin America Single-use Bioprocessing Sensors and Probes Market Attractiveness Analysis, by Application, 2017–2025
Figure 59: Middle East & Africa Single-use Bioprocessing Sensors and Probes Market Size (US$ Mn) Forecast and Y-o-Y Growth (%), 2015–2025
Figure 60: Middle East & Africa Single-use Bioprocessing Sensors and Probes Market Attractiveness Analysis, by Country, 2017–2025
Figure 61: Middle East & Africa Single-use Bioprocessing Sensors and Probes Market Value Share Analysis, by Country, 2016 and 2025
Figure 62: Middle East & Africa Single-use Bioprocessing Sensors and Probes Market Value Share Analysis, by Type of Product, 2016 and 2025
Figure 63: Middle East & Africa Single-use Bioprocessing Sensors and Probes Market Value Share Analysis, by Application, 2016 and 2025
Figure 64: Middle East & Africa Single-use Bioprocessing Sensors and Probes Market Attractiveness Analysis, by Type of Product, 2017–2025
Figure 65: Middle East & Africa Single-use Bioprocessing Sensors and Probes Market Attractiveness Analysis, by Application, 2017–2025
Copyright © Transparency Market Research, Inc. All Rights reserved
Trust Online

Single-use Bioprocessing Sensors and Probes Market