
Reports
Reports
Runtime Application Self-Protection Market: Snapshot
The global market for runtime application self-protection is witnessing a tremendous surge in its size, thanks to the advent of cloud computing and the rising trend of virtualization. Apart from this, the augmenting requirement to secure critical applications and data in enterprises is also supporting the growth of this market substantially. In 2016, the market presented an opportunity worth US$0.25 bn. It is expected to rise exponentially at a CAGR of 32.40% over the period from 2017 to 2025 and reach US$3.13 bn by the end of 2025. The rising implementation of stringent regulatory policies pertaining to the protection of sensitive information is likely to boost the market considerably in the years to come.
Demand for Runtime Application Self-protection Solutions to Remain High
Broadly, the global runtime application self-protection market is evaluated on the basis of the component, deployment, industry vertical, and the geography. Based on the component, the market is classified into solutions and services. Among the two, the solutions segment is leading the global market and is expected to remain doing so over the next few years. In terms of solutions, web applications and mobile applications are the main components used in runtime application self-protections. Among services, professional services and managed services are the most prominent sub-segments.
By deployment, the market is categorized into cloud and on-premise. Although the on-premise deployment segment has taken the lead, currently, but the emergence of cloud technology is expected to support the demand for cloud deployment of these solutions in the coming years. On the basis of industry verticals, the market is bifurcated into the BFSI, government and defense, IT and telecommunications, energy and utilities, manufacturing, healthcare, and the retail sectors.
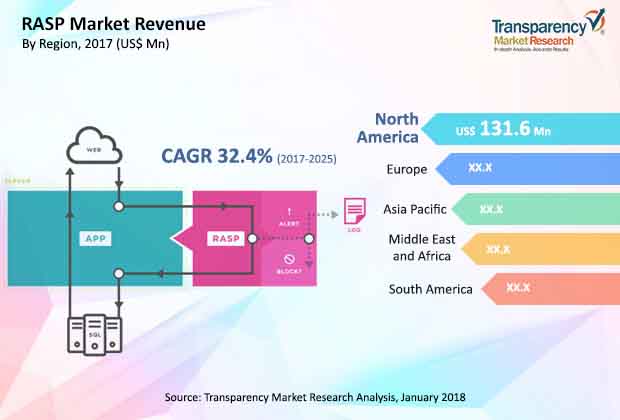
North America to Continue Dominance
In terms of the Geography, the worldwide runtime application self-protection market is divided into North America, the Middle East and Africa, South America, Asia Pacific, and Europe. Among these, North America has occupied the leading position and is expected to remain on the top over the next few years. In the recent past, the region has faced several major attacks, including distributed denial-of-service (DDoS) attack and SQL injection, owing to which, the demand for runtime application self-protection solutions has been significantly high here.
Over the coming years, the increasing involvement of technology companies with RASP vendors in order to generate new customers and technology advancements in this domain and further providing full scale security to them is projected to support the growth of the North America runtime application self-protection market. Among other regional markets, Asia Pacific is likely to witness a high-paced growth in the near future, thanks to a large pool of mobile device users, especially residing in China and India, who are the most attack prone users targeted by hackers.
The global market for runtime application self-protection displays a highly competitive business landscape. Some of the leading vendors of runtime application self-protection solutions are Arxan Technologies Inc., Contrast Security Inc., Veracode, Micro Focus International plc, VASCO Data Security International Inc., Signal Sciences, IMMUNIO, Pradeo, Waratek, and Prevoty Inc.
1. Preface
1.1. Market Definition and Scope
1.2. Market Segmentation
1.3. Key Research Objectives
1.4. Research Highlights
2. Assumptions and Research Methodology
3. Executive Summary : Global Runtime Application Self-Protection Market
4. Market Overview
4.1. Introduction
4.1.1. Industry Evolution / Developments
4.2. Market Dynamics
4.2.1. Drivers
4.2.2. Restraints
4.2.3. Opportunities
4.3. Global Runtime Application Self-Protection Market Analysis and Forecasts, 2015 – 2025
4.3.1. Market Revenue Projections (US$ Mn)
4.4. Porter’s Five Force Analysis
4.5. Ecosystem Analysis : Runtime Application Self-Protection Market
4.6. Market Outlook
5. Global Runtime Application Self-Protection Market Analysis and Forecasts, By Component
5.1. Overview & Definitions
5.2. Market Size (US$ Mn) Forecast By Component, 2015 – 2025
5.2.1. Solutions
5.2.1.1. Web applications
5.2.1.2. Mobile applications
5.2.1.3. Others
5.2.2. Services
5.2.2.1. Professional services
5.2.2.2. Managed services
5.3. Market Attractiveness By Component
6. Global Runtime Application Self-Protection Market Analysis and Forecasts, By Deployment
6.1. Overview & Definitions
6.2. Market Size (US$ Mn) Forecast By Deployment , 2015 – 2025
6.2.1. On-premises
6.2.2. Cloud
6.3. Market Attractiveness By Deployment
7. Global Runtime Application Self-Protection Market Analysis and Forecasts, By Industry Vertical
7.1. Overview & Definitions
7.2. Market Size (US$ Mn) Forecast By Industry Vertical, 2015 – 2025
7.2.1. BFSI
7.2.2. IT and Telecommunications
7.2.3. Government and Defense
7.2.4. Energy and Utilities
7.2.5. Manufacturing
7.2.6. Healthcare
7.2.7. Retail
7.2.8. Others
7.3. Market Attractiveness By Industry Vertical
8. Global Runtime Application Self-Protection Market Analysis and Forecasts, By Region
8.1. Key Findings
8.2. Market Size (US$ Mn) Forecast By Region, 2015 – 2025
8.2.1. North America
8.2.2. Europe
8.2.3. Asia Pacific
8.2.4. Middle East and Africa
8.2.5. South America
8.3. Market Attractiveness By Country/Region
9. North America Runtime Application Self-Protection Market Analysis and Forecast
9.1. Key Trends
9.2. Market Size (US$ Mn) Forecast By Component, 2015 – 2025
9.2.1. Solutions
9.2.1.1. Web applications
9.2.1.2. Mobile applications
9.2.1.3. Others
9.2.2. Services
9.2.2.1. Professional services
9.2.2.2. Managed services
9.3. Market Size (US$ Mn) Forecast By Deployment , 2015 – 2025
9.3.1. On-premises
9.3.2. Cloud
9.4. Market Size (US$ Mn) Forecast By Industry Vertical, 2015 – 2025
9.4.1. BFSI
9.4.2. IT and Telecommunications
9.4.3. Government and Defense
9.4.4. Energy and Utilities
9.4.5. Manufacturing
9.4.6. Healthcare
9.4.7. Retail
9.4.8. Others
9.5. Market Size (US$ Mn) Forecast By Country, 2015 – 2025
9.5.1. The U.S.
9.5.2. Canada
9.5.3. Rest of North America
9.6. The U.S. Market Size (US$ Mn) Forecast By Component, 2015 – 2025
9.6.1. Solutions
9.6.1.1. Web applications
9.6.1.2. Mobile applications
9.6.1.3. Others
9.6.2. Services
9.6.2.1. Professional services
9.6.2.2. Managed services
9.7. The U.S. Market Size (US$ Mn) Forecast By Deployment , 2015 – 2025
9.7.1. On-premises
9.7.2. Cloud
9.8. The U.S. Market Size (US$ Mn) Forecast By Industry Vertical, 2015 – 2025
9.8.1. BFSI
9.8.2. IT and Telecommunications
9.8.3. Government and Defense
9.8.4. Energy and Utilities
9.8.5. Manufacturing
9.8.6. Healthcare
9.8.7. Retail
9.8.8. Others
9.9. Canada Market Size (US$ Mn) Forecast By Component, 2015 – 2025
9.9.1. Solutions
9.9.1.1. Web applications
9.9.1.2. Mobile applications
9.9.1.3. Others
9.9.2. Services
9.9.2.1. Professional services
9.9.2.2. Managed services
9.10. Canada Market Size (US$ Mn) Forecast By Deployment , 2015 – 2025
9.10.1. On-premises
9.10.2. Cloud
9.11. Canada Market Size (US$ Mn) Forecast By Industry Vertical, 2015 – 2025
9.11.1. BFSI
9.11.2. IT and Telecommunications
9.11.3. Government and Defense
9.11.4. Energy and Utilities
9.11.5. Manufacturing
9.11.6. Healthcare
9.11.7. Retail
9.11.8. Others
9.12. Rest of North America Market Size (US$ Mn) Forecast By Component, 2015 – 2025
9.12.1. Solutions
9.12.1.1. Web applications
9.12.1.2. Mobile applications
9.12.1.3. Others
9.12.2. Services
9.12.2.1. Professional services
9.12.2.2. Managed services
9.13. Rest of North America Market Size (US$ Mn) Forecast By Deployment , 2015 – 2025
9.13.1. On-premises
9.13.2. Cloud
9.14. Rest of North America Market Size (US$ Mn) Forecast By Industry Vertical, 2015 – 2025
9.14.1. BFSI
9.14.2. IT and Telecommunications
9.14.3. Government and Defense
9.14.4. Energy and Utilities
9.14.5. Manufacturing
9.14.6. Healthcare
9.14.7. Retail
9.14.8. Others
9.15. Market Attractiveness Analysis
9.15.1. By Component
9.15.2. By Deployment
9.15.3. By Industry Vertical
9.15.4. By Country
10. Europe Runtime Application Self-Protection Market Analysis and Forecast
10.1. Key Trends
10.2. Market Size (US$ Mn) Forecast By Component, 2015 – 2025
10.2.1. Solutions
10.2.1.1. Web applications
10.2.1.2. Mobile applications
10.2.1.3. Others
10.2.2. Services
10.2.2.1. Professional services
10.2.2.2. Managed services
10.3. Market Size (US$ Mn) Forecast By Deployment , 2015 – 2025
10.3.1. On-premises
10.3.2. Cloud
10.4. Market Size (US$ Mn) Forecast By Industry Vertical, 2015 – 2025
10.4.1. BFSI
10.4.2. IT and Telecommunications
10.4.3. Government and Defense
10.4.4. Energy and Utilities
10.4.5. Manufacturing
10.4.6. Healthcare
10.4.7. Retail
10.4.8. Others
10.5. Market Size (US$ Mn) Forecast By Country, 2015 – 2025
10.5.1. The U.K.
10.5.2. Germany
10.5.3. France
10.5.4. Rest of North America
10.6. The U.K. Market Size (US$ Mn) Forecast By Component, 2015 – 2025
10.6.1. Solutions
10.6.1.1. Web applications
10.6.1.2. Mobile applications
10.6.1.3. Others
10.6.2. Services
10.6.2.1. Professional services
10.6.2.2. Managed services
10.7. The U.K. Market Size (US$ Mn) Forecast By Deployment , 2015 – 2025
10.7.1. On-premises
10.7.2. Cloud
10.8. The U.K. Market Size (US$ Mn) Forecast By Industry Vertical, 2015 – 2025
10.8.1. BFSI
10.8.2. IT and Telecommunications
10.8.3. Government and Defense
10.8.4. Energy and Utilities
10.8.5. Manufacturing
10.8.6. Healthcare
10.8.7. Retail
10.8.8. Others
10.9. Germany Market Size (US$ Mn) Forecast By Component, 2015 – 2025
10.9.1. Solutions
10.9.1.1. Web applications
10.9.1.2. Mobile applications
10.9.1.3. Others
10.9.2. Services
10.9.2.1. Professional services
10.9.2.2. Managed services
10.10. Germany Market Size (US$ Mn) Forecast By Deployment , 2015 – 2025
10.10.1. On-premises
10.10.2. Cloud
10.11. Germany Market Size (US$ Mn) Forecast By Industry Vertical, 2015 – 2025
10.11.1. BFSI
10.11.2. IT and Telecommunications
10.11.3. Government and Defense
10.11.4. Energy and Utilities
10.11.5. Manufacturing
10.11.6. Healthcare
10.11.7. Retail
10.11.8. Others
10.12. France Market Size (US$ Mn) Forecast By Component, 2015 – 2025
10.12.1. Solutions
10.12.1.1. Web applications
10.12.1.2. Mobile applications
10.12.1.3. Others
10.12.2. Services
10.12.2.1. Professional services
10.12.2.2. Managed services
10.13. France Market Size (US$ Mn) Forecast By Deployment , 2015 – 2025
10.13.1. On-premises
10.13.2. Cloud
10.14. France Market Size (US$ Mn) Forecast By Industry Vertical, 2015 – 2025
10.14.1. BFSI
10.14.2. IT and Telecommunications
10.14.3. Government and Defense
10.14.4. Energy and Utilities
10.14.5. Manufacturing
10.14.6. Healthcare
10.14.7. Retail
i10.14.8. Others
10.15. Rest of Europe Market Size (US$ Mn) Forecast By Component, 2015 – 2025
10.15.1. Solutions
10.15.1.1. Web applications
10.15.1.2. Mobile applications
10.15.1.3. Others
10.15.2. Services
10.15.2.1. Professional services
10.15.2.2. Managed services
10.16. Rest of Europe Market Size (US$ Mn) Forecast By Deployment , 2015 – 2025
10.16.1. On-premises
10.16.2. Cloud
10.17. Rest of Europe Market Size (US$ Mn) Forecast By Industry Vertical, 2015 – 2025
10.17.1. BFSI
10.17.2. IT and Telecommunications
10.17.3. Government and Defense
10.17.4. Energy and Utilities
10.17.5. Manufacturing
10.17.6. Healthcare
10.17.7. Retail
10.17.8. Others
10.18. Market Attractiveness Analysis
10.18.1. By Component
10.18.2. By Deployment
10.18.3. By Industry Vertical
10.18.4. By Country
11. Asia Pacific Runtime Application Self-Protection Market Analysis and Forecast
11.1. Key Trends
11.2. Market Size (US$ Mn) Forecast By Component, 2015 – 2025
11.2.1. Solutions
11.2.1.1. Web applications
11.2.1.2. Mobile applications
11.2.1.3. Others
11.2.2. Services
11.2.2.1. Professional services
11.2.2.2. Managed services
11.3. Market Size (US$ Mn) Forecast By Deployment , 2015 – 2025
11.3.1. On-premises
11.3.2. Cloud
11.4. Market Size (US$ Mn) Forecast By Industry Vertical, 2015 – 2025
11.4.1. BFSI
11.4.2. IT and Telecommunications
11.4.3. Government and Defense
11.4.4. Energy and Utilities
11.4.5. Manufacturing
11.4.6. Healthcare
11.4.7. Retail
11.4.8. Others
11.5. Market Size (US$ Mn) Forecast By Country, 2015 – 2025
11.5.1. China
11.5.2. Japan
11.5.3. India
11.5.4. Rest of North America
11.6. China Market Size (US$ Mn) Forecast By Component, 2015 – 2025
11.6.1. Solutions
11.6.1.1. Web applications
11.6.1.2. Mobile applications
11.6.1.3. Others
11.6.2. Services
11.6.2.1. Professional services
11.6.2.2. Managed services
11.7. China Market Size (US$ Mn) Forecast By Deployment , 2015 – 2025
11.7.1. On-premises
11.7.2. Cloud
11.8. China Market Size (US$ Mn) Forecast By Industry Vertical, 2015 – 2025
11.8.1. BFSI
11.8.2. IT and Telecommunications
11.8.3. Government and Defense
11.8.4. Energy and Utilities
11.8.5. Manufacturing
11.8.6. Healthcare
11.8.7. Retail
11.8.8. Others
11.9. Japan Market Size (US$ Mn) Forecast By Component, 2015 – 2025
11.9.1. Solutions
11.9.1.1. Web applications
11.9.1.2. Mobile applications
11.9.1.3. Others
11.9.2. Services
11.9.2.1. Professional services
11.9.2.2. Managed services
11.10. Japan Market Size (US$ Mn) Forecast By Deployment , 2015 – 2025
11.10.1. On-premises
11.10.2. Cloud
11.11. Japan Market Size (US$ Mn) Forecast By Industry Vertical, 2015 – 2025
11.11.1. BFSI
11.11.2. IT and Telecommunications
11.11.3. Government and Defense
11.11.4. Energy and Utilities
11.11.5. Manufacturing
11.11.6. Healthcare
11.11.7. Retail
11.11.8. Others
11.12. India Market Size (US$ Mn) Forecast By Component, 2015 – 2025
11.12.1. Solutions
11.12.1.1. Web applications
11.12.1.2. Mobile applications
11.12.1.3. Others
11.12.2. Services
11.12.2.1. Professional services
11.12.2.2. Managed services
11.13. India Market Size (US$ Mn) Forecast By Deployment , 2015 – 2025
11.13.1. On-premises
11.13.2. Cloud
11.14. India Market Size (US$ Mn) Forecast By Industry Vertical, 2015 – 2025
11.14.1. BFSI
11.14.2. IT and Telecommunications
11.14.3. Government and Defense
11.14.4. Energy and Utilities
11.14.5. Manufacturing
11.14.6. Healthcare
11.14.7. Retail
11.14.8. Others
11.15. Rest of Asia Pacific Market Size (US$ Mn) Forecast By Component, 2015 – 2025
11.15.1. Solutions
11.15.1.1. Web applications
11.15.1.2. Mobile applications
11.15.1.3. Others
11.15.2. Services
11.15.2.1. Professional services
11.15.2.2. Managed services
11.16. Rest of Asia Pacific Market Size (US$ Mn) Forecast By Deployment , 2015 – 2025
11.16.1. On-premises
11.16.2. Cloud
11.17. Rest of Asia Pacific Market Size (US$ Mn) Forecast By Industry Vertical, 2015 – 2025
11.17.1. BFSI
11.17.2. IT and Telecommunications
11.17.3. Government and Defense
11.17.4. Energy and Utilities
11.17.5. Manufacturing
11.17.6. Healthcare
11.17.7. Retail
11.17.8. Others
11.18. Market Attractiveness Analysis
11.18.1. By Component
11.18.2. By Deployment
11.18.3. By Industry Vertical
11.18.4. By Country
12. Middle East & Africa (MEA) Runtime Application Self-Protection Market Analysis and Forecast
12.1. Key Trends
12.2. Market Size (US$ Mn) Forecast By Component, 2015 – 2025
12.2.1. Solutions
12.2.1.1. Web applications
12.2.1.2. Mobile applications
12.2.1.3. Others
12.2.2. Services
12.2.2.1. Professional services
12.2.2.2. Managed services
12.3. Market Size (US$ Mn) Forecast By Deployment , 2015 – 2025
12.3.1. On-premises
12.3.2. Cloud
12.4. Market Size (US$ Mn) Forecast By Industry Vertical, 2015 – 2025
12.4.1. BFSI
12.4.2. IT and Telecommunications
12.4.3. Government and Defense
12.4.4. Energy and Utilities
12.4.5. Manufacturing
12.4.6. Healthcare
12.4.7. Retail
12.4.8. Others
12.5. Market Size (US$ Mn) Forecast By Country, 2015 – 2025
12.5.1. GCC
12.5.2. South Africa
12.5.3. Rest of Middle East & Africa
12.6. GCC Market Size (US$ Mn) Forecast By Component, 2015 – 2025
12.6.1. Solutions
12.6.1.1. Web applications
12.6.1.2. Mobile applications
12.6.1.3. Others
12.6.2. Services
12.6.2.1. Professional services
12.6.2.2. Managed services
12.7. GCC Market Size (US$ Mn) Forecast By Deployment , 2015 – 2025
12.7.1. On-premises
12.7.2. Cloud
12.8. GCC Market Size (US$ Mn) Forecast By Industry Vertical, 2015 – 2025
12.8.1. BFSI
12.8.2. IT and Telecommunications
12.8.3. Government and Defense
12.8.4. Energy and Utilities
12.8.5. Manufacturing
12.8.6. Healthcare
12.8.7. Retail
12.8.8. Others
12.9. South Africa Market Size (US$ Mn) Forecast By Component, 2015 – 2025
12.9.1. Solutions
12.9.1.1. Web applications
12.9.1.2. Mobile applications
12.9.1.3. Others
12.9.2. Services
12.9.2.1. Professional services
12.9.2.2. Managed services
12.10. South Africa Market Size (US$ Mn) Forecast By Deployment , 2015 – 2025
12.10.1. On-premises
12.10.2. Cloud
12.11. South Africa Market Size (US$ Mn) Forecast By Industry Vertical, 2015 – 2025
12.11.1. BFSI
12.11.2. IT and Telecommunications
12.11.3. Government and Defense
12.11.4. Energy and Utilities
12.11.5. Manufacturing
12.11.6. Healthcare
12.11.7. Retail
12.11.8. Others
12.12. Rest of Middle East & Africa Market Size (US$ Mn) Forecast By Component, 2015 – 2025
12.12.1. Solutions
12.12.1.1. Web applications
12.12.1.2. Mobile applications
12.12.1.3. Others
12.12.2. Services
12.12.2.1. Professional services
12.12.2.2. Managed services
12.13. Rest of Middle East & Africa Market Size (US$ Mn) Forecast By Deployment , 2015 – 2025
12.13.1. On-premises
12.13.2. Cloud
12.14. Rest of Middle East & Africa Market Size (US$ Mn) Forecast By Industry Vertical, 2015 – 2025
12.14.1. BFSI
12.14.2. IT and Telecommunications
12.14.3. Government and Defense
12.14.4. Energy and Utilities
12.14.5. Manufacturing
12.14.6. Healthcare
12.14.7. Retail
12.14.8. Others
12.15. Market Attractiveness Analysis
12.15.1. By Component
12.15.2. By Deployment
12.15.3. By Industry Vertical
12.15.4. By Country
13. South America Runtime Application Self-Protection Market Analysis and Forecast
13.1. Key Trends
13.2. Market Size (US$ Mn) Forecast By Component, 2015 – 2025
13.2.1. Solutions
13.2.1.1. Web applications
13.2.1.2. Mobile applications
13.2.1.3. Others
13.2.2. Services
13.2.2.1. Professional services
13.2.2.2. Managed services
13.3. Market Size (US$ Mn) Forecast By Deployment , 2015 – 2025
13.3.1. On-premises
13.3.2. Cloud
13.4. Market Size (US$ Mn) Forecast By Industry Vertical, 2015 – 2025
13.4.1. BFSI
13.4.2. IT and Telecommunications
13.4.3. Government and Defense
13.4.4. Energy and Utilities
13.4.5. Manufacturing
13.4.6. Healthcare
13.4.7. Retail
13.4.8. Others
13.5. Market Size (US$ Mn) Forecast By Country, 2015 – 2025
13.5.1. Brazil
13.5.2. Rest of South America
13.6. Brazil Market Size (US$ Mn) Forecast By Component, 2015 – 2025
13.6.1. Solutions
13.6.1.1. Web applications
13.6.1.2. Mobile applications
13.6.1.3. Others
13.6.2. Services
13.6.2.1. Professional services
13.6.2.2. Managed services
13.7. Brazil Market Size (US$ Mn) Forecast By Deployment , 2015 – 2025
13.7.1. On-premises
13.7.2. Cloud
13.8. Brazil Market Size (US$ Mn) Forecast By Industry Vertical, 2015 – 2025
13.8.1. BFSI
13.8.2. IT and Telecommunications
13.8.3. Government and Defense
13.8.4. Energy and Utilities
13.8.5. Manufacturing
13.8.6. Healthcare
13.8.7. Retail
13.8.8. Others
13.9. Rest of South America Market Size (US$ Mn) Forecast By Component, 2015 – 2025
13.9.1. Solutions
13.9.1.1. Web applications
13.9.1.2. Mobile applications
13.9.1.3. Others
13.9.2. Services
13.9.2.1. Professional services
13.9.2.2. Managed services
13.10. Rest of South America Market Size (US$ Mn) Forecast By Deployment , 2015 – 2025
13.10.1. On-premises
13.10.2. Cloud
13.11. Rest of South America Market Size (US$ Mn) Forecast By Industry Vertical, 2015 – 2025
13.11.1. BFSI
13.11.2. IT and Telecommunications
13.11.3. Government and Defense
13.11.4. Energy and Utilities
13.11.5. Manufacturing
13.11.6. Healthcare
13.11.7. Retail
13.11.8. Others
13.12. Market Attractiveness Analysis
13.12.1. By Component
13.12.2. By Deployment
13.12.3. By Industry Vertical
13.12.4. By Country
14. Competition Landscape
14.1. Market Player – Competition Matrix
14.2. Market Share Analysis By Company (2016)
14.3. Company Profiles (Details – Overview, Financials, Recent Developments, SWOT, Strategy)
14.3.1. Arxan Technologies, Inc.
14.3.1.1. Company Details
14.3.1.2. Market Presence, By Segment
14.3.1.3. Strategic Overview
14.3.1.4. Financial Details
14.3.1.5. SWOT Analysis
14.3.2. Veracode
14.3.2.1. Company Details
14.3.2.2. Market Presence, By Segment
14.3.2.3. Strategic Overview
14.3.2.4. Financial Details
14.3.2.5. SWOT Analysis
14.3.3. Contrast Security, Inc.
14.3.3.1. Company Details
14.3.3.2. Market Presence, By Segment
14.3.3.3. Strategic Overview
14.3.3.4. Financial Details
14.3.3.5. SWOT Analysis
14.3.4. Micro Focus International plc.
14.3.4.1. Company Details
14.3.4.2. Market Presence, By Segment
14.3.4.3. Strategic Overview
14.3.4.4. Financial Details
14.3.4.5. SWOT Analysis
14.3.5. Signal Sciences
14.3.5.1. Company Details
14.3.5.2. Market Presence, By Segment
14.3.5.3. Strategic Overview
14.3.5.4. Financial Details
14.3.5.5. SWOT Analysis
14.3.6. VASCO Data Security International, Inc.
14.3.6.1. Company Details
14.3.6.2. Market Presence, By Segment
14.3.6.3. Strategic Overview
14.3.6.4. Financial Details
14.3.6.5. SWOT Analysis
14.3.7. Pradeo
14.3.7.1. Company Details
14.3.7.2. Market Presence, By Segment
14.3.7.3. Strategic Overview
14.3.7.4. Financial Details
14.3.7.5. SWOT Analysis
14.3.8. IMMUNIO
14.3.8.1. Company Details
14.3.8.2. Market Presence, By Segment
14.3.8.3. Strategic Overview
14.3.8.4. Financial Details
14.3.8.5. SWOT Analysis
14.3.9. Prevoty Inc.
14.3.9.1. Company Details
14.3.9.2. Market Presence, By Segment
14.3.9.3. Strategic Overview
14.3.9.4. Financial Details
14.3.9.5. SWOT Analysis
14.3.10. Waratek
14.3.10.1. Company Details
14.3.10.2. Market Presence, By Segment
14.3.10.3. Strategic Overview
14.3.10.4. Financial Details
14.3.10.5. SWOT Analysis
15. Key Takeaways
List of Figures
Figure 1: Runtime Application Self-Protection Market Revenue (US$ Mn) Growth Analysis By Component, 2017-2025
Figure 2: Runtime Application Self-Protection Market Revenue (US$ Mn) Growth Analysis By Deployment, 2017-2025
Figure 3: Runtime Application Self-Protection Market Revenue (US$ Mn) Growth Analysis By Industry Vertical, 2017-2025
Figure 4: Runtime Application Self-Protection Market Revenue (US$ Mn) Growth Analysis By Region, 2017-2025
Figure 5: Global Runtime Application Self-Protection Market Size (US$ Mn) Forecast, 2015 - 2025
Figure 6: Global Runtime Application Self-Protection Market Y-o-Y Growth (Value %) Forecast, 2016 - 2025
Figure 7: Global Runtime Application Self-Protection Market Revenue Share Analysis, By Component, 2017 and 2025
Figure 8: Global Runtime Application Self-Protection Market Attractiveness Analysis By, Software Type
Figure 9: Global Runtime Application Self-Protection Market Revenue Share Analysis, By Deployment, 2017 and 2025
Figure 10: Global Runtime Application Self-Protection Market Attractiveness Analysis, By Deployment
Figure 11: Global Runtime Application Self-Protection Market Revenue Share Analysis, By Industry Vertical, 2017 and 2025
Figure 12: Global Runtime Application Self-Protection Market Attractiveness Analysis, By Industry Vertical
Figure 13: Global Runtime Application Self-Protection Market Revenue Share Analysis, By Region, 2017 and 2025
Figure 14: Global Runtime Application Self-Protection Market Attractiveness Analysis, By Region
Figure 15: North America Runtime Application Self-Protection Market Size (US$ Mn) Forecast, 2015–2025
Figure 16: North America Runtime Application Self-Protection Market Size Y-o-Y Growth Projections, 2016–2025
Figure 17: North America Runtime Application Self-Protection Market Revenue Share Analysis, By Component, 2017 and 2025
Figure 18: North America Runtime Application Self-Protection Market Revenue Share Analysis, By Deployment, 2017 and 2025
Figure 19: North America Runtime Application Self-Protection Market Revenue Share Analysis, By Industry Vertical, 2017 and 2025
Figure 20: North America Runtime Application Self-Protection Market Revenue Share Analysis, By Country/Region, 2017 and 2025
Figure 21: The U.S. Runtime Application Self-Protection Market Revenue Share Analysis, By Component, 2017 and 2025
Figure 22: The U.S. Runtime Application Self-Protection Market Revenue Share Analysis, By Deployment, 2017 and 2025
Figure 23: The U.S. Runtime Application Self-Protection Market Revenue Share Analysis, By Industry Vertical, 2017 and 2025
Figure 24: Canada Runtime Application Self-Protection Market Revenue Share Analysis, By Component, 2017 and 2025
Figure 25: Canada Runtime Application Self-Protection Market Revenue Share Analysis, By Deployment, 2017 and 2025
Figure 26: Canada Runtime Application Self-Protection Market Revenue Share Analysis, By Industry Vertical, 2017 and 2025
Figure 27: North America Runtime Application Self-Protection Market Attractiveness Analysis By Component
Figure 28: North America Runtime Application Self-Protection Market Attractiveness Analysis By Deployment
Figure 29: North America Runtime Application Self-Protection Market Attractiveness Analysis, By Industry Vertical
Figure 30: North America Runtime Application Self-Protection Market Attractiveness Analysis, By Country/Region
Figure 31: Europe Runtime Application Self-Protection Market Size (US$ Mn) Forecast, 2015–2025
Figure 32: Europe Runtime Application Self-Protection Market Size Y-o-Y Growth Projections, 2016–2025
Figure 33: Europe Runtime Application Self-Protection Market Revenue Share Analysis, By Component, 2017 and 2025
Figure 34: Europe Runtime Application Self-Protection Market Revenue Share Analysis, By Deployment, 2017 and 2025
Figure 35: Europe Runtime Application Self-Protection Market Revenue Share Analysis, By Industry Vertical, 2017 and 2025
Figure 36: Europe Runtime Application Self-Protection Market Revenue Share Analysis, By Country/Region, 2017 and 2025
Figure 37: The U.K. Runtime Application Self-Protection Market Revenue Share Analysis, By Component, 2017 and 2025
Figure 38: The U.K. Runtime Application Self-Protection Market Revenue Share Analysis, By Deployment, 2017 and 2025
Figure 39: The U.K. Runtime Application Self-Protection Market Revenue Share Analysis, By Industry Vertical, 2017 and 2025
Figure 40: Germany Runtime Application Self-Protection Market Revenue Share Analysis, By Component, 2017 and 2025
Figure 41: Germany Runtime Application Self-Protection Market Revenue Share Analysis, By Deployment, 2017 and 2025
Figure 42: Germany Runtime Application Self-Protection Market Revenue Share Analysis, By Industry Vertical, 2017 and 2025
Figure 43: France Runtime Application Self-Protection Market Revenue Share Analysis, By Component, 2017 and 2025
Figure 44: France Runtime Application Self-Protection Market Revenue Share Analysis, By Deployment, 2017 and 2025
Figure 45: France Runtime Application Self-Protection Market Revenue Share Analysis, By Industry Vertical, 2017 and 2025
Figure 46: Europe Runtime Application Self-Protection Market Attractiveness Analysis By Component
Figure 47: Europe Runtime Application Self-Protection Market Attractiveness Analysis By Deployment
Figure 48: Europe Runtime Application Self-Protection Market Attractiveness Analysis, By Industry Vertical
Figure 49: Europe Runtime Application Self-Protection Market Attractiveness Analysis, By Country/Region
Figure 50: Asia Pacific Runtime Application Self-Protection Market Size (US$ Mn) Forecast, 2015–2025
Figure 51: Asia Pacific Runtime Application Self-Protection Market Size Y-o-Y Growth Projections, 2016–2025
Figure 52: Asia Pacific Runtime Application Self-Protection Market Revenue Share Analysis, By Component, 2017 and 2025
Figure 53: Asia Pacific Runtime Application Self-Protection Market Revenue Share Analysis, By Deployment, 2017 and 2025
Figure 54: Asia Pacific Runtime Application Self-Protection Market Revenue Share Analysis, By Industry Vertical, 2017 and 2025
Figure 55: Asia Pacific Runtime Application Self-Protection Market Revenue Share Analysis, By Country/Region, 2017 and 2025
Figure 56: China Runtime Application Self-Protection Market Revenue Share Analysis, By Component, 2017 and 2025
Figure 57: China Runtime Application Self-Protection Market Revenue Share Analysis, By Deployment, 2017 and 2025
Figure 58: China Runtime Application Self-Protection Market Revenue Share Analysis, By Industry Vertical, 2017 and 2025
Figure 59: Japan Runtime Application Self-Protection Market Revenue Share Analysis, By Component, 2017 and 2025
Figure 60: Japan Runtime Application Self-Protection Market Revenue Share Analysis, By Deployment, 2017 and 2025
Figure 61: Japan Runtime Application Self-Protection Market Revenue Share Analysis, By Industry Vertical, 2017 and 2025
Figure 62: India Runtime Application Self-Protection Market Revenue Share Analysis, By Component, 2017 and 2025
Figure 63: India Runtime Application Self-Protection Market Revenue Share Analysis, By Deployment, 2017 and 2025
Figure 64: India Runtime Application Self-Protection Market Revenue Share Analysis, By Industry Vertical, 2017 and 2025
Figure 65: Asia Pacific Runtime Application Self-Protection Market Attractiveness Analysis By Component
Figure 66: Asia Pacific Runtime Application Self-Protection Market Attractiveness Analysis By Deployment
Figure 67: Asia Pacific Runtime Application Self-Protection Market Attractiveness Analysis, By Industry Vertical
Figure 68: Asia Pacific Runtime Application Self-Protection Market Attractiveness Analysis, By Country/Region
Figure 69: Middle East and Africa Runtime Application Self-Protection Market Size (US$ Mn) Forecast, 2015–2025
Figure 70: Middle East and Africa Runtime Application Self-Protection Market Size Y-o-Y Growth Projections, 2016–2025
Figure 71: Middle East and Africa Runtime Application Self-Protection Market Revenue Share Analysis, By Component, 2017 and 2025
Figure 72: Middle East and Africa Runtime Application Self-Protection Market Revenue Share Analysis, By Deployment, 2017 and 2025
Figure 73: Middle East and Africa Runtime Application Self-Protection Market Revenue Share Analysis, By Deployment, 2017 and 2025
Figure 74: Middle East and Africa Runtime Application Self-Protection Market Revenue Share Analysis, By Deployment, 2017 and 2025
Figure 75: Middle East and Africa Runtime Application Self-Protection Market Revenue Share Analysis, By Deployment, 2017 and 2025
Figure 76: Middle East and Africa Runtime Application Self-Protection Market Revenue Share Analysis, By Deployment, 2017 and 2025
Figure 77: Middle East and Africa Runtime Application Self-Protection Market Revenue Share Analysis, By Deployment, 2017 and 2025
Figure 78: Middle East and Africa Runtime Application Self-Protection Market Revenue Share Analysis, By Deployment, 2017 and 2025
Figure 79: Middle East and Africa Runtime Application Self-Protection Market Revenue Share Analysis, By Deployment, 2017 and 2025
Figure 80: Middle East and Africa Runtime Application Self-Protection Market Revenue Share Analysis, By Deployment, 2017 and 2025
Figure 81: Middle East and Africa Runtime Application Self-Protection Market Revenue Share Analysis, By Deployment, 2017 and 2025
Figure 82: Middle East and Africa Runtime Application Self-Protection Market Revenue Share Analysis, By Deployment, 2017 and 2025
Figure 83: Middle East and Africa Runtime Application Self-Protection Market Attractiveness Analysis, By Industry Vertical
Figure 84: Middle East and Africa Runtime Application Self-Protection Market Attractiveness Analysis, By Country/Region
Figure 85: South America Runtime Application Self-Protection Market Size (US$ Mn) Forecast, 2015–2025
Figure 86: South America Runtime Application Self-Protection Market Size Y-o-Y Growth Projections, 2016–2025
Figure 87: South America Runtime Application Self-Protection Market Revenue Share Analysis, By Component, 2017 and 2025
Figure 88: South America Runtime Application Self-Protection Market Revenue Share Analysis, By Deployment, 2017 and 2025
Figure 89: South America Runtime Application Self-Protection Market Revenue Share Analysis, By Industry Vertical, 2017 and 2025
Figure 90: South America Runtime Application Self-Protection Market Revenue Share Analysis, By Country/Region, 2017 and 2025
Figure 91: Brazil Runtime Application Self-Protection Market Revenue Share Analysis, By Component, 2017 and 2025
Figure 92: Brazil Runtime Application Self-Protection Market Revenue Share Analysis, By Deployment, 2017 and 2025
Figure 93: Brazil Runtime Application Self-Protection Market Revenue Share Analysis, By Industry Vertical, 2017 and 2025
Figure 94: South America Runtime Application Self-Protection Market Attractiveness Analysis By Component
Figure 95: South America Runtime Application Self-Protection Market Attractiveness Analysis By Deployment
Figure 96: South America Runtime Application Self-Protection Market Attractiveness Analysis, By Industry Vertical
Figure 97: South America Runtime Application Self-Protection Market Attractiveness Analysis, By Country/Region
Figure 98: Runtime Application Self-Protection Market Share Analysis, By Company (2016)
Copyright © Transparency Market Research, Inc. All Rights reserved
Trust Online

Runtime Application Self-Protection Market