
Reports
Reports
Quality management software is essential to manage and maintain the quality and is closely associated with customer satisfaction, competitiveness of the firm as well as performance. These three aspects can be achieved by ensuring consistency in production control and product innovation and development and also regulating various processes involved in manufacturing thus lowering the gap between the should and the can.
Transparency Market Research in its recent publication on quality management software market has covered several acumen linked with the global market. These research acumen include developments in software, trends, drivers and challenges that have an impact on the expansion of the global quality management software market. Additionally, future market projections have been included in this analytical research study that give forecast analysis on each and every segment of the quality management software market.
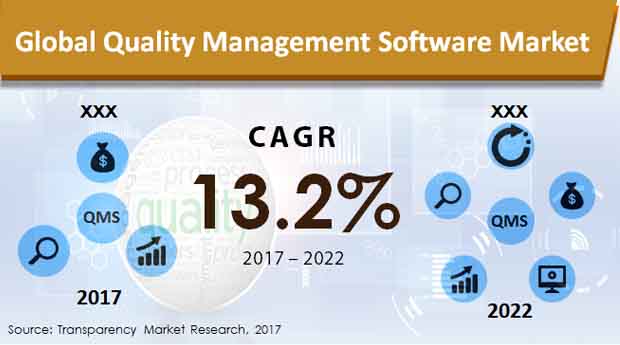
According to the fact based research report on the global market for quality management software, it is anticipated to show an exponential growth rate during the period of forecast. It is estimated to be valued at about US$ 24.4 Bn by the end of the forecast period and is poised to grow at a significant CAGR during the 2017-2022 timeline.
Audit Management to Gain High Preference in the Coming Years
Audit management segment by solution type is anticipated to gain high importance in the coming years. This segment portrays high potential from market value and growth standpoints. The audit management segment is poised to expand at a robust CAGR of 15.6% throughout the period of forecast 2017-2022. It is also anticipated to gain a high BPS by the end of the forecast year. Following audit management, the complaint management segment has gained high traction, making it the second largest segment, growth wise and market share wise. It is estimated to reflect a high market valuation of around US$ 3.2 Bn by 2022 end.
Tough Call to Make Between EH & S and Supplier Quality Management
EH & S management and supplier quality management segments in the solution category are anticipated to show similar growth graphs in the coming time. Both these segments are expected to gain significant BPS by the end of the forecasted year and are poised to grow at similar CAGRs. However, the EH & S segment is a shade better than supplier quality management segment and is estimated to reflect a market valuation of more than US$ 2.5 Bn by 2022 end.
Healthcare and Life Sciences is the Titan
Healthcare and life sciences segment by the end use industry category is the largest segment. In 2017, it reflected a market share of more than 60% and is expected to dominate the global market in the coming future. By 2022 end, it is estimated to reach a valuation of more than US$ 15.5 Bn, thus becoming the largest segment in the end user category. The automotive segment also shows good pace and is poised to reflect the highest CAGR throughout the period of forecast.
Competitive Analysis
The global market study on quality management software includes profiles of key companies that are actively involved in quality management software production and distribution. Companies such as International Business Machines Corp, Microsoft Corporation, SAP SE, Oracle Corp, Hewlett Packard Enterprise Company, Siemens AG, MasterControl Inc., Dassault Systèmes SE and Sparta Systems, Inc., are profiled in this research report.
1. Global Quality Management Software Market - Executive Summary
2. Global Quality Management Software Market Overview
2.1. Introduction
2.1.1. Global Quality Management Software Market Taxonomy
2.1.2. Global Quality Management Software Market Definition
2.2. Global Quality Management Software Market Size (US$ Mn) and Forecast, 2012-2022
2.2.1. Global Quality Management Software Market Y-o-Y Growth
2.3. Global Quality Management Software Market Dynamics
2.4. Regional Key Insights
2.5. Value Chain
2.6. List of Vendors
2.7. Cost Structures
2.8. Regional Key Developments
2.9. Key Participants Market Presence (Intensity Map) By Region
3. Global Quality Management Software Market Analysis and Forecast By Deployment Type
3.1. Global Quality Management Software Market Size and Forecast By Deployment Type, 2012-2022
3.1.1. On premise Market Size and Forecast, 2012-2022
3.1.1.1. Revenue (US$ Mn) Comparison, By Region
3.1.1.2. Market Share Comparison, By Region
3.1.1.3. Y-o-Y growth Comparison, By Region
3.1.2. Cloud-Based Market Size and Forecast, 2012-2022
3.1.2.1. Revenue (US$ Mn) Comparison, By Region
3.1.2.2. Market Share Comparison, By Region
3.1.2.3. Y-o-Y growth Comparison, By Region
4. Global Quality Management Software Market Analysis and Forecast By End-Use Industry
4.1. Global Quality Management Software Market Size and Forecast By End-Use Industry, 2012-2022
4.1.1. Aerospace and Defense Market Size and Forecast, 2012-2022
4.1.1.1. Revenue (US$ Mn) Comparison, By Region
4.1.1.2. Market Share Comparison, By Region
4.1.1.3. Y-o-Y growth Comparison, By Region
4.1.2. Automotive Market Size and Forecast, 2012-2022
4.1.2.1. Revenue (US$ Mn) Comparison, By Region
4.1.2.2. Market Share Comparison, By Region
4.1.2.3. Y-o-Y growth Comparison, By Region
4.1.3. Consumer Goods and Retail Market Size and Forecast, 2012-2022
4.1.3.1. Revenue (US$ Mn) Comparison, By Region
4.1.3.2. Market Share Comparison, By Region
4.1.3.3. Y-o-Y growth Comparison, By Region
4.1.4. Healthcare and Life Sciences Market Size and Forecast, 2012-2022
4.1.4.1. Revenue (US$ Mn) Comparison, By Region
4.1.4.2. Market Share Comparison, By Region
4.1.4.3. Y-o-Y growth Comparison, By Region
4.1.5. ITES and Telecom Market Size and Forecast, 2012-2022
4.1.5.1. Revenue (US$ Mn) Comparison, By Region
4.1.5.2. Market Share Comparison, By Region
4.1.5.3. Y-o-Y growth Comparison, By Region
4.1.6. Other industries Market Size and Forecast, 2012-2022
4.1.6.1. Revenue (US$ Mn) Comparison, By Region
4.1.6.2. Market Share Comparison, By Region
4.1.6.3. Y-o-Y growth Comparison, By Region
5. Global Quality Management Software Market Analysis and Forecast By Solution Type
5.1. Global Quality Management Software Market Size and Forecast By Solution Type, 2012-2022
5.1.1. Audit Management Market Size and Forecast, 2012-2022
5.1.1.1. Revenue (US$ Mn) Comparison, By Region
5.1.1.2. Market Share Comparison, By Region
5.1.1.3. Y-o-Y growth Comparison, By Region
5.1.2. Complaint Management Market Size and Forecast, 2012-2022
5.1.2.1. Revenue (US$ Mn) Comparison, By Region
5.1.2.2. Market Share Comparison, By Region
5.1.2.3. Y-o-Y growth Comparison, By Region
5.1.3. Training Management Market Size and Forecast, 2012-2022
5.1.3.1. Revenue (US$ Mn) Comparison, By Region
5.1.3.2. Market Share Comparison, By Region
5.1.3.3. Y-o-Y growth Comparison, By Region
5.1.4. CAPA Management Market Size and Forecast, 2012-2022
5.1.4.1. Revenue (US$ Mn) Comparison, By Region
5.1.4.2. Market Share Comparison, By Region
5.1.4.3. Y-o-Y growth Comparison, By Region
5.1.5. Document Management Market Size and Forecast, 2012-2022
5.1.5.1. Revenue (US$ Mn) Comparison, By Region
5.1.5.2. Market Share Comparison, By Region
5.1.5.3. Y-o-Y growth Comparison, By Region
5.1.6. Change Control Market Size and Forecast, 2012-2022
5.1.6.1. Revenue (US$ Mn) Comparison, By Region
5.1.6.2. Market Share Comparison, By Region
5.1.6.3. Y-o-Y growth Comparison, By Region
5.1.7. Product Registration Market Size and Forecast, 2012-2022
5.1.7.1. Revenue (US$ Mn) Comparison, By Region
5.1.7.2. Market Share Comparison, By Region
5.1.7.3. Y-o-Y growth Comparison, By Region
5.1.8. EH&S Management Market Size and Forecast, 2012-2022
5.1.8.1. Revenue (US$ Mn) Comparison, By Region
5.1.8.2. Market Share Comparison, By Region
5.1.8.3. Y-o-Y growth Comparison, By Region
5.1.9. Supplier Quality Management Market Size and Forecast, 2012-2022
5.1.9.1. Revenue (US$ Mn) Comparison, By Region
5.1.9.2. Market Share Comparison, By Region
5.1.9.3. Y-o-Y growth Comparison, By Region
5.1.10. Other Solutions Market Size and Forecast, 2012-2022
5.1.10.1. Revenue (US$ Mn) Comparison, By Region
5.1.10.2. Market Share Comparison, By Region
5.1.10.3. Y-o-Y growth Comparison, By Region
6. Global Quality Management Software Market Analysis and Forecast By Organization Type
6.1. Global Quality Management Software Market Size and Forecast By Organization Type, 2012-2022
6.1.1. Large Enterprises Market Size and Forecast, 2012-2022
6.1.1.1. Revenue (US$ Mn) Comparison, By Region
6.1.1.2. Market Share Comparison, By Region
6.1.1.3. Y-o-Y growth Comparison, By Region
6.1.2. Small & Medium Enterprises Market Size and Forecast, 2012-2022
6.1.2.1. Revenue (US$ Mn) Comparison, By Region
6.1.2.2. Market Share Comparison, By Region
6.1.2.3. Y-o-Y growth Comparison, By Region
7. Global Quality Management Software Market Analysis and Forecast By Region
7.1. Global Quality Management Software Market Size and Forecast, 2012-2022
7.1.1. North America Quality Management Software Market Size and Forecast, 2012-2022
7.1.1.1. Revenue (US$ Mn) Comparison, By Deployment Type
7.1.1.2. Revenue (US$ Mn) Comparison, By End-Use Industry
7.1.1.3. Revenue (US$ Mn) Comparison, By Solution Type
7.1.1.4. Revenue (US$ Mn) Comparison, By Organization Type
7.1.2. Latin America Quality Management Software Market Size and Forecast, 2012-2022
7.1.2.1. Revenue (US$ Mn) Comparison, By Deployment Type
7.1.2.2. Revenue (US$ Mn) Comparison, By End-Use Industry
7.1.2.3. Revenue (US$ Mn) Comparison, By Solution Type
7.1.2.4. Revenue (US$ Mn) Comparison, By Organization Type
7.1.3. Europe Quality Management Software Market Size and Forecast, 2012-2022
7.1.3.1. Revenue (US$ Mn) Comparison, By Deployment Type
7.1.3.2. Revenue (US$ Mn) Comparison, By End-Use Industry
7.1.3.3. Revenue (US$ Mn) Comparison, By Solution Type
7.1.3.4. Revenue (US$ Mn) Comparison, By Organization Type
7.1.4. Japan Quality Management Software Market Size and Forecast, 2012-2022
7.1.4.1. Revenue (US$ Mn) Comparison, By Deployment Type
7.1.4.2. Revenue (US$ Mn) Comparison, By End-Use Industry
7.1.4.3. Revenue (US$ Mn) Comparison, By Solution Type
7.1.4.4. Revenue (US$ Mn) Comparison, By Organization Type
7.1.5. APEJ Quality Management Software Market Size and Forecast, 2012-2022
7.1.5.1. Revenue (US$ Mn) Comparison, By Deployment Type
7.1.5.2. Revenue (US$ Mn) Comparison, By End-Use Industry
7.1.5.3. Revenue (US$ Mn) Comparison, By Solution Type
7.1.5.4. Revenue (US$ Mn) Comparison, By Organization Type
7.1.6. MEA Quality Management Software Market Size and Forecast, 2012-2022
7.1.6.1. Revenue (US$ Mn) Comparison, By Deployment Type
7.1.6.2. Revenue (US$ Mn) Comparison, By End-Use Industry
7.1.6.3. Revenue (US$ Mn) Comparison, By Solution Type
7.1.6.4. Revenue (US$ Mn) Comparison, By Organization Type
8. North America Quality Management Software Market Analysis and Forecast, By Country, 2012-2022
8.1. US Quality Management Software Market Size and Forecast, 2012-2022
8.1.1. Revenue (US$ Mn) Comparison, By Deployment Type
8.1.2. Revenue (US$ Mn) Comparison, By End-Use Industry
8.1.3. Revenue (US$ Mn) Comparison, By Solution Type
8.1.4. Revenue (US$ Mn) Comparison, By Organization Type
8.2. Canada Quality Management Software Market Size and Forecast, 2012-2022
8.2.1. Revenue (US$ Mn) Comparison, By Deployment Type
8.2.2. Revenue (US$ Mn) Comparison, By End-Use Industry
8.2.3. Revenue (US$ Mn) Comparison, By Solution Type
8.2.4. Revenue (US$ Mn) Comparison, By Organization Type
9. Latin America Quality Management Software Market Analysis and Forecast, By Country, 2012-2022
9.1. Brazil Quality Management Software Market Size and Forecast, 2012-2022
9.1.1. Revenue (US$ Mn) Comparison, By Deployment Type
9.1.2. Revenue (US$ Mn) Comparison, By End-Use Industry
9.1.3. Revenue (US$ Mn) Comparison, By Solution Type
9.1.4. Revenue (US$ Mn) Comparison, By Organization Type
9.2. Mexico Quality Management Software Market Size and Forecast, 2012-2022
9.2.1. Revenue (US$ Mn) Comparison, By Deployment Type
9.2.2. Revenue (US$ Mn) Comparison, By End-Use Industry
9.2.3. Revenue (US$ Mn) Comparison, By Solution Type
9.2.4. Revenue (US$ Mn) Comparison, By Organization Type
9.3. Argentina Quality Management Software Market Size and Forecast, 2012-2022
9.3.1. Revenue (US$ Mn) Comparison, By Deployment Type
9.3.2. Revenue (US$ Mn) Comparison, By End-Use Industry
9.3.3. Revenue (US$ Mn) Comparison, By Solution Type
9.3.4. Revenue (US$ Mn) Comparison, By Organization Type
9.4. Rest of Latin America Quality Management Software Market Size and Forecast, 2012-2022
9.4.1. Revenue (US$ Mn) Comparison, By Deployment Type
9.4.2. Revenue (US$ Mn) Comparison, By End-Use Industry
9.4.3. Revenue (US$ Mn) Comparison, By Solution Type
9.4.4. Revenue (US$ Mn) Comparison, By Organization Type
10. Europe Quality Management Software Market Analysis and Forecast, By Country, 2012-2022
10.1. Germany Quality Management Software Market Size and Forecast, 2012-2022
10.1.1. Revenue (US$ Mn) Comparison, By Deployment Type
10.1.2. Revenue (US$ Mn) Comparison, By End-Use Industry
10.1.3. Revenue (US$ Mn) Comparison, By Solution Type
10.1.4. Revenue (US$ Mn) Comparison, By Organization Type
10.2. UK Quality Management Software Market Size and Forecast, 2012-2022
10.2.1. Revenue (US$ Mn) Comparison, By Deployment Type
10.2.2. Revenue (US$ Mn) Comparison, By End-Use Industry
10.2.3. Revenue (US$ Mn) Comparison, By Solution Type
10.2.4. Revenue (US$ Mn) Comparison, By Organization Type
10.3. France Quality Management Software Market Size and Forecast, 2012-2022
10.3.1. Revenue (US$ Mn) Comparison, By Deployment Type
10.3.2. Revenue (US$ Mn) Comparison, By End-Use Industry
10.3.3. Revenue (US$ Mn) Comparison, By Solution Type
10.3.4. Revenue (US$ Mn) Comparison, By Organization Type
10.4. Spain Quality Management Software Market Size and Forecast, 2012-2022
10.4.1. Revenue (US$ Mn) Comparison, By Deployment Type
10.4.2. Revenue (US$ Mn) Comparison, By End-Use Industry
10.4.3. Revenue (US$ Mn) Comparison, By Solution Type
10.4.4. Revenue (US$ Mn) Comparison, By Organization Type
10.5. Italy Quality Management Software Market Size and Forecast, 2012-2022
10.5.1. Revenue (US$ Mn) Comparison, By Deployment Type
10.5.2. Revenue (US$ Mn) Comparison, By End-Use Industry
10.5.3. Revenue (US$ Mn) Comparison, By Solution Type
10.5.4. Revenue (US$ Mn) Comparison, By Organization Type
10.6. Rest of Europe Quality Management Software Market Size and Forecast, 2012-2022
10.6.1. Revenue (US$ Mn) Comparison, By Deployment Type
10.6.2. Revenue (US$ Mn) Comparison, By End-Use Industry
10.6.3. Revenue (US$ Mn) Comparison, By Solution Type
10.6.4. Revenue (US$ Mn) Comparison, By Organization Type
11. Japan Quality Management Software Market Analysis and Forecast, By Country, 2012-2022
11.1. Japan Quality Management Software Market Size and Forecast, 2012-2022
11.1.1. Revenue (US$ Mn) Comparison, By Deployment Type
11.1.2. Revenue (US$ Mn) Comparison, By End-Use Industry
11.1.3. Revenue (US$ Mn) Comparison, By Solution Type
11.1.4. Revenue (US$ Mn) Comparison, By Organization Type
12. APEJ Quality Management Software Market Analysis and Forecast, By Country, 2012-2022
12.1. China Quality Management Software Market Size and Forecast, 2012-2022
12.1.1. Revenue (US$ Mn) Comparison, By Deployment Type
12.1.2. Revenue (US$ Mn) Comparison, By End-Use Industry
12.1.3. Revenue (US$ Mn) Comparison, By Solution Type
12.1.4. Revenue (US$ Mn) Comparison, By Organization Type
12.2. India Quality Management Software Market Size and Forecast, 2012-2022
12.2.1. Revenue (US$ Mn) Comparison, By Deployment Type
12.2.2. Revenue (US$ Mn) Comparison, By End-Use Industry
12.2.3. Revenue (US$ Mn) Comparison, By Solution Type
12.2.4. Revenue (US$ Mn) Comparison, By Organization Type
12.3. Malaysia Quality Management Software Market Size and Forecast, 2012-2022
12.3.1. Revenue (US$ Mn) Comparison, By Deployment Type
12.3.2. Revenue (US$ Mn) Comparison, By End-Use Industry
12.3.3. Revenue (US$ Mn) Comparison, By Solution Type
12.3.4. Revenue (US$ Mn) Comparison, By Organization Type
12.4. Singapore Quality Management Software Market Size and Forecast, 2012-2022
12.4.1. Revenue (US$ Mn) Comparison, By Deployment Type
12.4.2. Revenue (US$ Mn) Comparison, By End-Use Industry
12.4.3. Revenue (US$ Mn) Comparison, By Solution Type
12.4.4. Revenue (US$ Mn) Comparison, By Organization Type
12.5. Australia Quality Management Software Market Size and Forecast, 2012-2022
12.5.1. Revenue (US$ Mn) Comparison, By Deployment Type
12.5.2. Revenue (US$ Mn) Comparison, By End-Use Industry
12.5.3. Revenue (US$ Mn) Comparison, By Solution Type
12.5.4. Revenue (US$ Mn) Comparison, By Organization Type
12.6. Rest of APEJ Quality Management Software Market Size and Forecast, 2012-2022
12.6.1. Revenue (US$ Mn) Comparison, By Deployment Type
12.6.2. Revenue (US$ Mn) Comparison, By End-Use Industry
12.6.3. Revenue (US$ Mn) Comparison, By Solution Type
12.6.4. Revenue (US$ Mn) Comparison, By Organization Type
13. MEA Quality Management Software Market Analysis and Forecast, By Country, 2012-2022
13.1. GCC Countries Quality Management Software Market Size and Forecast, 2012-2022
13.1.1. Revenue (US$ Mn) Comparison, By Deployment Type
13.1.2. Revenue (US$ Mn) Comparison, By End-Use Industry
13.1.3. Revenue (US$ Mn) Comparison, By Solution Type
13.1.4. Revenue (US$ Mn) Comparison, By Organization Type
13.2. South Africa Quality Management Software Market Size and Forecast, 2012-2022
3.2.1. Revenue (US$ Mn) Comparison, By Deployment Type
13.2.2. Revenue (US$ Mn) Comparison, By End-Use Industry
13.2.3. Revenue (US$ Mn) Comparison, By Solution Type
13.2.4. Revenue (US$ Mn) Comparison, By Organization Type
13.3. Israel Quality Management Software Market Size and Forecast, 2012-2022
13.3.1. Revenue (US$ Mn) Comparison, By Deployment Type
13.3.2. Revenue (US$ Mn) Comparison, By End-Use Industry
13.3.3. Revenue (US$ Mn) Comparison, By Solution Type
13.3.4. Revenue (US$ Mn) Comparison, By Organization Type
13.4. Rest of MEA Quality Management Software Market Size and Forecast, 2012-2022
13.4.1. Revenue (US$ Mn) Comparison, By Deployment Type
13.4.2. Revenue (US$ Mn) Comparison, By End-Use Industry
13.4.3. Revenue (US$ Mn) Comparison, By Solution Type
13.4.4. Revenue (US$ Mn) Comparison, By Organization Type
14. Global Quality Management Software Market Company Share, Competition Landscape and Company Profiles
14.1. Company Share Analysis
14.2. Competition Landscape
14.3. Company Profiles
14.3.1. International Business Machines Corp.
14.3.2. Microsoft Corporation
14.3.3. SAP SE.
14.3.4.Oracle Corp.
14.3.5. Hewlett Packard Enterprise Company
14.3.6. Siemens AG
14.3.7.Sparta Systems, Inc
14.3.8. MasterControl Inc.
14.3.9. Dassault Systèmes SE
14.3.10. Sparta Systems, Inc
15. Research Methodology
16. Secondary and Primary Sources
17. Assumptions and Acronyms
18. Disclaimer
List of Tables
TABLE 1 Global Quality Management Software Market Value (US$ Mn), 2012-2016
TABLE 2 Global Quality Management Software Market Value (US$ Mn), 2017-2022
TABLE 3 Global Quality Management Software Market Value (US$ Mn) and Y-o-Y, 2015-2022
TABLE 4 Global On premise Segment Value (US$ Mn), By Region 2012-2016
TABLE 5 Global On premise Segment Value (US$ Mn), By Region 2017-2022
TABLE 6 Global On premise Segment Market Share, By Region 2012-2016
TABLE 7 Global On premise Segment Market Share, By Region 2017-2022
TABLE 8 Global On premise Segment Y-o-Y, By Region 2015-2022
TABLE 9 Global Cloud-Based Segment Value (US$ Mn), By Region 2012-2016
TABLE 10 Global Cloud-Based Segment Value (US$ Mn), By Region 2017-2022
TABLE 11 Global Cloud-Based Segment Market Share, By Region 2012-2016
TABLE 12 Global Cloud-Based Segment Market Share, By Region 2017-2022
TABLE 13 Global Cloud-Based Segment Y-o-Y, By Region 2015-2022
TABLE 14 Global Aerospace and Defense Segment Value (US$ Mn), By Region 2012-2016
TABLE 15 Global Aerospace and Defense Segment Value (US$ Mn), By Region 2017-2022
TABLE 16 Global Aerospace and Defense Segment Market Share, By Region 2012-2016
TABLE 17 Global Aerospace and Defense Segment Market Share, By Region 2017-2022
TABLE 18 Global Aerospace and Defense Segment Y-o-Y, By Region 2015-2022
TABLE 19 Global Automotive Segment Value (US$ Mn), By Region 2012-2016
TABLE 20 Global Automotive Segment Value (US$ Mn), By Region 2017-2022
TABLE 21 Global Automotive Segment Market Share, By Region 2012-2016
TABLE 22 Global Automotive Segment Market Share, By Region 2017-2022
TABLE 23 Global Automotive Segment Y-o-Y, By Region 2015-2022
TABLE 24 Global Consumer Goods and Retail Segment Value (US$ Mn), By Region 2012-2016
TABLE 25 Global Consumer Goods and Retail Segment Value (US$ Mn), By Region 2017-2022
TABLE 26 Global Consumer Goods and Retail Segment Market Share, By Region 2012-2016
TABLE 27 Global Consumer Goods and Retail Segment Market Share, By Region 2017-2022
TABLE 28 Global Consumer Goods and Retail Segment Y-o-Y, By Region 2015-2022
TABLE 29 Global Healthcare and Life Sciences Segment Value (US$ Mn), By Region 2012-2016
TABLE 30 Global Healthcare and Life Sciences Segment Value (US$ Mn), By Region 2017-2022
TABLE 31 Global Healthcare and Life Sciences Segment Market Share, By Region 2012-2016
TABLE 32 Global Healthcare and Life Sciences Segment Market Share, By Region 2017-2022
TABLE 33 Global Healthcare and Life Sciences Segment Y-o-Y, By Region 2015-2022
TABLE 34 Global ITES and Telecom Segment Value (US$ Mn), By Region 2012-2016
TABLE 35 Global ITES and Telecom Segment Value (US$ Mn), By Region 2017-2022
TABLE 36 Global ITES and Telecom Segment Market Share, By Region 2012-2016
TABLE 37 Global ITES and Telecom Segment Market Share, By Region 2017-2022
TABLE 38 Global ITES and Telecom Segment Y-o-Y, By Region 2015-2022
TABLE 39 Global Other industries Segment Value (US$ Mn), By Region 2012-2016
TABLE 40 Global Other industries Segment Value (US$ Mn), By Region 2017-2022
TABLE 41 Global Other industries Segment Market Share, By Region 2012-2016
TABLE 42 Global Other industries Segment Market Share, By Region 2017-2022
TABLE 43 Global Other industries Segment Y-o-Y, By Region 2015-2022
TABLE 44 Global Audit Management Segment Value (US$ Mn), By Region 2012-2016
TABLE 45 Global Audit Management Segment Value (US$ Mn), By Region 2017-2022
TABLE 46 Global Audit Management Segment Market Share, By Region 2012-2016
TABLE 47 Global Audit Management Segment Market Share, By Region 2017-2022
TABLE 48 Global Audit Management Segment Y-o-Y, By Region 2015-2022
TABLE 49 Global Complaint Management Segment Value (US$ Mn), By Region 2012-2016
TABLE 50 Global Complaint Management Segment Value (US$ Mn), By Region 2017-2022
TABLE 51 Global Complaint Management Segment Market Share, By Region 2012-2016
TABLE 52 Global Complaint Management Segment Market Share, By Region 2017-2022
TABLE 53 Global Complaint Management Segment Y-o-Y, By Region 2015-2022
TABLE 54 Global Training Management Segment Value (US$ Mn), By Region 2012-2016
TABLE 55 Global Training Management Segment Value (US$ Mn), By Region 2017-2022
TABLE 56 Global Training Management Segment Market Share, By Region 2012-2016
TABLE 57 Global Training Management Segment Market Share, By Region 2017-2022
TABLE 58 Global Training Management Segment Y-o-Y, By Region 2015-2022
TABLE 59 Global CAPA Management Segment Value (US$ Mn), By Region 2012-2016
TABLE 60 Global CAPA Management Segment Value (US$ Mn), By Region 2017-2022
TABLE 61 Global CAPA Management Segment Market Share, By Region 2012-2016
TABLE 62 Global CAPA Management Segment Market Share, By Region 2017-2022
TABLE 63 Global CAPA Management Segment Y-o-Y, By Region 2015-2022
TABLE 64 Global Document Management Segment Value (US$ Mn), By Region 2012-2016
TABLE 65 Global Document Management Segment Value (US$ Mn), By Region 2017-2022
TABLE 66 Global Document Management Segment Market Share, By Region 2012-2016
TABLE 67 Global Document Management Segment Market Share, By Region 2017-2022
TABLE 68 Global Document Management Segment Y-o-Y, By Region 2015-2022
TABLE 69 Global Change Control Segment Value (US$ Mn), By Region 2012-2016
TABLE 70 Global Change Control Segment Value (US$ Mn), By Region 2017-2022
TABLE 71 Global Change Control Segment Market Share, By Region 2012-2016
TABLE 72 Global Change Control Segment Market Share, By Region 2017-2022
TABLE 73 Global Change Control Segment Y-o-Y, By Region 2015-2022
TABLE 74 Global Product Registration Segment Value (US$ Mn), By Region 2012-2016
TABLE 75 Global Product Registration Segment Value (US$ Mn), By Region 2017-2022
TABLE 76 Global Product Registration Segment Market Share, By Region 2012-2016
TABLE 77 Global Product Registration Segment Market Share, By Region 2017-2022
TABLE 78 Global Product Registration Segment Y-o-Y, By Region 2015-2022
TABLE 79 Global EH&S Management Segment Value (US$ Mn), By Region 2012-2016
TABLE 80 Global EH&S Management Segment Value (US$ Mn), By Region 2017-2022
TABLE 81 Global EH&S Management Segment Market Share, By Region 2012-2016
TABLE 82 Global EH&S Management Segment Market Share, By Region 2017-2022
TABLE 83 Global EH&S Management Segment Y-o-Y, By Region 2015-2022
TABLE 84 Global Supplier Quality Management Segment Value (US$ Mn), By Region 2012-2016
TABLE 85 Global Supplier Quality Management Segment Value (US$ Mn), By Region 2017-2022
TABLE 86 Global Supplier Quality Management Segment Market Share, By Region 2012-2016
TABLE 87 Global Supplier Quality Management Segment Market Share, By Region 2017-2022
TABLE 88 Global Supplier Quality Management Segment Y-o-Y, By Region 2015-2022
TABLE 89 Global Other Solutions Segment Value (US$ Mn), By Region 2012-2016
TABLE 90 Global Other Solutions Segment Value (US$ Mn), By Region 2017-2022
TABLE 91 Global Other Solutions Segment Market Share, By Region 2012-2016
TABLE 92 Global Other Solutions Segment Market Share, By Region 2017-2022
TABLE 93 Global Other Solutions Segment Y-o-Y, By Region 2015-2022
TABLE 94 Global Large Enterprises Segment Value (US$ Mn), By Region 2012-2016
TABLE 95 Global Large Enterprises Segment Value (US$ Mn), By Region 2017-2022
TABLE 96 Global Large Enterprises Segment Market Share, By Region 2012-2016
TABLE 97 Global Large Enterprises Segment Market Share, By Region 2017-2022
TABLE 98 Global Large Enterprises Segment Y-o-Y, By Region 2015-2022
TABLE 99 Global Small & Medium Enterprises Segment Value (US$ Mn), By Region 2012-2016
TABLE 100 Global Small & Medium Enterprises Segment Value (US$ Mn), By Region 2017-2022
TABLE 101 Global Small & Medium Enterprises Segment Market Share, By Region 2012-2016
TABLE 102 Global Small & Medium Enterprises Segment Market Share, By Region 2017-2022
TABLE 103 Global Small & Medium Enterprises Segment Y-o-Y, By Region 2015-2022
TABLE 104 North America Quality Management Software Market Value (US$ Mn), By Deployment Type 2012-2016
TABLE 105 North America Quality Management Software Market Value (US$ Mn), By Deployment Type 2017-2022
TABLE 106 North America Quality Management Software Market Value (US$ Mn), By End-Use Industry 2012-2016
TABLE 107 North America Quality Management Software Market Value (US$ Mn), By End-Use Industry 2017-2022
TABLE 108 North America Quality Management Software Market Value (US$ Mn), By Solution Type 2012-2016
TABLE 109 North America Quality Management Software Market Value (US$ Mn), By Solution Type 2017-2022
TABLE 110 North America Quality Management Software Market Value (US$ Mn), By Organization Type 2012-2016
TABLE 111 North America Quality Management Software Market Value (US$ Mn), By Organization Type 2017-2022
TABLE 112 Latin America Quality Management Software Market Value (US$ Mn), By Deployment Type 2012-2016
TABLE 113 Latin America Quality Management Software Market Value (US$ Mn), By Deployment Type 2017-2022
TABLE 114 Latin America Quality Management Software Market Value (US$ Mn), By End-Use Industry 2012-2016
TABLE 115 Latin America Quality Management Software Market Value (US$ Mn), By End-Use Industry 2017-2022
TABLE 116 Latin America Quality Management Software Market Value (US$ Mn), By Solution Type 2012-2016
TABLE 117 Latin America Quality Management Software Market Value (US$ Mn), By Solution Type 2017-2022
TABLE 118 Latin America Quality Management Software Market Value (US$ Mn), By Organization Type 2012-2016
TABLE 119 Latin America Quality Management Software Market Value (US$ Mn), By Organization Type 2017-2022
TABLE 120 Europe Quality Management Software Market Value (US$ Mn), By Deployment Type 2012-2016
TABLE 121 Europe Quality Management Software Market Value (US$ Mn), By Deployment Type 2017-2022
TABLE 122 Europe Quality Management Software Market Value (US$ Mn), By End-Use Industry 2012-2016
TABLE 123 Europe Quality Management Software Market Value (US$ Mn), By End-Use Industry 2017-2022
TABLE 124 Europe Quality Management Software Market Value (US$ Mn), By Solution Type 2012-2016
TABLE 125 Europe Quality Management Software Market Value (US$ Mn), By Solution Type 2017-2022
TABLE 126 Europe Quality Management Software Market Value (US$ Mn), By Organization Type 2012-2016
TABLE 127 Europe Quality Management Software Market Value (US$ Mn), By Organization Type 2017-2022
TABLE 128 Japan Quality Management Software Market Value (US$ Mn), By Deployment Type 2012-2016
TABLE 129 Japan Quality Management Software Market Value (US$ Mn), By Deployment Type 2017-2022
TABLE 130 Japan Quality Management Software Market Value (US$ Mn), By End-Use Industry 2012-2016
TABLE 131 Japan Quality Management Software Market Value (US$ Mn), By End-Use Industry 2017-2022
TABLE 132 Japan Quality Management Software Market Value (US$ Mn), By Solution Type 2012-2016
TABLE 133 Japan Quality Management Software Market Value (US$ Mn), By Solution Type 2017-2022
TABLE 134 Japan Quality Management Software Market Value (US$ Mn), By Organization Type 2012-2016
TABLE 135 Japan Quality Management Software Market Value (US$ Mn), By Organization Type 2017-2022
TABLE 136 APEJ Quality Management Software Market Value (US$ Mn), By Deployment Type 2012-2016
TABLE 137 APEJ Quality Management Software Market Value (US$ Mn), By Deployment Type 2017-2022
TABLE 138 APEJ Quality Management Software Market Value (US$ Mn), By End-Use Industry 2012-2016
TABLE 139 APEJ Quality Management Software Market Value (US$ Mn), By End-Use Industry 2017-2022
TABLE 140 APEJ Quality Management Software Market Value (US$ Mn), By Solution Type 2012-2016
TABLE 141 APEJ Quality Management Software Market Value (US$ Mn), By Solution Type 2017-2022
TABLE 142 APEJ Quality Management Software Market Value (US$ Mn), By Organization Type 2012-2016
TABLE 143 APEJ Quality Management Software Market Value (US$ Mn), By Organization Type 2017-2022
TABLE 144 MEA Quality Management Software Market Value (US$ Mn), By Deployment Type 2012-2016
TABLE 145 MEA Quality Management Software Market Value (US$ Mn), By Deployment Type 2017-2022
TABLE 146 MEA Quality Management Software Market Value (US$ Mn), By End-Use Industry 2012-2016
TABLE 147 MEA Quality Management Software Market Value (US$ Mn), By End-Use Industry 2017-2022
TABLE 148 MEA Quality Management Software Market Value (US$ Mn), By Solution Type 2012-2016
TABLE 149 MEA Quality Management Software Market Value (US$ Mn), By Solution Type 2017-2022
TABLE 150 MEA Quality Management Software Market Value (US$ Mn), By Organization Type 2012-2016
TABLE 151 MEA Quality Management Software Market Value (US$ Mn), By Organization Type 2017-2022
TABLE 152 US Quality Management Software Market Value (US$ Mn), By Deployment Type 2012-2016
TABLE 153 US Quality Management Software Market Value (US$ Mn), By Deployment Type 2017-2022
TABLE 154 US Quality Management Software Market Value (US$ Mn), By End-Use Industry 2012-2016
TABLE 155 US Quality Management Software Market Value (US$ Mn), By End-Use Industry 2017-2022
TABLE 156 US Quality Management Software Market Value (US$ Mn), By Solution Type 2012-2016
TABLE 157 US Quality Management Software Market Value (US$ Mn), By Solution Type 2017-2022
TABLE 158 US Quality Management Software Market Value (US$ Mn), By Organization Type 2012-2016
TABLE 159 US Quality Management Software Market Value (US$ Mn), By Organization Type 2017-2022
TABLE 160 Canada Quality Management Software Market Value (US$ Mn), By Deployment Type 2012-2016
TABLE 161 Canada Quality Management Software Market Value (US$ Mn), By Deployment Type 2017-2022
TABLE 162 Canada Quality Management Software Market Value (US$ Mn), By End-Use Industry 2012-2016
TABLE 163 Canada Quality Management Software Market Value (US$ Mn), By End-Use Industry 2017-2022
TABLE 164 Canada Quality Management Software Market Value (US$ Mn), By Solution Type 2012-2016
TABLE 165 Canada Quality Management Software Market Value (US$ Mn), By Solution Type 2017-2022
TABLE 166 Canada Quality Management Software Market Value (US$ Mn), By Organization Type 2012-2016
TABLE 167 Canada Quality Management Software Market Value (US$ Mn), By Organization Type 2017-2022
TABLE 168 Brazil Quality Management Software Market Value (US$ Mn), By Deployment Type 2012-2016
TABLE 169 Brazil Quality Management Software Market Value (US$ Mn), By Deployment Type 2017-2022
TABLE 170 Brazil Quality Management Software Market Value (US$ Mn), By End-Use Industry 2012-2016
TABLE 171 Brazil Quality Management Software Market Value (US$ Mn), By End-Use Industry 2017-2022
TABLE 172 Brazil Quality Management Software Market Value (US$ Mn), By Solution Type 2012-2016
TABLE 173 Brazil Quality Management Software Market Value (US$ Mn), By Solution Type 2017-2022
TABLE 174 Brazil Quality Management Software Market Value (US$ Mn), By Organization Type 2012-2016
TABLE 175 Brazil Quality Management Software Market Value (US$ Mn), By Organization Type 2017-2022
TABLE 176 Mexico Quality Management Software Market Value (US$ Mn), By Deployment Type 2012-2016
TABLE 177 Mexico Quality Management Software Market Value (US$ Mn), By Deployment Type 2017-2022
TABLE 178 Mexico Quality Management Software Market Value (US$ Mn), By End-Use Industry 2012-2016
TABLE 179 Mexico Quality Management Software Market Value (US$ Mn), By End-Use Industry 2017-2022
TABLE 180 Mexico Quality Management Software Market Value (US$ Mn), By Solution Type 2012-2016
TABLE 181 Mexico Quality Management Software Market Value (US$ Mn), By Solution Type 2017-2022
TABLE 182 Mexico Quality Management Software Market Value (US$ Mn), By Organization Type 2012-2016
TABLE 183 Mexico Quality Management Software Market Value (US$ Mn), By Organization Type 2017-2022
TABLE 184 Argentina Quality Management Software Market Value (US$ Mn), By Deployment Type 2012-2016
TABLE 185 Argentina Quality Management Software Market Value (US$ Mn), By Deployment Type 2017-2022
TABLE 186 Argentina Quality Management Software Market Value (US$ Mn), By End-Use Industry 2012-2016
TABLE 187 Argentina Quality Management Software Market Value (US$ Mn), By End-Use Industry 2017-2022
TABLE 188 Argentina Quality Management Software Market Value (US$ Mn), By Solution Type 2012-2016
TABLE 189 Argentina Quality Management Software Market Value (US$ Mn), By Solution Type 2017-2022
TABLE 190 Argentina Quality Management Software Market Value (US$ Mn), By Organization Type 2012-2016
TABLE 191 Argentina Quality Management Software Market Value (US$ Mn), By Organization Type 2017-2022
TABLE 192 Rest of Latin America Quality Management Software Market Value (US$ Mn), By Deployment Type 2012-2016
TABLE 193 Rest of Latin America Quality Management Software Market Value (US$ Mn), By Deployment Type 2017-2022
TABLE 194 Rest of Latin America Quality Management Software Market Value (US$ Mn), By End-Use Industry 2012-2016
TABLE 195 Rest of Latin America Quality Management Software Market Value (US$ Mn), By End-Use Industry 2017-2022
TABLE 196 Rest of Latin America Quality Management Software Market Value (US$ Mn), By Solution Type 2012-2016
TABLE 197 Rest of Latin America Quality Management Software Market Value (US$ Mn), By Solution Type 2017-2022
TABLE 198 Rest of Latin America Quality Management Software Market Value (US$ Mn), By Organization Type 2012-2016
TABLE 199 Rest of Latin America Quality Management Software Market Value (US$ Mn), By Organization Type 2017-2022
TABLE 200 Germany Quality Management Software Market Value (US$ Mn), By Deployment Type 2012-2016
TABLE 201 Germany Quality Management Software Market Value (US$ Mn), By Deployment Type 2017-2022
TABLE 202 Germany Quality Management Software Market Value (US$ Mn), By End-Use Industry 2012-2016
TABLE 203 Germany Quality Management Software Market Value (US$ Mn), By End-Use Industry 2017-2022
TABLE 204 Germany Quality Management Software Market Value (US$ Mn), By Solution Type 2012-2016
TABLE 205 Germany Quality Management Software Market Value (US$ Mn), By Solution Type 2017-2022
TABLE 206 Germany Quality Management Software Market Value (US$ Mn), By Organization Type 2012-2016
TABLE 207 Germany Quality Management Software Market Value (US$ Mn), By Organization Type 2017-2022
TABLE 208 UK Quality Management Software Market Value (US$ Mn), By Deployment Type 2012-2016
TABLE 209 UK Quality Management Software Market Value (US$ Mn), By Deployment Type 2017-2022
TABLE 210 UK Quality Management Software Market Value (US$ Mn), By End-Use Industry 2012-2016
TABLE 211 UK Quality Management Software Market Value (US$ Mn), By End-Use Industry 2017-2022
TABLE 212 UK Quality Management Software Market Value (US$ Mn), By Solution Type 2012-2016
TABLE 213 UK Quality Management Software Market Value (US$ Mn), By Solution Type 2017-2022
TABLE 214 UK Quality Management Software Market Value (US$ Mn), By Organization Type 2012-2016
TABLE 215 UK Quality Management Software Market Value (US$ Mn), By Organization Type 2017-2022
TABLE 216 France Quality Management Software Market Value (US$ Mn), By Deployment Type 2012-2016
TABLE 217 France Quality Management Software Market Value (US$ Mn), By Deployment Type 2017-2022
TABLE 218 France Quality Management Software Market Value (US$ Mn), By End-Use Industry 2012-2016
TABLE 219 France Quality Management Software Market Value (US$ Mn), By End-Use Industry 2017-2022
TABLE 220 France Quality Management Software Market Value (US$ Mn), By Solution Type 2012-2016
TABLE 221 France Quality Management Software Market Value (US$ Mn), By Solution Type 2017-2022
TABLE 222 France Quality Management Software Market Value (US$ Mn), By Organization Type 2012-2016
TABLE 223 France Quality Management Software Market Value (US$ Mn), By Organization Type 2017-2022
TABLE 224 Spain Quality Management Software Market Value (US$ Mn), By Deployment Type 2012-2016
TABLE 225 Spain Quality Management Software Market Value (US$ Mn), By Deployment Type 2017-2022
TABLE 226 Spain Quality Management Software Market Value (US$ Mn), By End-Use Industry 2012-2016
TABLE 227 Spain Quality Management Software Market Value (US$ Mn), By End-Use Industry 2017-2022
TABLE 228 Spain Quality Management Software Market Value (US$ Mn), By Solution Type 2012-2016
TABLE 229 Spain Quality Management Software Market Value (US$ Mn), By Solution Type 2017-2022
TABLE 230 Spain Quality Management Software Market Value (US$ Mn), By Organization Type 2012-2016
TABLE 231 Spain Quality Management Software Market Value (US$ Mn), By Organization Type 2017-2022
TABLE 232 Italy Quality Management Software Market Value (US$ Mn), By Deployment Type 2012-2016
TABLE 233 Italy Quality Management Software Market Value (US$ Mn), By Deployment Type 2017-2022
TABLE 234 Italy Quality Management Software Market Value (US$ Mn), By End-Use Industry 2012-2016
TABLE 235 Italy Quality Management Software Market Value (US$ Mn), By End-Use Industry 2017-2022
TABLE 236 Italy Quality Management Software Market Value (US$ Mn), By Solution Type 2012-2016
TABLE 237 Italy Quality Management Software Market Value (US$ Mn), By Solution Type 2017-2022
TABLE 238 Italy Quality Management Software Market Value (US$ Mn), By Organization Type 2012-2016
TABLE 239 Italy Quality Management Software Market Value (US$ Mn), By Organization Type 2017-2022
TABLE 240 Rest of Europe Quality Management Software Market Value (US$ Mn), By Deployment Type 2012-2016
TABLE 241 Rest of Europe Quality Management Software Market Value (US$ Mn), By Deployment Type 2017-2022
TABLE 242 Rest of Europe Quality Management Software Market Value (US$ Mn), By End-Use Industry 2012-2016
TABLE 243 Rest of Europe Quality Management Software Market Value (US$ Mn), By End-Use Industry 2017-2022
TABLE 244 Rest of Europe Quality Management Software Market Value (US$ Mn), By Solution Type 2012-2016
TABLE 245 Rest of Europe Quality Management Software Market Value (US$ Mn), By Solution Type 2017-2022
TABLE 246 Rest of Europe Quality Management Software Market Value (US$ Mn), By Organization Type 2012-2016
TABLE 247 Rest of Europe Quality Management Software Market Value (US$ Mn), By Organization Type 2017-2022
TABLE 248 Japan Quality Management Software Market Value (US$ Mn), By Deployment Type 2012-2016
TABLE 249 Japan Quality Management Software Market Value (US$ Mn), By Deployment Type 2017-2022
TABLE 250 Japan Quality Management Software Market Value (US$ Mn), By End-Use Industry 2012-2016
TABLE 251 Japan Quality Management Software Market Value (US$ Mn), By End-Use Industry 2017-2022
TABLE 252 Japan Quality Management Software Market Value (US$ Mn), By Solution Type 2012-2016
TABLE 253 Japan Quality Management Software Market Value (US$ Mn), By Solution Type 2017-2022
TABLE 254 Japan Quality Management Software Market Value (US$ Mn), By Organization Type 2012-2016
TABLE 255 Japan Quality Management Software Market Value (US$ Mn), By Organization Type 2017-2022
TABLE 256 China Quality Management Software Market Value (US$ Mn), By Deployment Type 2012-2016
TABLE 257 China Quality Management Software Market Value (US$ Mn), By Deployment Type 2017-2022
TABLE 258 China Quality Management Software Market Value (US$ Mn), By End-Use Industry 2012-2016
TABLE 259 China Quality Management Software Market Value (US$ Mn), By End-Use Industry 2017-2022
TABLE 260 China Quality Management Software Market Value (US$ Mn), By Solution Type 2012-2016
TABLE 261 China Quality Management Software Market Value (US$ Mn), By Solution Type 2017-2022
TABLE 262 China Quality Management Software Market Value (US$ Mn), By Organization Type 2012-2016
TABLE 263 China Quality Management Software Market Value (US$ Mn), By Organization Type 2017-2022
TABLE 264 India Quality Management Software Market Value (US$ Mn), By Deployment Type 2012-2016
TABLE 265 India Quality Management Software Market Value (US$ Mn), By Deployment Type 2017-2022
TABLE 266 India Quality Management Software Market Value (US$ Mn), By End-Use Industry 2012-2016
TABLE 267 India Quality Management Software Market Value (US$ Mn), By End-Use Industry 2017-2022
TABLE 268 India Quality Management Software Market Value (US$ Mn), By Solution Type 2012-2016
TABLE 269 India Quality Management Software Market Value (US$ Mn), By Solution Type 2017-2022
TABLE 270 India Quality Management Software Market Value (US$ Mn), By Organization Type 2012-2016
TABLE 271 India Quality Management Software Market Value (US$ Mn), By Organization Type 2017-2022
TABLE 272 Malaysia Quality Management Software Market Value (US$ Mn), By Deployment Type 2012-2016
TABLE 273 Malaysia Quality Management Software Market Value (US$ Mn), By Deployment Type 2017-2022
TABLE 274 Malaysia Quality Management Software Market Value (US$ Mn), By End-Use Industry 2012-2016
TABLE 275 Malaysia Quality Management Software Market Value (US$ Mn), By End-Use Industry 2017-2022
TABLE 276 Malaysia Quality Management Software Market Value (US$ Mn), By Solution Type 2012-2016
TABLE 277 Malaysia Quality Management Software Market Value (US$ Mn), By Solution Type 2017-2022
TABLE 278 Malaysia Quality Management Software Market Value (US$ Mn), By Organization Type 2012-2016
TABLE 279 Malaysia Quality Management Software Market Value (US$ Mn), By Organization Type 2017-2022
TABLE 280 Singapore Quality Management Software Market Value (US$ Mn), By Deployment Type 2012-2016
TABLE 281 Singapore Quality Management Software Market Value (US$ Mn), By Deployment Type 2017-2022
TABLE 282 Singapore Quality Management Software Market Value (US$ Mn), By End-Use Industry 2012-2016
TABLE 283 Singapore Quality Management Software Market Value (US$ Mn), By End-Use Industry 2017-2022
TABLE 284 Singapore Quality Management Software Market Value (US$ Mn), By Solution Type 2012-2016
TABLE 285 Singapore Quality Management Software Market Value (US$ Mn), By Solution Type 2017-2022
TABLE 286 Singapore Quality Management Software Market Value (US$ Mn), By Organization Type 2012-2016
TABLE 287 Singapore Quality Management Software Market Value (US$ Mn), By Organization Type 2017-2022
TABLE 288 Australia Quality Management Software Market Value (US$ Mn), By Deployment Type 2012-2016
TABLE 289 Australia Quality Management Software Market Value (US$ Mn), By Deployment Type 2017-2022
TABLE 290 Australia Quality Management Software Market Value (US$ Mn), By End-Use Industry 2012-2016
TABLE 291 Australia Quality Management Software Market Value (US$ Mn), By End-Use Industry 2017-2022
TABLE 292 Australia Quality Management Software Market Value (US$ Mn), By Solution Type 2012-2016
TABLE 293 Australia Quality Management Software Market Value (US$ Mn), By Solution Type 2017-2022
TABLE 294 Australia Quality Management Software Market Value (US$ Mn), By Organization Type 2012-2016
TABLE 295 Australia Quality Management Software Market Value (US$ Mn), By Organization Type 2017-2022
TABLE 296 Rest of APEJ Quality Management Software Market Value (US$ Mn), By Deployment Type 2012-2016
TABLE 297 Rest of APEJ Quality Management Software Market Value (US$ Mn), By Deployment Type 2017-2022
TABLE 298 Rest of APEJ Quality Management Software Market Value (US$ Mn), By End-Use Industry 2012-2016
TABLE 299 Rest of APEJ Quality Management Software Market Value (US$ Mn), By End-Use Industry 2017-2022
TABLE 300 Rest of APEJ Quality Management Software Market Value (US$ Mn), By Solution Type 2012-2016
TABLE 301 Rest of APEJ Quality Management Software Market Value (US$ Mn), By Solution Type 2017-2022
TABLE 302 Rest of APEJ Quality Management Software Market Value (US$ Mn), By Organization Type 2012-2016
TABLE 303 Rest of APEJ Quality Management Software Market Value (US$ Mn), By Organization Type 2017-2022
TABLE 304 GCC Countries Quality Management Software Market Value (US$ Mn), By Deployment Type 2012-2016
TABLE 305 GCC Countries Quality Management Software Market Value (US$ Mn), By Deployment Type 2017-2022
TABLE 306 GCC Countries Quality Management Software Market Value (US$ Mn), By End-Use Industry 2012-2016
TABLE 307 GCC Countries Quality Management Software Market Value (US$ Mn), By End-Use Industry 2017-2022
TABLE 308 GCC Countries Quality Management Software Market Value (US$ Mn), By Solution Type 2012-2016
TABLE 309 GCC Countries Quality Management Software Market Value (US$ Mn), By Solution Type 2017-2022
TABLE 310 GCC Countries Quality Management Software Market Value (US$ Mn), By Organization Type 2012-2016
TABLE 311 GCC Countries Quality Management Software Market Value (US$ Mn), By Organization Type 2017-2022
TABLE 312 South Africa Quality Management Software Market Value (US$ Mn), By Deployment Type 2012-2016
TABLE 313 South Africa Quality Management Software Market Value (US$ Mn), By Deployment Type 2017-2022
TABLE 314 South Africa Quality Management Software Market Value (US$ Mn), By End-Use Industry 2012-2016
TABLE 315 South Africa Quality Management Software Market Value (US$ Mn), By End-Use Industry 2017-2022
TABLE 316 South Africa Quality Management Software Market Value (US$ Mn), By Solution Type 2012-2016
TABLE 317 South Africa Quality Management Software Market Value (US$ Mn), By Solution Type 2017-2022
TABLE 318 South Africa Quality Management Software Market Value (US$ Mn), By Organization Type 2012-2016
TABLE 319 South Africa Quality Management Software Market Value (US$ Mn), By Organization Type 2017-2022
TABLE 320 Israel Quality Management Software Market Value (US$ Mn), By Deployment Type 2012-2016
TABLE 321 Israel Quality Management Software Market Value (US$ Mn), By Deployment Type 2017-2022
TABLE 322 Israel Quality Management Software Market Value (US$ Mn), By End-Use Industry 2012-2016
TABLE 323 Israel Quality Management Software Market Value (US$ Mn), By End-Use Industry 2017-2022
TABLE 324 Israel Quality Management Software Market Value (US$ Mn), By Solution Type 2012-2016
TABLE 325 Israel Quality Management Software Market Value (US$ Mn), By Solution Type 2017-2022
TABLE 326 Israel Quality Management Software Market Value (US$ Mn), By Organization Type 2012-2016
TABLE 327 Israel Quality Management Software Market Value (US$ Mn), By Organization Type 2017-2022
TABLE 328 Rest of MEA Quality Management Software Market Value (US$ Mn), By Deployment Type 2012-2016
TABLE 329 Rest of MEA Quality Management Software Market Value (US$ Mn), By Deployment Type 2017-2022
TABLE 330 Rest of MEA Quality Management Software Market Value (US$ Mn), By End-Use Industry 2012-2016
TABLE 331 Rest of MEA Quality Management Software Market Value (US$ Mn), By End-Use Industry 2017-2022
TABLE 332 Rest of MEA Quality Management Software Market Value (US$ Mn), By Solution Type 2012-2016
TABLE 333 Rest of MEA Quality Management Software Market Value (US$ Mn), By Solution Type 2017-2022
TABLE 334 Rest of MEA Quality Management Software Market Value (US$ Mn), By Organization Type 2012-2016
TABLE 335 Rest of MEA Quality Management Software Market Value (US$ Mn), By Organization Type 2017-2022
List of Figures
FIG. 1 Global Quality Management Software Market Value (US$ Mn), 2012-2016
FIG. 2 Global Quality Management Software Market Value (US$ Mn) Forecast, 2017-2022
FIG. 3 Global Quality Management Software Market Value (US$ Mn) and Y-o-Y, 2015-2022
FIG. 4 Global On premise Segment Market Value (US$ Mn) By Region, 2012-2016
FIG. 5 Global On premise Segment Market Value (US$ Mn) By Region, 2017-2022
FIG. 6 Global On premise Segment Y-o-Y Growth Rate, By Region, 2015-2022
FIG. 7 Global Cloud-Based Segment Market Value (US$ Mn) By Region, 2012-2016
FIG. 8 Global Cloud-Based Segment Market Value (US$ Mn) By Region, 2017-2022
FIG. 9 Global Cloud-Based Segment Y-o-Y Growth Rate, By Region, 2015-2022
FIG. 10 Global Aerospace and Defense Segment Market Value (US$ Mn) By Region, 2012-2016
FIG. 11 Global Aerospace and Defense Segment Market Value (US$ Mn) By Region, 2017-2022
FIG. 12 Global Aerospace and Defense Segment Y-o-Y Growth Rate, By Region, 2015-2022
FIG. 13 Global Automotive Segment Market Value (US$ Mn) By Region, 2012-2016
FIG. 14 Global Automotive Segment Market Value (US$ Mn) By Region, 2017-2022
FIG. 15 Global Automotive Segment Y-o-Y Growth Rate, By Region, 2015-2022
FIG. 16 Global Consumer Goods and Retail Segment Market Value (US$ Mn) By Region, 2012-2016
FIG. 17 Global Consumer Goods and Retail Segment Market Value (US$ Mn) By Region, 2017-2022
FIG. 18 Global Consumer Goods and Retail Segment Y-o-Y Growth Rate, By Region, 2015-2022
FIG. 19 Global Healthcare and Life Sciences Segment Market Value (US$ Mn) By Region, 2012-2016
FIG. 20 Global Healthcare and Life Sciences Segment Market Value (US$ Mn) By Region, 2017-2022
FIG. 21 Global Healthcare and Life Sciences Segment Y-o-Y Growth Rate, By Region, 2015-2022
FIG. 22 Global ITES and Telecom Segment Market Value (US$ Mn) By Region, 2012-2016
FIG. 23 Global ITES and Telecom Segment Market Value (US$ Mn) By Region, 2017-2022
FIG. 24 Global ITES and Telecom Segment Y-o-Y Growth Rate, By Region, 2015-2022
FIG. 25 Global Other industries Segment Market Value (US$ Mn) By Region, 2012-2016
FIG. 26 Global Other industries Segment Market Value (US$ Mn) By Region, 2017-2022
FIG. 27 Global Other industries Segment Y-o-Y Growth Rate, By Region, 2015-2022
FIG. 28 Global Audit Management Segment Market Value (US$ Mn) By Region, 2012-2016
FIG. 29 Global Audit Management Segment Market Value (US$ Mn) By Region, 2017-2022
FIG. 30 Global Audit Management Segment Y-o-Y Growth Rate, By Region, 2015-2022
FIG. 31 Global Complaint Management Segment Market Value (US$ Mn) By Region, 2012-2016
FIG. 32 Global Complaint Management Segment Market Value (US$ Mn) By Region, 2017-2022
FIG. 33 Global Complaint Management Segment Y-o-Y Growth Rate, By Region, 2015-2022
FIG. 34 Global Training Management Segment Market Value (US$ Mn) By Region, 2012-2016
FIG. 35 Global Training Management Segment Market Value (US$ Mn) By Region, 2017-2022
FIG. 36 Global Training Management Segment Y-o-Y Growth Rate, By Region, 2015-2022
FIG. 37 Global CAPA Management Segment Market Value (US$ Mn) By Region, 2012-2016
FIG. 38 Global CAPA Management Segment Market Value (US$ Mn) By Region, 2017-2022
FIG. 39 Global CAPA Management Segment Y-o-Y Growth Rate, By Region, 2015-2022
FIG. 40 Global Document Management Segment Market Value (US$ Mn) By Region, 2012-2016
FIG. 41 Global Document Management Segment Market Value (US$ Mn) By Region, 2017-2022
FIG. 42 Global Document Management Segment Y-o-Y Growth Rate, By Region, 2015-2022
FIG. 43 Global Change Control Segment Market Value (US$ Mn) By Region, 2012-2016
FIG. 44 Global Change Control Segment Market Value (US$ Mn) By Region, 2017-2022
FIG. 45 Global Change Control Segment Y-o-Y Growth Rate, By Region, 2015-2022
FIG. 46 Global Product Registration Segment Market Value (US$ Mn) By Region, 2012-2016
FIG. 47 Global Product Registration Segment Market Value (US$ Mn) By Region, 2017-2022
FIG. 48 Global Product Registration Segment Y-o-Y Growth Rate, By Region, 2015-2022
FIG. 49 Global EH&S Management Segment Market Value (US$ Mn) By Region, 2012-2016
FIG. 50 Global EH&S Management Segment Market Value (US$ Mn) By Region, 2017-2022
FIG. 51 Global EH&S Management Segment Y-o-Y Growth Rate, By Region, 2015-2022
FIG. 52 Global Supplier Quality Management Segment Market Value (US$ Mn) By Region, 2012-2016
FIG. 53 Global Supplier Quality Management Segment Market Value (US$ Mn) By Region, 2017-2022
FIG. 54 Global Supplier Quality Management Segment Y-o-Y Growth Rate, By Region, 2015-2022
FIG. 55 Global Other Solutions Segment Market Value (US$ Mn) By Region, 2012-2016
FIG. 56 Global Other Solutions Segment Market Value (US$ Mn) By Region, 2017-2022
FIG. 57 Global Other Solutions Segment Y-o-Y Growth Rate, By Region, 2015-2022
FIG. 58 Global Large Enterprises Segment Market Value (US$ Mn) By Region, 2012-2016
FIG. 59 Global Large Enterprises Segment Market Value (US$ Mn) By Region, 2017-2022
FIG. 60 Global Large Enterprises Segment Y-o-Y Growth Rate, By Region, 2015-2022
FIG. 61 Global Small & Medium Enterprises Segment Market Value (US$ Mn) By Region, 2012-2016
FIG. 62 Global Small & Medium Enterprises Segment Market Value (US$ Mn) By Region, 2017-2022
FIG. 63 Global Small & Medium Enterprises Segment Y-o-Y Growth Rate, By Region, 2015-2022
FIG. 64 North America Quality Management Software Market Value (US$ Mn), By Deployment Type 2012-2016
FIG. 65 North America Quality Management Software Market Value (US$ Mn), By Deployment Type 2017-2022
FIG. 66 North America Quality Management Software Market Value (US$ Mn), By End-Use Industry 2012-2016
FIG. 67 North America Quality Management Software Market Value (US$ Mn), By End-Use Industry 2017-2022
FIG. 68 North America Quality Management Software Market Value (US$ Mn), By Solution Type 2012-2016
FIG. 69 North America Quality Management Software Market Value (US$ Mn), By Solution Type 2017-2022
FIG. 70 North America Quality Management Software Market Value (US$ Mn), By Organization Type 2012-2016
FIG. 71 North America Quality Management Software Market Value (US$ Mn), By Organization Type 2017-2022
FIG. 72 Latin America Quality Management Software Market Value (US$ Mn), By Deployment Type 2012-2016
FIG. 73 Latin America Quality Management Software Market Value (US$ Mn), By Deployment Type 2017-2022
FIG. 74 Latin America Quality Management Software Market Value (US$ Mn), By End-Use Industry 2012-2016
FIG. 75 Latin America Quality Management Software Market Value (US$ Mn), By End-Use Industry 2017-2022
FIG. 76 Latin America Quality Management Software Market Value (US$ Mn), By Solution Type 2012-2016
FIG. 77 Latin America Quality Management Software Market Value (US$ Mn), By Solution Type 2017-2022
FIG. 78 Latin America Quality Management Software Market Value (US$ Mn), By Organization Type 2012-2016
FIG. 79 Latin America Quality Management Software Market Value (US$ Mn), By Organization Type 2017-2022
FIG. 80 Europe Quality Management Software Market Value (US$ Mn), By Deployment Type 2012-2016
FIG. 81 Europe Quality Management Software Market Value (US$ Mn), By Deployment Type 2017-2022
FIG. 82 Europe Quality Management Software Market Value (US$ Mn), By End-Use Industry 2012-2016
FIG. 83 Europe Quality Management Software Market Value (US$ Mn), By End-Use Industry 2017-2022
FIG. 84 Europe Quality Management Software Market Value (US$ Mn), By Solution Type 2012-2016
FIG. 85 Europe Quality Management Software Market Value (US$ Mn), By Solution Type 2017-2022
FIG. 86 Europe Quality Management Software Market Value (US$ Mn), By Organization Type 2012-2016
FIG. 87 Europe Quality Management Software Market Value (US$ Mn), By Organization Type 2017-2022
FIG. 88 Japan Quality Management Software Market Value (US$ Mn), By Deployment Type 2012-2016
FIG. 89 Japan Quality Management Software Market Value (US$ Mn), By Deployment Type 2017-2022
FIG. 90 Japan Quality Management Software Market Value (US$ Mn), By End-Use Industry 2012-2016
FIG. 91 Japan Quality Management Software Market Value (US$ Mn), By End-Use Industry 2017-2022
FIG. 92 Japan Quality Management Software Market Value (US$ Mn), By Solution Type 2012-2016
FIG. 93 Japan Quality Management Software Market Value (US$ Mn), By Solution Type 2017-2022
FIG. 94 Japan Quality Management Software Market Value (US$ Mn), By Organization Type 2012-2016
FIG. 95 Japan Quality Management Software Market Value (US$ Mn), By Organization Type 2017-2022
FIG. 96 APEJ Quality Management Software Market Value (US$ Mn), By Deployment Type 2012-2016
FIG. 97 APEJ Quality Management Software Market Value (US$ Mn), By Deployment Type 2017-2022
FIG. 98 APEJ Quality Management Software Market Value (US$ Mn), By End-Use Industry 2012-2016
FIG. 99 APEJ Quality Management Software Market Value (US$ Mn), By End-Use Industry 2017-2022
FIG. 100 APEJ Quality Management Software Market Value (US$ Mn), By Solution Type 2012-2016
FIG. 101 APEJ Quality Management Software Market Value (US$ Mn), By Solution Type 2017-2022
FIG. 102 APEJ Quality Management Software Market Value (US$ Mn), By Organization Type 2012-2016
FIG. 103 APEJ Quality Management Software Market Value (US$ Mn), By Organization Type 2017-2022
FIG. 104 MEA Quality Management Software Market Value (US$ Mn), By Deployment Type 2012-2016
FIG. 105 MEA Quality Management Software Market Value (US$ Mn), By Deployment Type 2017-2022
FIG. 106 MEA Quality Management Software Market Value (US$ Mn), By End-Use Industry 2012-2016
FIG. 107 MEA Quality Management Software Market Value (US$ Mn), By End-Use Industry 2017-2022
FIG. 108 MEA Quality Management Software Market Value (US$ Mn), By Solution Type 2012-2016
FIG. 109 MEA Quality Management Software Market Value (US$ Mn), By Solution Type 2017-2022
FIG. 110 MEA Quality Management Software Market Value (US$ Mn), By Organization Type 2012-2016
FIG. 111 MEA Quality Management Software Market Value (US$ Mn), By Organization Type 2017-2022
Copyright © Transparency Market Research, Inc. All Rights reserved
Trust Online

Quality Management Software Market