
Reports
Reports
Proximity and Displacement Sensor Market: Overview
Growing trend of process automation in manufacturing companies and boom in the electronic gadget market are major factors driving growth of proximity and displacement sensor market. Proximity and displacement sensors are widely integrated with tablets, smartphones, and play stations.
Further, declining price of the sensors is likely to push the proximity and displacement adoption rate exponentially.
In addition, rising popularity of contact less sensing application along with growing implementation in automobile for automotive security is expected to ramp up the proximity and displacement sensor market.
Meanwhile, growing awareness regarding energy consumption and cost-effective commercially available technologies are influencing the market.
On the other hand, high investment for deployment of integration systems in automobile industry initially is a restraining factor. Also, dearth of skilled professionals for implementation of the technology may limit growth of the global proximity and displacement sensor market.
The upcoming proximity and displacement sensor market analysis report provides insight about the upcoming trends and restraining factors likely to shape growth of the market during forecast period (2019-2029). The report also provides a comprehensive analysis of the key companies of the market and offers details about the capacities and competencies of these companies. The market report also focusses on the market’s competitive landscape and provides detail of the product portfolio of various companies.
Proximity and Displacement Sensor Market: Notable Developments
Rising demand for proximity and displacement sensors in the process automation systems and development of factory has resulted in rivalry in the global market. This is leading to competitive environment in the market.
Further, consistent development in tablet and smartphone market along with process automation in factories are emerging as major driving factor for the proximity & displacement sensors market.
Some of the key players operating in the proximity and displacement sensor market are-
Proximity and Displacement Sensor Market: Key Trends
Recent discovery in commodity manufacturing industries including automotive industry is likely to fuel expansion rate of proximity and displacement sensors market. Further, growing investment inflow towards factory automation in order to reach zero defect production aim would push the demand rate in the market.
In addition, ongoing technological developments by key industry players for differentiation of product to regulate the price pressure challenges may propel demand rate in the proximity and displacement sensor market.
Inductive sensors are widely implemented for discrete automation purpose. Automotive Vending Machines, gaming machines, and Automated Teller Machines (ATM) among other self-services equipment are some of the key application areas, which are supplementing the growing demand for inductive sensors.
Apart from aforementioned application, photoelectric sensors are gaining wide customer traction with expanding application area in food and beverage, and automotive industry. Automotive industry is sprawling rapidly in developing countries. This, in turn, may propel the regional proximity and displacement sensors market.
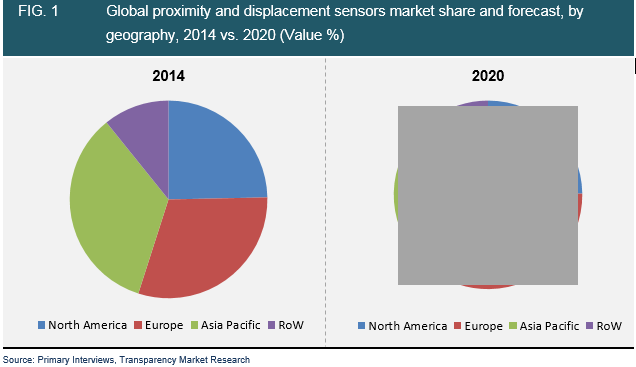
Proximity and Displacement Sensor Market: Regional Analysis
In recent years, North America market has been witnessing technical advancements in manufacturing and industrial sectors. Growing adoption rate of automation technology has provided various opportunities for expansion of sensors market.
Lately, In North American, various manufacturing companies have been implementing automation for operation. This has resulted in rivalry from manufacturing companies who has adopted labor for operations due to availability of low cost labor.
As a result, various companies are shifting their manufacturing bases to cheap labor regions such as Indonesia, China, and Malaysia. In these regions, labor cost is comparatively cheaper than North America.
The shifting is likely to impact the automation utility sensor manufacturing industry negatively in North America.
Chapter 1 Preface
1.1 Research description
1.2 Research scope
1.3 Research methodology
Chapter 2 Executive Summary
Chapter 3 Market overview
3.1 Introduction
3.2 Value chain analysis
3.3 Market drivers
3.3.1 Increase in automotive and manufacturing applications areas
3.3.2 Increasing demand for efficient production methods
3.3.3 Increase in awareness of wearable technology
3.4 Market restraints
3.4.1 Limitations in sensing capabilities
3.5 Market opportunities
3.5.1 Emerging need in Automotive Industry
3.5.2 Application in the nanotechnology
3.6 Porter’s five force analysis
3.6.1 Bargaining power of suppliers – Low
3.6.2 Bargaining power of buyers - Medium
3.6.3 Degree of competition - High
3.6.4 Threat from new entrants - Medium
3.6.5 Threat from substitute products - Low
3.7 Market attractiveness, by industry, 2020
3.8 Market share of key players
Chapter 4 Global Proximity and Displacement Sensors Market Analysis, by Types
4.1 Overview
4.2 Inductive Sensors
4.2.1 Inductive sensors market size and forecast, 2013 – 2020 (USD million)
4.3 Photoelectric Sensors
4.3.1 Photoelectric sensors market size and forecast, 2014 – 2020 (USD million)
4.4 Capacitive sensors
4.4.1 Capacitive sensors market size and forecast, 2014 – 2020 (USD million)
4.5 Magnetic sensors
4.5.1 Magnetic sensors market size and forecast, 2014 – 2020 (USD million)
4.6 Ultrasonic sensors
4.6.1 Ultrasonic sensors market size and forecast, 2014 – 2020 (USD million)
4.7 LVDT sensors
4.7.1 LVDT sensors market size and forecast, 2014 – 2020 (USD million)
4.8 Other sensors
4.8.1 Other sensors market size and forecast, 2014 – 2020 (USD million)
Chapter 5 Proximity and Displacement Sensors Market Analysis, by Industry
5.1 Overview
5.2 Automotive
5.2.1 Market size and forecast, 2013 – 2020 (USD million)
5.3 Food and Beverage
5.3.1 Market size and forecast, 2013 – 2020 (USD million)
5.4 Process industries
5.4.1 Market size and forecast, 2013 – 2020 (USD million)
5.5 Pharmaceutical
5.5.1 Market size and forecast, 2013 – 2020 (USD million)
5.6 Industrial Manufacturing
5.6.1 Market size and forecast, 2013 – 2020 (USD billion)
5.7 Others
5.7.1 Market size and forecast, 2013 – 2020 (USD billion)
Chapter 6 Global Proximity and displacement Sensors Market Analysis and Forecast, by Geography
6.1 Overview
6.2 North America proximity and displacement sensors market
6.2.1 North America proximity and displacement sensors market size and forecast, 2013 – 2020 (USD million)
6.3 Europe proximity and displacement sensors market
6.3.1 Proximity and displacement sensors market size and forecast in Europe, 2013 – 2020 (USD million)
6.4 Asia Pacific proximity and displacement sensors market
6.4.1 Proximity and displacement sensors market size and forecast in Asia Pacific, 2013 – 2020 (USD million)
6.5 RoW proximity and displacement sensors market
6.5.1 RoW Proximity and displacement Sensors Market Size and Forecast, 2013 – 2020 (USD million)
Chapter 7 Company Profiles
7.1 Balluff GmbH
7.1.1 Company overview
7.1.2 Financial overview
7.1.3 Business strategy
7.1.4 Recent developments
7.2 Continental AG
7.2.1 Company overview
7.2.2 Financial overview
7.2.3 Business strategy
7.2.4 Recent developments
7.3 Eaton Corporation plc
7.3.1 Company overview
7.3.2 Financial overview
7.3.3 Business strategy
7.3.4 Recent developments
7.4 IFM Electronic GMBH
7.4.1 Company overview
7.4.2 Financial overview
7.4.3 Business strategy
7.4.4 Recent developments
7.5 Maxim Integrated Products, Inc.
7.5.1 Company overview
7.5.2 Financial overview
7.5.3 Business strategy
7.5.4 Recent developments
7.6 Micro-Epsilon Messtechnik GmbH & Co. KG
7.6.1 Company overview
7.6.2 Financial overview
7.6.3 Business strategy
7.6.4 Recent developments
7.7 OMRON Corporation
7.7.1 Company overview
7.7.2 Financial overview
7.7.3 Business strategy
7.7.4 Recent developments
7.8 Panasonic Corporation
7.8.1 Company overview
7.8.2 Financial overview
7.8.3 Business strategy
7.8.4 Recent developments
7.9 Schneider Electric S.E.
7.9.1 Company overview
7.9.2 Financial overview
7.9.3 Business strategy
7.9.4 Recent developments
7.10 Sharp Corporation
7.10.1 Company overview
7.10.2 Financial overview
7.10.3 Business strategy
7.10.4 Recent developments
List of Tables
TABLE 1 Global Proximity and Displacement Sensors market snapshot
TABLE 2 Proximity and Displacement sensors market size and forecast, by Industry, 2013 – 2020 (USD million)
TABLE 3 Drivers for the global proximity and displacement sensors market: Impact analysis
TABLE 4 Restraints for the proximity and displacement sensors market: Impact analysis
North America proximity and displacement sensors market size and forecast by Types, 2013 – 2020 (USD million)
TABLE 5 North America proximity and displacement sensors market and forecast by Industry, 2013 – 2020 (USD million)
TABLE 6 Europe proximity and displacement sensors market size and forecast by Types, 2013 – 2020 (USD million)
TABLE 7 Europe proximity and displacement sensors market and forecast by Industry, 2013 – 2020 (USD million)
TABLE 8 Asia Pacific proximity and displacement sensors market size and forecast by Types in Asia Pacific, 2013 – 2020 (USD million)
TABLE 9 Asia Pacific proximity and displacement sensors market and forecast by Industry, 2013 – 2020 (USD million)
TABLE 10 RoW proximity and displacement sensors market size and forecast by Types, 2013 – 2020 (USD million)
TABLE 11 RoW proximity and displacement sensors market and forecast by Industry, 2013 – 2020 (USD million)
List of Figures
FIG. 1 Market segmentation: Global Proximity and Displacement Sensors Market
FIG. 2 Global proximity and displacement sensors market value chain analysis
FIG. 3 Porter’s five force analysis
FIG. 4 Global proximity and displacement sensors market attractiveness, by application
FIG. 5 Global proximity and displacement sensors market share and forecast, 2013 vs. 2020 (Value %)
FIG. 6 Inductive sensors market size and forecast, 2013 – 2020 (USD million)
FIG. 7 Photoelectric sensors market size and forecast, 2013 – 2020 (USD million)
FIG. 8 Capacitive sensors market size and forecast, 2013 – 2020 (USD million)
FIG. 9 Magnetic sensors market size and forecast, 2013 – 2020 (USD million)
FIG. 10 Ultrasonic sensors market size and forecast, 2013 – 2020 (USD million)
FIG. 11 LVDT sensors market size and forecast, 2013 – 2020 (USD million)
FIG. 12 Other sensors market size and forecast, 2013 – 2020 (USD million)
FIG. 13 Global proximity and displacement sensors market share and forecast by Industries, 2013 vs. 2020 (Value %)
FIG. 14 Proximity and displacement sensors in automotive market size and forecast, 2013 – 2020 (USD million)
FIG. 15 Proximity and displacement sensors in food and beverage industry market size and forecast, 2013 – 2020 (USD million)
FIG. 16 Proximity and displacement sensors in process industries market size and forecast, 2013 – 2020 (USD billion)
FIG. 17 Proximity and displacement sensors in pharmaceutical market size and forecast, 2013 – 2020 (USD million)
FIG. 18 Proximity and displacement sensors in industrial manufacturing market size and forecast, 2013 – 2020 (USD billion)
FIG. 19 Proximity and displacement sensors in other market size and forecast, 2013 – 2020 (USD billion)
FIG. 20 Global proximity and displacement sensors market trend by geography, 2013 - 2020 (USD million)
FIG. 21 North America proximity and displacement sensors market size and forecast, 2013 – 2020 (USD million)
FIG. 22 Proximity and displacement sensors market size and forecast in Europe, 2013 – 2020 (USD million)
FIG. 23 Proximity and displacement sensors market size and forecast in Asia Pacific, 2013 – 2020 (USD million)
FIG. 24 RoW Proximity and displacement Sensors Market Size and Forecast, 2013 – 2020 (USD million)
FIG. 25 Continental AG annual revenue, 2011 – 2013 (USD billion)
FIG. 26 Eaton Corporation annual revenue, 2011 – 2013 (USD billion)
FIG. 27 Maxim Integrated Products, Inc. annual revenue, 2011 – 2013 (USD billion)
FIG. 28 OMRON Corporation annual revenue, 2011 – 2013 (USD billion)
FIG. 29 Panasonic Corporation annual revenue, 2011 – 2013 (USD billion)
FIG. 30 Schneider Electric annual revenue, 2011 – 2013 (USD billion)
FIG. 31 Sharp Corporation annual revenue, 2011 – 2013 (USD billion)
Copyright © Transparency Market Research, Inc. All Rights reserved
Trust Online

Proximity and Displacement Sensor Market