
Reports
Reports
A POS (point of sale) restaurant management system aids food & beverage operators in processing orders and maintaining financial control over their business, with the help of cash management and integrating with payment service providers. Some POS restaurant management systems are equipped with additional features for monitoring the ingredients inventory.
From computer systems to management systems, an exponential growth has been witnessed in the restaurant software industry over the past few years. POS system is the first foray that restaurants have taken in the restaurant software space, enabling them in exchanging cash & credit, and consolidating sales data in a single storage. A number of next-generation POS restaurant management systems are providing tablets with restaurant ordering applications, real-time business analytics, and modules for integrated gift & loyalty cards.
Demand for POS terminals has witnessed a significant rise in light of its multi-functionality benefits to restaurant owners, which in turn has driven the demand for POS restaurant management systems. The flexibility of POS systems, equipped with features including stock & inventory management, customer relationship management, and billing, help restaurant operators in making effective decisions and profitably carrying out their business operations.
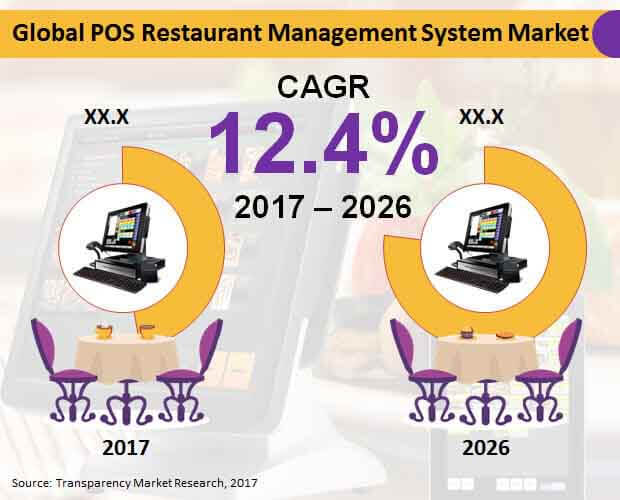
Transparency Market Research (TMR), in its recent report, has projected the global POS restaurant management systems market to exhibit a double-digit CAGR over the forecast period (2017-2026). Global revenues from POS restaurant management systems are poised to reach approximately US$ 30,000 Mn by 2026-end.
Continuously expanding food service sector in countries of Asia-Pacific excluding Japan (APEJ), such as China and India, on the back of favorable demographic condition, is likely to proliferate demand for POS terminals in the region. In terms of revenues, the market for POS restaurant management systems will remain the most lucrative in Asia-Pacific excluding Japan (APEJ), closely followed by Europe. North America is also expected to be an attractive market for POS restaurant management systems, albeit projected to reflect a relatively lower CAGR through 2026.
On the basis of type, mobile POS terminals will continue to dominate the POS restaurant management systems market in terms of revenues as well as CAGR through 2026. Rapid rise in popularity of wireless technology, coupled with constant reduction in prices of mobile devices has accelerated the adoption of mobile POS terminals by restaurant owners. In addition, Fixed POS terminals will also witness an impressive expansion in the market through 2026.
Based on end-users, although full-service restaurants will continue to account for a slightly larger revenue share of the market, sales of POS restaurant management systems in quick-service restaurants are projected to witness a significantly higher CAGR than in full-service restaurants through 2026.
The largest revenue share of the POS restaurant management systems market will be accounted by billing application in 2017. However, the market revenue share of delivery management will surpass that of billing by 2026-end. Revenues from sales of POS restaurant management systems for application in billing and delivery management will collectively exceed US$ 13,000 Mn by 2026-end.
In terms of revenues, although hardware is expected to be the most attractive component of POS restaurant management systems in 2017, by 2026-end software platform will become the largest component segment in the market. Sales of software platform will witness the fastest expansion in the market through 2026, on the basis of component.
Key players profiled by TMR’s report on the global POS restaurant management systems market include Ingenico Group, Verifone System, Lavu, POSist Technologies Pvt. Ltd., Ravel Systems POS, EPOS now, TouchBistro, AccuPOS, PAX Technology, and Clover. These market players are adhering to strategies such as partnership, acquisition, and research & development, with an aim to broaden their product portfolio. In April 2016, for example, Revel and Verifone entered into a partnership for simplifying & enhancing their payment management.
The POS restaurant management systems market is likely to observe considerable growth in the years to come. Technological disruptions in the restaurant sector and surging need for restaurant-specific software, such as menu management, table management, inventory management, and payment and billing processing. These are the important trends stimulating development of the global POS restaurant management systems market in the forthcoming years.
In addition, increased awareness about the significance of data analytics solutions in offering valuable insights to better everyday operations is likely to support development of the global POS restaurant management systems market in the near future. Augmented adoption of cloud systems is likely to observe a steep rise over the analysis timeline. Rising adoption of this software by owners of restaurants for many applications, such as marketing, tracking sales, order management reporting, customer interaction, payment processing, billing, and food ordering. All of these software solutions assist owners and managers of restaurants to deliver better customer experience, streamlining of business operations, increase of profits, and analysis of costs. Such widespread application of this system is anticipated to foster growth of the global POS restaurant management systems market in the years to come.
The design of restaurant management software system is done in such a way that its features and abilities are able to effectively manage bar and restaurants. The point of sale software is considered one of the major benefits for the management of a restaurant. As such, the point of sale software is an iPad, computer, or even a cash register wherein cashiers are able to tally their cost and feed into their products. They are also able to accomplish the tasks related to financial transactions. In addition, restaurants deal with huge amount of cash and credit transactions, which can be handled easily utilizing restaurant management software. All these benefits are estimated to work in favor of the global POS restaurant management systems market in the years to come.
1. Global POS Restaurant Management System Market Market - Executive Summary
2. Global POS Restaurant Management System Market Market Overview
2.1. Introduction
2.1.1. Global POS Restaurant Management System Market Market Taxonomy
2.1.2. Global POS Restaurant Management System Market Market Definition
2.2. Global POS Restaurant Management System Market Market Size (US$ Mn) and Forecast, 2012-2026
2.2.1. Global POS Restaurant Management System Market Market Y-o-Y Growth
2.3. Global POS Restaurant Management System Market Market Dynamics
2.4. POS Restaurant Management System Architecture
2.5. Competitor Market Footprint Matrix
2.6. Road Map
2.7. Survey Analysis
2.8. Restaurant Industry Facts
2.9. Key Participants Market Presence (Intensity Map) By Region
3. Global POS Restaurant Management System Market Market Analysis and Forecast 2012-2026
3.1. Global POS Restaurant Management System Market Market Size and Forecast By Types, 2012-2026
3.1.1. Mobile POS Terminal Market Size and Forecast, 2012-2026
3.1.1.1. Revenue (US$ Mn) Comparison, By Region
3.1.1.2. Market Share Comparison, By Region
3.1.1.3. Y-o-Y growth Comparison, By Region
3.1.2. Fixed POS Terminal Market Size and Forecast, 2012-2026
3.1.2.1. Revenue (US$ Mn) Comparison, By Region
3.1.2.2. Market Share Comparison, By Region
3.1.2.3. Y-o-Y growth Comparison, By Region
3.2. Global POS Restaurant Management System Market Market Size and Forecast By End User, 2012-2026
3.2.1. Full-Service Restaurant Market Size and Forecast, 2012-2026
3.2.1.1. Revenue (US$ Mn) Comparison, By Region
3.2.1.2. Market Share Comparison, By Region
3.2.1.3. Y-o-Y growth Comparison, By Region
3.2.2. Quick-Service Restaurant Market Size and Forecast, 2012-2026
3.2.2.1. Revenue (US$ Mn) Comparison, By Region
3.2.2.2. Market Share Comparison, By Region
3.2.2.3. Y-o-Y growth Comparison, By Region
3.3. Global POS Restaurant Management System Market Market Size and Forecast By Application, 2012-2026
3.3.1. Delivery Management Market Size and Forecast, 2012-2026
3.3.1.1. Revenue (US$ Mn) Comparison, By Region
3.3.1.2. Market Share Comparison, By Region
3.3.1.3. Y-o-Y growth Comparison, By Region
3.3.2. Order Management Market Size and Forecast, 2012-2026
3.3.2.1. Revenue (US$ Mn) Comparison, By Region
3.3.2.2. Market Share Comparison, By Region
3.3.2.3. Y-o-Y growth Comparison, By Region
3.3.3. Billing Market Size and Forecast, 2012-2026
3.3.3.1. Revenue (US$ Mn) Comparison, By Region
3.3.3.2. Market Share Comparison, By Region
3.3.3.3. Y-o-Y growth Comparison, By Region
3.3.4. Stock & Inventory Management Market Size and Forecast, 2012-2026
3.3.4.1. Revenue (US$ Mn) Comparison, By Region
3.3.4.2. Market Share Comparison, By Region
3.3.4.3. Y-o-Y growth Comparison, By Region
3.3.5. Others Market Size and Forecast, 2012-2026
3.3.5.1. Revenue (US$ Mn) Comparison, By Region
3.3.5.2. Market Share Comparison, By Region
3.3.5.3. Y-o-Y growth Comparison, By Region
3.4. Global POS Restaurant Management System Market Market Size and Forecast By Component, 2012-2026
3.4.1. Hardware Market Size and Forecast, 2012-2026
3.4.1.1. Revenue (US$ Mn) Comparison, By Region
3.4.1.2. Market Share Comparison, By Region
3.4.1.3. Y-o-Y growth Comparison, By Region
3.4.2. Software Platform Market Size and Forecast, 2012-2026
3.4.2.1. Revenue (US$ Mn) Comparison, By Region
3.4.2.2. Market Share Comparison, By Region
3.4.2.3. Y-o-Y growth Comparison, By Region
3.4.3. Support Services Market Size and Forecast, 2012-2026
3.4.3.1. Revenue (US$ Mn) Comparison, By Region
3.4.3.2. Market Share Comparison, By Region
3.4.3.3. Y-o-Y growth Comparison, By Region
4. North America POS Restaurant Management System Market Market Size and Forecast, 2012-2026
4.1. Revenue (US$ Mn) Comparison, By Country
4.2. Revenue (US$ Mn) Comparison, By Types
4.3. Revenue (US$ Mn) Comparison, By End User
4.4. Revenue (US$ Mn) Comparison, By Application
4.5. Revenue (US$ Mn) Comparison, By Component
5. Latin America POS Restaurant Management System Market Market Size and Forecast, 2012-2026
5.1. Revenue (US$ Mn) Comparison, By Country
5.2. Revenue (US$ Mn) Comparison, By Types
5.3. Revenue (US$ Mn) Comparison, By End User
5.4. Revenue (US$ Mn) Comparison, By Application
5.5. Revenue (US$ Mn) Comparison, By Component
6. Europe POS Restaurant Management System Market Market Size and Forecast, 2012-2026
6.1. Revenue (US$ Mn) Comparison, By Country
6.2. Revenue (US$ Mn) Comparison, By Types
6.3. Revenue (US$ Mn) Comparison, By End User
6.4. Revenue (US$ Mn) Comparison, By Application
6.5. Revenue (US$ Mn) Comparison, By Component
7. Japan POS Restaurant Management System Market Market Size and Forecast, 2012-2026
7.1. Revenue (US$ Mn) Comparison, By Country
7.2. Revenue (US$ Mn) Comparison, By Types
7.3. Revenue (US$ Mn) Comparison, By End User
7.4. Revenue (US$ Mn) Comparison, By Application
7.5. Revenue (US$ Mn) Comparison, By Component
8. APEJ POS Restaurant Management System Market Market Size and Forecast, 2012-2026
8.1. Revenue (US$ Mn) Comparison, By Country
8.2. Revenue (US$ Mn) Comparison, By Types
8.3. Revenue (US$ Mn) Comparison, By End User
8.4. Revenue (US$ Mn) Comparison, By Application
8.5. Revenue (US$ Mn) Comparison, By Component
9. MEA POS Restaurant Management System Market Market Size and Forecast, 2012-2026
9.1. Revenue (US$ Mn) Comparison, By Country
9.2. Revenue (US$ Mn) Comparison, By Types
9.3. Revenue (US$ Mn) Comparison, By End User
9.4. Revenue (US$ Mn) Comparison, By Application
9.5. Revenue (US$ Mn) Comparison, By Component
10. Global POS Restaurant Management System Market Market Company Share, Competition Landscape and Company Profiles
10.1. Company Share Analysis
10.2. Competition Landscape
10.3. Company Profiles
10.3.1. NCR Corporation
10.3.2. PAR Technology Corporation
10.3.3. First Data Corporation.
10.3.4. Sysco Corporation
10.3.5. Ingenico Group
10.3.6. Toshiba Corporation
10.3.7. Intel Corp.
10.3.8. Oracle Corp
10.3.9. Samsung Electronics Co Ltd
10.3.10. Fujitsu Limited
11. Research Methodology
12. Secondary and Primary Sources
13. Assumptions and Acronyms
14. Disclaimer
List of Tables
TABLE 1 Global POS Restaurant Management System Market Market Value (US$ Mn), 2012-2017
TABLE 2 Global POS Restaurant Management System Market Market Value (US$ Mn), 2018-2026
TABLE 3 Global POS Restaurant Management System Market Market Value (US$ Mn) and Y-o-Y, 2017-2026
TABLE 4 Global Mobile POS Terminal Segment Value (US$ Mn), By Region 2012-2017
TABLE 5 Global Mobile POS Terminal Segment Value (US$ Mn), By Region 2018-2026
TABLE 6 Global Mobile POS Terminal Segment Market Share, By Region 2012-2017
TABLE 7 Global Mobile POS Terminal Segment Market Share, By Region 2018-2026
TABLE 8 Global Mobile POS Terminal Segment Y-o-Y, By Region 2017-2026
TABLE 9 Global Fixed POS Terminal Segment Value (US$ Mn), By Region 2012-2017
TABLE 10 Global Fixed POS Terminal Segment Value (US$ Mn), By Region 2018-2026
TABLE 11 Global Fixed POS Terminal Segment Market Share, By Region 2012-2017
TABLE 12 Global Fixed POS Terminal Segment Market Share, By Region 2018-2026
TABLE 13 Global Fixed POS Terminal Segment Y-o-Y, By Region 2017-2026
TABLE 14 Global Full-Service Restaurant Segment Value (US$ Mn), By Region 2012-2017
TABLE 15 Global Full-Service Restaurant Segment Value (US$ Mn), By Region 2018-2026
TABLE 16 Global Full-Service Restaurant Segment Market Share, By Region 2012-2017
TABLE 17 Global Full-Service Restaurant Segment Market Share, By Region 2018-2026
TABLE 18 Global Full-Service Restaurant Segment Y-o-Y, By Region 2017-2026
TABLE 19 Global Quick-Service Restaurant Segment Value (US$ Mn), By Region 2012-2017
TABLE 20 Global Quick-Service Restaurant Segment Value (US$ Mn), By Region 2018-2026
TABLE 21 Global Quick-Service Restaurant Segment Market Share, By Region 2012-2017
TABLE 22 Global Quick-Service Restaurant Segment Market Share, By Region 2018-2026
TABLE 23 Global Quick-Service Restaurant Segment Y-o-Y, By Region 2017-2026
TABLE 24 Global Delivery Management Segment Value (US$ Mn), By Region 2012-2017
TABLE 25 Global Delivery Management Segment Value (US$ Mn), By Region 2018-2026
TABLE 26 Global Delivery Management Segment Market Share, By Region 2012-2017
TABLE 27 Global Delivery Management Segment Market Share, By Region 2018-2026
TABLE 28 Global Delivery Management Segment Y-o-Y, By Region 2017-2026
TABLE 29 Global Order Management Segment Value (US$ Mn), By Region 2012-2017
TABLE 30 Global Order Management Segment Value (US$ Mn), By Region 2018-2026
TABLE 31 Global Order Management Segment Market Share, By Region 2012-2017
TABLE 32 Global Order Management Segment Market Share, By Region 2018-2026
TABLE 33 Global Order Management Segment Y-o-Y, By Region 2017-2026
TABLE 34 Global Billing Segment Value (US$ Mn), By Region 2012-2017
TABLE 35 Global Billing Segment Value (US$ Mn), By Region 2018-2026
TABLE 36 Global Billing Segment Market Share, By Region 2012-2017
TABLE 37 Global Billing Segment Market Share, By Region 2018-2026
TABLE 38 Global Billing Segment Y-o-Y, By Region 2017-2026
TABLE 39 Global Stock & Inventory Management Segment Value (US$ Mn), By Region 2012-2017
TABLE 40 Global Stock & Inventory Management Segment Value (US$ Mn), By Region 2018-2026
TABLE 41 Global Stock & Inventory Management Segment Market Share, By Region 2012-2017
TABLE 42 Global Stock & Inventory Management Segment Market Share, By Region 2018-2026
TABLE 43 Global Stock & Inventory Management Segment Y-o-Y, By Region 2017-2026
TABLE 44 Global Others Segment Value (US$ Mn), By Region 2012-2017
TABLE 45 Global Others Segment Value (US$ Mn), By Region 2018-2026
TABLE 46 Global Others Segment Market Share, By Region 2012-2017
TABLE 47 Global Others Segment Market Share, By Region 2018-2026
TABLE 48 Global Others Segment Y-o-Y, By Region 2017-2026
TABLE 49 Global Hardware Segment Value (US$ Mn), By Region 2012-2017
TABLE 50 Global Hardware Segment Value (US$ Mn), By Region 2018-2026
TABLE 51 Global Hardware Segment Market Share, By Region 2012-2017
TABLE 52 Global Hardware Segment Market Share, By Region 2018-2026
TABLE 53 Global Hardware Segment Y-o-Y, By Region 2017-2026
TABLE 54 Global Software Platform Segment Value (US$ Mn), By Region 2012-2017
TABLE 55 Global Software Platform Segment Value (US$ Mn), By Region 2018-2026
TABLE 56 Global Software Platform Segment Market Share, By Region 2012-2017
TABLE 57 Global Software Platform Segment Market Share, By Region 2018-2026
TABLE 58 Global Software Platform Segment Y-o-Y, By Region 2017-2026
TABLE 59 Global Support Services Segment Value (US$ Mn), By Region 2012-2017
TABLE 60 Global Support Services Segment Value (US$ Mn), By Region 2018-2026
TABLE 61 Global Support Services Segment Market Share, By Region 2012-2017
TABLE 62 Global Support Services Segment Market Share, By Region 2018-2026
TABLE 63 Global Support Services Segment Y-o-Y, By Region 2017-2026
TABLE 64 North America POS Restaurant Management System Market Market Value (US$ Mn), By Country 2012-2017
TABLE 65 North America POS Restaurant Management System Market Market Value (US$ Mn), By Country 2018-2026
TABLE 66 North America POS Restaurant Management System Market Market Value (US$ Mn), By Types 2012-2017
TABLE 67 North America POS Restaurant Management System Market Market Value (US$ Mn), By Types 2018-2026
TABLE 68 North America POS Restaurant Management System Market Market Value (US$ Mn), By End User 2012-2017
TABLE 69 North America POS Restaurant Management System Market Market Value (US$ Mn), By End User 2018-2026
TABLE 70 North America POS Restaurant Management System Market Market Value (US$ Mn), By Application 2012-2017
TABLE 71 North America POS Restaurant Management System Market Market Value (US$ Mn), By Application 2018-2026
TABLE 72 North America POS Restaurant Management System Market Market Value (US$ Mn), By Component 2012-2017
TABLE 73 North America POS Restaurant Management System Market Market Value (US$ Mn), By Component 2018-2026
TABLE 74 Latin America POS Restaurant Management System Market Market Value (US$ Mn), By Country 2012-2017
TABLE 75 Latin America POS Restaurant Management System Market Market Value (US$ Mn), By Country 2018-2026
TABLE 76 Latin America POS Restaurant Management System Market Market Value (US$ Mn), By Types 2012-2017
TABLE 77 Latin America POS Restaurant Management System Market Market Value (US$ Mn), By Types 2018-2026
TABLE 78 Latin America POS Restaurant Management System Market Market Value (US$ Mn), By End User 2012-2017
TABLE 79 Latin America POS Restaurant Management System Market Market Value (US$ Mn), By End User 2018-2026
TABLE 80 Latin America POS Restaurant Management System Market Market Value (US$ Mn), By Application 2012-2017
TABLE 81 Latin America POS Restaurant Management System Market Market Value (US$ Mn), By Application 2018-2026
TABLE 82 Latin America POS Restaurant Management System Market Market Value (US$ Mn), By Component 2012-2017
TABLE 83 Latin America POS Restaurant Management System Market Market Value (US$ Mn), By Component 2018-2026
TABLE 84 Europe POS Restaurant Management System Market Market Value (US$ Mn), By Country 2012-2017
TABLE 85 Europe POS Restaurant Management System Market Market Value (US$ Mn), By Country 2018-2026
TABLE 86 Europe POS Restaurant Management System Market Market Value (US$ Mn), By Types 2012-2017
TABLE 87 Europe POS Restaurant Management System Market Market Value (US$ Mn), By Types 2018-2026
TABLE 88 Europe POS Restaurant Management System Market Market Value (US$ Mn), By End User 2012-2017
TABLE 89 Europe POS Restaurant Management System Market Market Value (US$ Mn), By End User 2018-2026
TABLE 90 Europe POS Restaurant Management System Market Market Value (US$ Mn), By Application 2012-2017
TABLE 91 Europe POS Restaurant Management System Market Market Value (US$ Mn), By Application 2018-2026
TABLE 92 Europe POS Restaurant Management System Market Market Value (US$ Mn), By Component 2012-2017
TABLE 93 Europe POS Restaurant Management System Market Market Value (US$ Mn), By Component 2018-2026
TABLE 94 Japan POS Restaurant Management System Market Market Value (US$ Mn), By Country 2012-2017
TABLE 95 Japan POS Restaurant Management System Market Market Value (US$ Mn), By Country 2018-2026
TABLE 96 Japan POS Restaurant Management System Market Market Value (US$ Mn), By Types 2012-2017
TABLE 97 Japan POS Restaurant Management System Market Market Value (US$ Mn), By Types 2018-2026
TABLE 98 Japan POS Restaurant Management System Market Market Value (US$ Mn), By End User 2012-2017
TABLE 99 Japan POS Restaurant Management System Market Market Value (US$ Mn), By End User 2018-2026
TABLE 100 Japan POS Restaurant Management System Market Market Value (US$ Mn), By Application 2012-2017
TABLE 101 Japan POS Restaurant Management System Market Market Value (US$ Mn), By Application 2018-2026
TABLE 102 Japan POS Restaurant Management System Market Market Value (US$ Mn), By Component 2012-2017
TABLE 103 Japan POS Restaurant Management System Market Market Value (US$ Mn), By Component 2018-2026
TABLE 104 APEJ POS Restaurant Management System Market Market Value (US$ Mn), By Country 2012-2017
TABLE 105 APEJ POS Restaurant Management System Market Market Value (US$ Mn), By Country 2018-2026
TABLE 106 APEJ POS Restaurant Management System Market Market Value (US$ Mn), By Types 2012-2017
TABLE 107 APEJ POS Restaurant Management System Market Market Value (US$ Mn), By Types 2018-2026
TABLE 108 APEJ POS Restaurant Management System Market Market Value (US$ Mn), By End User 2012-2017
TABLE 109 APEJ POS Restaurant Management System Market Market Value (US$ Mn), By End User 2018-2026
TABLE 110 APEJ POS Restaurant Management System Market Market Value (US$ Mn), By Application 2012-2017
TABLE 111 APEJ POS Restaurant Management System Market Market Value (US$ Mn), By Application 2018-2026
TABLE 112 APEJ POS Restaurant Management System Market Market Value (US$ Mn), By Component 2012-2017
TABLE 113 APEJ POS Restaurant Management System Market Market Value (US$ Mn), By Component 2018-2026
TABLE 114 MEA POS Restaurant Management System Market Market Value (US$ Mn), By Country 2012-2017
TABLE 115 MEA POS Restaurant Management System Market Market Value (US$ Mn), By Country 2018-2026
TABLE 116 MEA POS Restaurant Management System Market Market Value (US$ Mn), By Types 2012-2017
TABLE 117 MEA POS Restaurant Management System Market Market Value (US$ Mn), By Types 2018-2026
TABLE 118 MEA POS Restaurant Management System Market Market Value (US$ Mn), By End User 2012-2017
TABLE 119 MEA POS Restaurant Management System Market Market Value (US$ Mn), By End User 2018-2026
TABLE 120 MEA POS Restaurant Management System Market Market Value (US$ Mn), By Application 2012-2017
TABLE 121 MEA POS Restaurant Management System Market Market Value (US$ Mn), By Application 2018-2026
TABLE 122 MEA POS Restaurant Management System Market Market Value (US$ Mn), By Component 2012-2017
TABLE 123 MEA POS Restaurant Management System Market Market Value (US$ Mn), By Component 2018-2026
List of Figures
FIG. 1 Global POS Restaurant Management System Market Market Value (US$ Mn), 2012-2017
FIG. 2 Global POS Restaurant Management System Market Market Value (US$ Mn) Forecast, 2018-2026
FIG. 3 Global POS Restaurant Management System Market Market Value (US$ Mn) and Y-o-Y, 2017-2026
FIG. 4 Global Mobile POS Terminal Segment Market Value (US$ Mn) By Region, 2012-2017
FIG. 5 Global Mobile POS Terminal Segment Market Value (US$ Mn) By Region, 2018-2026
FIG. 6 Global Mobile POS Terminal Segment Y-o-Y Growth Rate, By Region, 2017-2026
FIG. 7 Global Fixed POS Terminal Segment Market Value (US$ Mn) By Region, 2012-2017
FIG. 8 Global Fixed POS Terminal Segment Market Value (US$ Mn) By Region, 2018-2026
FIG. 9 Global Fixed POS Terminal Segment Y-o-Y Growth Rate, By Region, 2017-2026
FIG. 10 Global Full-Service Restaurant Segment Market Value (US$ Mn) By Region, 2012-2017
FIG. 11 Global Full-Service Restaurant Segment Market Value (US$ Mn) By Region, 2018-2026
FIG. 12 Global Full-Service Restaurant Segment Y-o-Y Growth Rate, By Region, 2017-2026
FIG. 13 Global Quick-Service Restaurant Segment Market Value (US$ Mn) By Region, 2012-2017
FIG. 14 Global Quick-Service Restaurant Segment Market Value (US$ Mn) By Region, 2018-2026
FIG. 15 Global Quick-Service Restaurant Segment Y-o-Y Growth Rate, By Region, 2017-2026
FIG. 16 Global Delivery Management Segment Market Value (US$ Mn) By Region, 2012-2017
FIG. 17 Global Delivery Management Segment Market Value (US$ Mn) By Region, 2018-2026
FIG. 18 Global Delivery Management Segment Y-o-Y Growth Rate, By Region, 2017-2026
FIG. 19 Global Order Management Segment Market Value (US$ Mn) By Region, 2012-2017
FIG. 20 Global Order Management Segment Market Value (US$ Mn) By Region, 2018-2026
FIG. 21 Global Order Management Segment Y-o-Y Growth Rate, By Region, 2017-2026
FIG. 22 Global Billing Segment Market Value (US$ Mn) By Region, 2012-2017
FIG. 23 Global Billing Segment Market Value (US$ Mn) By Region, 2018-2026
FIG. 24 Global Billing Segment Y-o-Y Growth Rate, By Region, 2017-2026
FIG. 25 Global Stock & Inventory Management Segment Market Value (US$ Mn) By Region, 2012-2017
FIG. 26 Global Stock & Inventory Management Segment Market Value (US$ Mn) By Region, 2018-2026
FIG. 27 Global Stock & Inventory Management Segment Y-o-Y Growth Rate, By Region, 2017-2026
FIG. 28 Global Others Segment Market Value (US$ Mn) By Region, 2012-2017
FIG. 29 Global Others Segment Market Value (US$ Mn) By Region, 2018-2026
FIG. 30 Global Others Segment Y-o-Y Growth Rate, By Region, 2017-2026
FIG. 31 Global Hardware Segment Market Value (US$ Mn) By Region, 2012-2017
FIG. 32 Global Hardware Segment Market Value (US$ Mn) By Region, 2018-2026
FIG. 33 Global Hardware Segment Y-o-Y Growth Rate, By Region, 2017-2026
FIG. 34 Global Software Platform Segment Market Value (US$ Mn) By Region, 2012-2017
FIG. 35 Global Software Platform Segment Market Value (US$ Mn) By Region, 2018-2026
FIG. 36 Global Software Platform Segment Y-o-Y Growth Rate, By Region, 2017-2026
FIG. 37 Global Support Services Segment Market Value (US$ Mn) By Region, 2012-2017
FIG. 38 Global Support Services Segment Market Value (US$ Mn) By Region, 2018-2026
FIG. 39 Global Support Services Segment Y-o-Y Growth Rate, By Region, 2017-2026
FIG. 40 North America POS Restaurant Management System Market Market Value (US$ Mn), By Country 2012-2017
FIG. 41 North America POS Restaurant Management System Market Market Value (US$ Mn), By Country 2018-2026
FIG. 42 North America POS Restaurant Management System Market Market Value (US$ Mn), By Types 2012-2017
FIG. 43 North America POS Restaurant Management System Market Market Value (US$ Mn), By Types 2018-2026
FIG. 44 North America POS Restaurant Management System Market Market Value (US$ Mn), By End User 2012-2017
FIG. 45 North America POS Restaurant Management System Market Market Value (US$ Mn), By End User 2018-2026
FIG. 46 North America POS Restaurant Management System Market Market Value (US$ Mn), By Application 2012-2017
FIG. 47 North America POS Restaurant Management System Market Market Value (US$ Mn), By Application 2018-2026
FIG. 48 North America POS Restaurant Management System Market Market Value (US$ Mn), By Component 2012-2017
FIG. 49 North America POS Restaurant Management System Market Market Value (US$ Mn), By Component 2018-2026
FIG. 50 Latin America POS Restaurant Management System Market Market Value (US$ Mn), By Country 2012-2017
FIG. 51 Latin America POS Restaurant Management System Market Market Value (US$ Mn), By Country 2018-2026
FIG. 52 Latin America POS Restaurant Management System Market Market Value (US$ Mn), By Types 2012-2017
FIG. 53 Latin America POS Restaurant Management System Market Market Value (US$ Mn), By Types 2018-2026
FIG. 54 Latin America POS Restaurant Management System Market Market Value (US$ Mn), By End User 2012-2017
FIG. 55 Latin America POS Restaurant Management System Market Market Value (US$ Mn), By End User 2018-2026
FIG. 56 Latin America POS Restaurant Management System Market Market Value (US$ Mn), By Application 2012-2017
FIG. 57 Latin America POS Restaurant Management System Market Market Value (US$ Mn), By Application 2018-2026
FIG. 58 Latin America POS Restaurant Management System Market Market Value (US$ Mn), By Component 2012-2017
FIG. 59 Latin America POS Restaurant Management System Market Market Value (US$ Mn), By Component 2018-2026
FIG. 60 Europe POS Restaurant Management System Market Market Value (US$ Mn), By Country 2012-2017
FIG. 61 Europe POS Restaurant Management System Market Market Value (US$ Mn), By Country 2018-2026
FIG. 62 Europe POS Restaurant Management System Market Market Value (US$ Mn), By Types 2012-2017
FIG. 63 Europe POS Restaurant Management System Market Market Value (US$ Mn), By Types 2018-2026
FIG. 64 Europe POS Restaurant Management System Market Market Value (US$ Mn), By End User 2012-2017
FIG. 65 Europe POS Restaurant Management System Market Market Value (US$ Mn), By End User 2018-2026
FIG. 66 Europe POS Restaurant Management System Market Market Value (US$ Mn), By Application 2012-2017
FIG. 67 Europe POS Restaurant Management System Market Market Value (US$ Mn), By Application 2018-2026
FIG. 68 Europe POS Restaurant Management System Market Market Value (US$ Mn), By Component 2012-2017
FIG. 69 Europe POS Restaurant Management System Market Market Value (US$ Mn), By Component 2018-2026
FIG. 70 Japan POS Restaurant Management System Market Market Value (US$ Mn), By Country 2012-2017
FIG. 71 Japan POS Restaurant Management System Market Market Value (US$ Mn), By Country 2018-2026
FIG. 72 Japan POS Restaurant Management System Market Market Value (US$ Mn), By Types 2012-2017
FIG. 73 Japan POS Restaurant Management System Market Market Value (US$ Mn), By Types 2018-2026
FIG. 74 Japan POS Restaurant Management System Market Market Value (US$ Mn), By Application 2012-2017
FIG. 75 Japan POS Restaurant Management System Market Market Value (US$ Mn), By End User 2018-2026
FIG. 76 Japan POS Restaurant Management System Market Market Value (US$ Mn), By Application 2012-2017
FIG. 77 Japan POS Restaurant Management System Market Market Value (US$ Mn), By Application 2018-2026
FIG. 78 Japan POS Restaurant Management System Market Market Value (US$ Mn), By Component 2012-2017
FIG. 79 Japan POS Restaurant Management System Market Market Value (US$ Mn), By Component 2018-2026
FIG. 80 APEJ POS Restaurant Management System Market Market Value (US$ Mn), By Country 2012-2017
FIG. 81 APEJ POS Restaurant Management System Market Market Value (US$ Mn), By Country 2018-2026
FIG. 82 APEJ POS Restaurant Management System Market Market Value (US$ Mn), By Types 2012-2017
FIG. 83 APEJ POS Restaurant Management System Market Market Value (US$ Mn), By Types 2018-2026
FIG. 84 APEJ POS Restaurant Management System Market Market Value (US$ Mn), By End User 2012-2017
FIG. 85 APEJ POS Restaurant Management System Market Market Value (US$ Mn), By End User 2018-2026
FIG. 86 APEJ POS Restaurant Management System Market Market Value (US$ Mn), By Application 2012-2017
FIG. 87 APEJ POS Restaurant Management System Market Market Value (US$ Mn), By Application 2018-2026
FIG. 88 APEJ POS Restaurant Management System Market Market Value (US$ Mn), By Component 2012-2017
FIG. 89 APEJ POS Restaurant Management System Market Market Value (US$ Mn), By Component 2018-2026
FIG. 90 MEA POS Restaurant Management System Market Market Value (US$ Mn), By Country 2012-2017
FIG. 91 MEA POS Restaurant Management System Market Market Value (US$ Mn), By Country 2018-2026
FIG. 92 MEA POS Restaurant Management System Market Market Value (US$ Mn), By Types 2012-2017
FIG. 93 MEA POS Restaurant Management System Market Market Value (US$ Mn), By Types 2018-2026
FIG. 94 MEA POS Restaurant Management System Market Market Value (US$ Mn), By End User 2012-2017
FIG. 95 MEA POS Restaurant Management System Market Market Value (US$ Mn), By End User 2018-2026
FIG. 96 MEA POS Restaurant Management System Market Market Value (US$ Mn), By Application 2012-2017
FIG. 97 MEA POS Restaurant Management System Market Market Value (US$ Mn), By Application 2018-2026
FIG. 98 MEA POS Restaurant Management System Market Market Value (US$ Mn), By Component 2012-2017
FIG. 99 MEA POS Restaurant Management System Market Market Value (US$ Mn), By Component 2018-2026
Copyright © Transparency Market Research, Inc. All Rights reserved
Trust Online

POS Restaurant Management Systems Market