
Reports
Reports
Global Polyurethane Foam Market: Snapshot
The polyurethane foam market has become a key part of various sectors in recent years due to the diverse applicability of polyurethane foam. The polyurethane foam market has gained demand from such diverse end use sectors as the construction industry, the automotive industry, and the packaging industry due to the favorable physical properties of polyurethane foam. Polyurethane foam is lightweight, which instantly puts it at an advantage against conventional materials in many end use sectors. In addition, polyurethane foam is chemically stable, flexible, and acts as an ideal insulating agent. The polyurethane foam market is thus likely to gain from the solid rise in demand from its numerous end use sectors over the 2017-2022 forecast period.
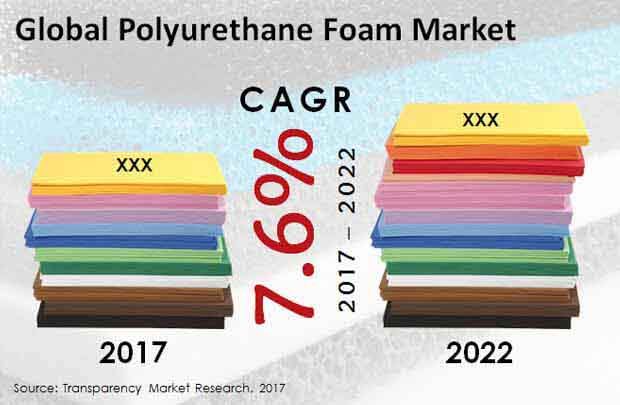
According to Transparency Market Research, the global polyurethane foam market is likely to rise from US$51.4 bn to US$74 bn over the 2017-2022 forecast period. The strong growth prospects of the polyurethane foam market between 2017 and 2022 are illustrated in its robust 7.6% CAGR therein.
Flexible Polyurethane Foam to Hold Slender Lead over Rigid Foam
The global polyurethane foam market is segmented by product type into flexible and rigid polyurethane foam. Of these, flexible polyurethane foam is the dominant contributor to the global polyurethane foam market. The flexible polyurethane foam segment accounted for 50.2% of the global market in 2017, with a valuation of US$25.5 bn, and is likely to rise to a valuation of US$36 bn by 2022. The flexible polyurethane foam segment is expected to account for 50.6% of the global market by 2022, exhibiting a 7.2% CAGR over the 2017-2022 forecast period.
APEJ to Remain Dominant Regional Market for Polyurethane Foam
Geographically, the report studies the performance of the polyurethane foam market in Japan, Asia Pacific except Japan, the Middle East and Africa, Europe, Latin America, and North America in order to present readers with a clear picture of how the market is likely to fare in various regions over the coming years. Of these, Asia Pacific except Japan is the dominant regional market for polyurethane foam, accounting for close to 40% of the global polyurethane foam market’s revenue in 2017. The Asia Pacific except Japan market for polyurethane foam is likely to gain 59 BPS in its share in the global polyurethane foam market over the 2017-2022 forecast period to reinforce its position as the dominant regional contributor to the global polyurethane foam market.
Europe, North America to Retain Significant Shares; MEA, Japan to Rise in Global Market Share
The Europe market for polyurethane foam is expected to exhibit a strong 7.2% CAGR over the 2017-2022 forecast period to emerge at a valuation of US$17.8 bn by the end of 2022. The polyurethane foam market is also likely to exhibit the same CAGR in North America between 2017 and 2022, with the North America polyurethane foam market expected to rise from a 2017 valuation of US$9.5 bn to US$13.4 bn by the end of 2022. The Japan polyurethane foam market is likely to exhibit a robust 8.1% CAGR over the 2017-2022 forecast period, rising to a valuation of US$1.9 bn by 2022. Meanwhile, the Middle East and Africa market for polyurethane foam is also likely to rise in estimation in the global market over the 2017-2022 forecast period, with the regional market set to gain 16 BPS by 2022 over its 2017 share in the global polyurethane foam market.
Global Polyurethane Foam Market: Competitive Dynamics
Key companies in the global polyurethane foam market include BASF SE, The Dow Chemical Company, Nitto Denko Corporation, Compagnie DE Saint-Gobain SA, Trelleborg AB, Recticel SA, Tosoh Corporation, Chemtura Corporation, UFP Technologies Inc., and Covestro AG.
Rising Demand from Automobile Industry to Drive Growth of Polyurethane Foam Market
Major demand from various end user industries such as the construction sector is expected to aid in expansion of the global polyurethane foam market. Polyurethane foams are adaptable, sturdy, synthetically steady, and give protection from warmth, dampness, and power. Furthermore, they have the characteristics to keep up upgraded padding and fixing. Because of these properties, businesses like oil and gas, car, and others utilize polyurethane foams. In the oil and gas industry, utilization of polyurethane foams in the protection of pipelines ensures smooth operational working. In auto area, vehicle hardware like armrests, dashboards, and different outsides are required to build the use of polyurethane foam. The utilization of these foams upholds private structures in keeping up the clamor levels and uniform temperature.
The polyurethane foam market has acquired interest from such assorted end use areas as the development business, the auto business, and the bundling business because of the great actual properties of polyurethane foam. Polyurethane foam is lightweight, which in a flash sets it at a benefit against customary materials in many end use areas. Likewise, polyurethane foam is artificially steady, adaptable, and goes about as an ideal protecting specialist. The polyurethane foam market is consequently liable to acquire from the strong ascent sought after from its various end use in the upcoming future.
On the contrary, a major restraint challenging this market is the imposition of severe ecological guidelines detailed by the US Environmental Protection Agency (EPA) for new and existing plant locales that are occupied with assembling of adaptable polyurethane foams.
Nevertheless, polyurethane foam products offer natural advantages which incorporate recyclability decrease in wastage, and higher supportability. Be that as it may, some administrative and government organizations are worried about the unfriendly medical problems of isocyanates utilized in the creation of polyurethane foam, thereby creating lucrative growth opportunities for the market in the coming years.
Polyurethane Foam Market is expected to reach US$74 bn by 2022
Polyurethane Foam Market is estimated to rise at a CAGR of 7.6% during forecast period
Rising Demand from Automobile Industry to Drive Growth of Polyurethane Foam Market
Asia Pacific is more attractive for vendors in the Polyurethane Foam Market
Key players of Polyurethane Foam Market are BASF SE, The Dow Chemical Company, Nitto Denko Corporation, Compagnie DE Saint-Gobain SA, Trelleborg AB, Recticel SA, Tosoh Corporation, Chemtura Corporation, UFP Technologies Inc., and Covestro AG
1. Global Polyurethane Foam Market - Executive Summary
2. Global Polyurethane Foam Market Overview
2.1. Introduction
2.1.1. Global Polyurethane Foam Market Taxonomy
2.1.2. Global Polyurethane Foam Market Definition
2.2. Global Polyurethane Foam Market Size (US$ Mn) and Forecast, 2012-2022
2.2.1. Global Polyurethane Foam Market Y-o-Y Growth
2.3. Global Polyurethane Foam Market Dynamics
2.4. Supply Chain
2.5. Cost Structure
2.6. Pricing Analysis
2.7. Raw Material Sourcing Strategy and Analysis
2.8. Supplier List
2.9. Key Participants Market Presence (Intensity Map) By Region
3. Global Polyurethane Foam Market Analysis and Forecast By Product Type
3.1. Global Polyurethane Foam Market Size and Forecast By Product Type, 2012-2022
3.1.1. Flexible Polyurethane Foam Market Size and Forecast, 2012-2022
3.1.1.1. Revenue (US$ Mn) Comparison, By Region
3.1.1.2. Market Share Comparison, By Region
3.1.1.3. Y-o-Y growth Comparison, By Region
3.1.2. Rigid Polyurethane Foam Market Size and Forecast, 2012-2022
3.1.2.1. Revenue (US$ Mn) Comparison, By Region
3.1.2.2. Market Share Comparison, By Region
3.1.2.3. Y-o-Y growth Comparison, By Region
4. Global Polyurethane Foam Market Analysis and Forecast By Application
4.1. Global Polyurethane Foam Market Size and Forecast By Application, 2012-2022
4.1.1. Building & Construction Market Size and Forecast, 2012-2022
4.1.1.1. Revenue (US$ Mn) Comparison, By Region
4.1.1.2. Market Share Comparison, By Region
4.1.1.3. Y-o-Y growth Comparison, By Region
4.1.2. Bedding & Furniture Market Size and Forecast, 2012-2022
4.1.2.1. Revenue (US$ Mn) Comparison, By Region
4.1.2.2. Market Share Comparison, By Region
4.1.2.3. Y-o-Y growth Comparison, By Region
4.1.3. Automotive Market Size and Forecast, 2012-2022
4.1.3.1. Revenue (US$ Mn) Comparison, By Region
4.1.3.2. Market Share Comparison, By Region
4.1.3.3. Y-o-Y growth Comparison, By Region
4.1.4. Packaging Market Size and Forecast, 2012-2022
4.1.4.1. Revenue (US$ Mn) Comparison, By Region
4.1.4.2. Market Share Comparison, By Region
4.1.4.3. Y-o-Y growth Comparison, By Region
4.1.5. Electronics Market Size and Forecast, 2012-2022
4.1.5.1. Revenue (US$ Mn) Comparison, By Region
4.1.5.2. Market Share Comparison, By Region
4.1.5.3. Y-o-Y growth Comparison, By Region
4.1.6. Footwear Market Size and Forecast, 2012-2022
4.1.6.1. Revenue (US$ Mn) Comparison, By Region
4.1.6.2. Market Share Comparison, By Region
4.1.6.3. Y-o-Y growth Comparison, By Region
4.1.7. Others (wires & cables, hoses & tubings, etc.) Market Size and Forecast, 2012-2022
4.1.7.1. Revenue (US$ Mn) Comparison, By Region
4.1.7.2. Market Share Comparison, By Region
4.1.7.3. Y-o-Y growth Comparison, By Region
5. Global Polyurethane Foam Market Analysis and Forecast By End Use
5.1. Global Polyurethane Foam Market Size and Forecast By End Use, 2012-2022
5.1.1. Heat & Sound Insulation Market Size and Forecast, 2012-2022
5.1.1.1. Revenue (US$ Mn) Comparison, By Region
5.1.1.2. Market Share Comparison, By Region
5.1.1.3. Y-o-Y growth Comparison, By Region
5.1.2. Aesthetics & Seating Comfort Market Size and Forecast, 2012-2022
5.1.2.1. Revenue (US$ Mn) Comparison, By Region
5.1.2.2. Market Share Comparison, By Region
5.1.2.3. Y-o-Y growth Comparison, By Region
5.1.3. Packaging Safety Market Size and Forecast, 2012-2022
5.1.3.1. Revenue (US$ Mn) Comparison, By Region
5.1.3.2. Market Share Comparison, By Region
5.1.3.3. Y-o-Y growth Comparison, By Region
5.1.4. Dielectric & Adhesive Market Size and Forecast, 2012-2022
5.1.4.1. Revenue (US$ Mn) Comparison, By Region
5.1.4.2. Market Share Comparison, By Region
5.1.4.3. Y-o-Y growth Comparison, By Region
6. Global Polyurethane Foam Market Analysis and Forecast By Region
6.1. Global Polyurethane Foam Market Size and Forecast, 2012-2022
6.1.1. North America Polyurethane Foam Market Size and Forecast, 2012-2022
6.1.1.1. Revenue (US$ Mn) Comparison, By Product Type
6.1.1.2. Revenue (US$ Mn) Comparison, By Application
6.1.1.3. Revenue (US$ Mn) Comparison, By End Use
6.1.2. Latin America Polyurethane Foam Market Size and Forecast, 2012-2022
6.1.2.1. Revenue (US$ Mn) Comparison, By Product Type
6.1.2.2. Revenue (US$ Mn) Comparison, By Application
6.1.2.3. Revenue (US$ Mn) Comparison, By End Use
6.1.3. Europe Polyurethane Foam Market Size and Forecast, 2012-2022
6.1.3.1. Revenue (US$ Mn) Comparison, By Product Type
6.1.3.2. Revenue (US$ Mn) Comparison, By Application
6.1.3.3. Revenue (US$ Mn) Comparison, By End Use
6.1.4. Japan Polyurethane Foam Market Size and Forecast, 2012-2022
6.1.4.1. Revenue (US$ Mn) Comparison, By Product Type
6.1.4.2. Revenue (US$ Mn) Comparison, By Application
6.1.4.3. Revenue (US$ Mn) Comparison, By End Use
6.1.5. APEJ Polyurethane Foam Market Size and Forecast, 2012-2022
6.1.5.1. Revenue (US$ Mn) Comparison, By Product Type
6.1.5.2. Revenue (US$ Mn) Comparison, By Application
6.1.5.3. Revenue (US$ Mn) Comparison, By End Use
6.1.6. MEA Polyurethane Foam Market Size and Forecast, 2012-2022
6.1.6.1. Revenue (US$ Mn) Comparison, By Product Type
6.1.6.2. Revenue (US$ Mn) Comparison, By Application
6.1.6.3. Revenue (US$ Mn) Comparison, By End Use
7. North America Polyurethane Foam Market Analysis and Forecast, By Country, 2012-2022
7.1. US Polyurethane Foam Market Size and Forecast, 2012-2022
7.1.1. Revenue (US$ Mn) Comparison, By Product Type
7.1.2. Revenue (US$ Mn) Comparison, By Application
7.1.3. Revenue (US$ Mn) Comparison, By End Use
7.2. Canada Polyurethane Foam Market Size and Forecast, 2012-2022
7.2.1. Revenue (US$ Mn) Comparison, By Product Type
7.2.2. Revenue (US$ Mn) Comparison, By Application
7.2.3. Revenue (US$ Mn) Comparison, By End Use
8. Latin America Polyurethane Foam Market Analysis and Forecast, By Country, 2012-2022
8.1. Brazil Polyurethane Foam Market Size and Forecast, 2012-2022
8.1.1. Revenue (US$ Mn) Comparison, By Product Type
8.1.2. Revenue (US$ Mn) Comparison, By Application
8.1.3. Revenue (US$ Mn) Comparison, By End Use
8.2. Mexico Polyurethane Foam Market Size and Forecast, 2012-2022
8.2.1. Revenue (US$ Mn) Comparison, By Product Type
8.2.2. Revenue (US$ Mn) Comparison, By Application
8.2.3. Revenue (US$ Mn) Comparison, By End Use
8.3. Argentina Polyurethane Foam Market Size and Forecast, 2012-2022
8.3.1. Revenue (US$ Mn) Comparison, By Product Type
8.3.2. Revenue (US$ Mn) Comparison, By Application
8.3.3. Revenue (US$ Mn) Comparison, By End Use
9. Europe Polyurethane Foam Market Analysis and Forecast, By Country, 2012-2022
9.1. Germany Polyurethane Foam Market Size and Forecast, 2012-2022
9.1.1. Revenue (US$ Mn) Comparison, By Product Type
9.1.2. Revenue (US$ Mn) Comparison, By Application
9.1.3. Revenue (US$ Mn) Comparison, By End Use
9.2. France Polyurethane Foam Market Size and Forecast, 2012-2022
9.2.1. Revenue (US$ Mn) Comparison, By Product Type
9.2.2. Revenue (US$ Mn) Comparison, By Application
9.2.3. Revenue (US$ Mn) Comparison, By End Use
9.3. U.K. Polyurethane Foam Market Size and Forecast, 2012-2022
9.3.1. Revenue (US$ Mn) Comparison, By Product Type
9.3.2. Revenue (US$ Mn) Comparison, By Application
9.3.3. Revenue (US$ Mn) Comparison, By End Use
9.4. Italy Polyurethane Foam Market Size and Forecast, 2012-2022
9.4.1. Revenue (US$ Mn) Comparison, By Product Type
9.4.2. Revenue (US$ Mn) Comparison, By Application
9.4.3. Revenue (US$ Mn) Comparison, By End Use
9.5. Spain Polyurethane Foam Market Size and Forecast, 2012-2022
9.5.1. Revenue (US$ Mn) Comparison, By Product Type
9.5.2. Revenue (US$ Mn) Comparison, By Application
9.5.3. Revenue (US$ Mn) Comparison, By End Use
9.6. Russia Polyurethane Foam Market Size and Forecast, 2012-2022
9.6.1. Revenue (US$ Mn) Comparison, By Product Type
9.6.2. Revenue (US$ Mn) Comparison, By Application
9.6.3. Revenue (US$ Mn) Comparison, By End Use
10. Japan Polyurethane Foam Market Analysis and Forecast, By Country, 2012-2022
10.1. Japan Polyurethane Foam Market Size and Forecast, 2012-2022
10.1.1. Revenue (US$ Mn) Comparison, By Product Type
10.1.2. Revenue (US$ Mn) Comparison, By Application
10.1.3. Revenue (US$ Mn) Comparison, By End Use
11. APEJ Polyurethane Foam Market Analysis and Forecast, By Country, 2012-2022
11.1. China Polyurethane Foam Market Size and Forecast, 2012-2022
11.1.1. Revenue (US$ Mn) Comparison, By Product Type
11.1.2. Revenue (US$ Mn) Comparison, By Application
11.1.3. Revenue (US$ Mn) Comparison, By End Use
11.2. ASEAN Polyurethane Foam Market Size and Forecast, 2012-2022
11.2.1. Revenue (US$ Mn) Comparison, By Product Type
11.2.2. Revenue (US$ Mn) Comparison, By Application
11.2.3. Revenue (US$ Mn) Comparison, By End Use
11.3. India Polyurethane Foam Market Size and Forecast, 2012-2022
11.3.1. Revenue (US$ Mn) Comparison, By Product Type
11.3.2. Revenue (US$ Mn) Comparison, By Application
11.3.3. Revenue (US$ Mn) Comparison, By End Use
11.4. Taiwan Polyurethane Foam Market Size and Forecast, 2012-2022
11.4.1. Revenue (US$ Mn) Comparison, By Product Type
11.4.2. Revenue (US$ Mn) Comparison, By Application
11.4.3. Revenue (US$ Mn) Comparison, By End Use
11.5. South Korea Polyurethane Foam Market Size and Forecast, 2012-2022
11.5.1. Revenue (US$ Mn) Comparison, By Product Type
11.5.2. Revenue (US$ Mn) Comparison, By Application
11.5.3. Revenue (US$ Mn) Comparison, By End Use
11.6. Australia & New Zealand Polyurethane Foam Market Size and Forecast, 2012-2022
11.6.1. Revenue (US$ Mn) Comparison, By Product Type
11.6.2. Revenue (US$ Mn) Comparison, By Application
11.6.3. Revenue (US$ Mn) Comparison, By End Use
12. MEA Polyurethane Foam Market Analysis and Forecast, By Country, 2012-2022
12.1. GCC Countries Polyurethane Foam Market Size and Forecast, 2012-2022
12.1.1. Revenue (US$ Mn) Comparison, By Product Type
12.1.2. Revenue (US$ Mn) Comparison, By Application
12.1.3. Revenue (US$ Mn) Comparison, By End Use
12.2. Turkey Polyurethane Foam Market Size and Forecast, 2012-2022
12.2.1. Revenue (US$ Mn) Comparison, By Product Type
12.2.2. Revenue (US$ Mn) Comparison, By Application
12.2.3. Revenue (US$ Mn) Comparison, By End Use
12.3. Northern Africa Polyurethane Foam Market Size and Forecast, 2012-2022
12.3.1. Revenue (US$ Mn) Comparison, By Product Type
12.3.2. Revenue (US$ Mn) Comparison, By Application
12.3.3. Revenue (US$ Mn) Comparison, By End Use
12.4. South Africa Polyurethane Foam Market Size and Forecast, 2012-2022
12.4.1. Revenue (US$ Mn) Comparison, By Product Type
12.4.2. Revenue (US$ Mn) Comparison, By Application
12.4.3. Revenue (US$ Mn) Comparison, By End Use
13. Global Polyurethane Foam Market Company Share, Competition Landscape and Company Profiles
13.1. Company Share Analysis
13.2. Competition Landscape
13.3. Company Profiles
13.3.1. BASF SE
13.3.2. The Dow Chemical Company
13.3.3. Nitto Denko Corporation
13.3.4. Compagnie DE Saint-Gobain S.A.
13.3.5. Trelleborg AB
13.3.6. Recticel SA
13.3.7. Tosoh Corporation
13.3.8. Chemtura Corporation
13.3.9. UFP Technologies Inc.
13.3.10. Covestro AG
14. Research Methodology
15. Secondary and Primary Sources
16. Assumptions and Acronyms
17. Disclaimer
List of Tables
TABLE 1 Global Polyurethane Foam Market Value (US$ Mn), 2012-2016
TABLE 2 Global Polyurethane Foam Market Value (US$ Mn), 2017-2022
TABLE 3 Global Polyurethane Foam Market Value (US$ Mn) and Y-o-Y, 2015-2022
TABLE 4 Global Flexible Polyurethane Foam Segment Value (US$ Mn), By Region 2012-2016
TABLE 5 Global Flexible Polyurethane Foam Segment Value (US$ Mn), By Region 2017-2022
TABLE 6 Global Flexible Polyurethane Foam Segment Market Share, By Region 2012-2016
TABLE 7 Global Flexible Polyurethane Foam Segment Market Share, By Region 2017-2022
TABLE 8 Global Flexible Polyurethane Foam Segment Y-o-Y, By Region 2015-2022
TABLE 9 Global Rigid Polyurethane Foam Segment Value (US$ Mn), By Region 2012-2016
TABLE 10 Global Rigid Polyurethane Foam Segment Value (US$ Mn), By Region 2017-2022
TABLE 11 Global Rigid Polyurethane Foam Segment Market Share, By Region 2012-2016
TABLE 12 Global Rigid Polyurethane Foam Segment Market Share, By Region 2017-2022
TABLE 13 Global Rigid Polyurethane Foam Segment Y-o-Y, By Region 2015-2022
TABLE 14 Global Building & Construction Segment Value (US$ Mn), By Region 2012-2016
TABLE 15 Global Building & Construction Segment Value (US$ Mn), By Region 2017-2022
TABLE 16 Global Building & Construction Segment Market Share, By Region 2012-2016
TABLE 17 Global Building & Construction Segment Market Share, By Region 2017-2022
TABLE 18 Global Building & Construction Segment Y-o-Y, By Region 2015-2022
TABLE 19 Global Bedding & Furniture Segment Value (US$ Mn), By Region 2012-2016
TABLE 20 Global Bedding & Furniture Segment Value (US$ Mn), By Region 2017-2022
TABLE 21 Global Bedding & Furniture Segment Market Share, By Region 2012-2016
TABLE 22 Global Bedding & Furniture Segment Market Share, By Region 2017-2022
TABLE 23 Global Bedding & Furniture Segment Y-o-Y, By Region 2015-2022
TABLE 24 Global Automotive Segment Value (US$ Mn), By Region 2012-2016
TABLE 25 Global Automotive Segment Value (US$ Mn), By Region 2017-2022
TABLE 26 Global Automotive Segment Market Share, By Region 2012-2016
TABLE 27 Global Automotive Segment Market Share, By Region 2017-2022
TABLE 28 Global Automotive Segment Y-o-Y, By Region 2015-2022
TABLE 29 Global Packaging Segment Value (US$ Mn), By Region 2012-2016
TABLE 30 Global Packaging Segment Value (US$ Mn), By Region 2017-2022
TABLE 31 Global Packaging Segment Market Share, By Region 2012-2016
TABLE 32 Global Packaging Segment Market Share, By Region 2017-2022
TABLE 33 Global Packaging Segment Y-o-Y, By Region 2015-2022
TABLE 34 Global Electronics Segment Value (US$ Mn), By Region 2012-2016
TABLE 35 Global Electronics Segment Value (US$ Mn), By Region 2017-2022
TABLE 36 Global Electronics Segment Market Share, By Region 2012-2016
TABLE 37 Global Electronics Segment Market Share, By Region 2017-2022
TABLE 38 Global Electronics Segment Y-o-Y, By Region 2015-2022
TABLE 39 Global Footwear Segment Value (US$ Mn), By Region 2012-2016
TABLE 40 Global Footwear Segment Value (US$ Mn), By Region 2017-2022
TABLE 41 Global Footwear Segment Market Share, By Region 2012-2016
TABLE 42 Global Footwear Segment Market Share, By Region 2017-2022
TABLE 43 Global Footwear Segment Y-o-Y, By Region 2015-2022
TABLE 44 Global Others (wires & cables, hoses & tubings, etc..) Segment Value (US$ Mn), By Region 2012-2016
TABLE 45 Global Others (wires & cables, hoses & tubings, etc..) Segment Value (US$ Mn), By Region 2017-2022
TABLE 46 Global Others (wires & cables, hoses & tubings, etc..) Segment Market Share, By Region 2012-2016
TABLE 47 Global Others (wires & cables, hoses & tubings, etc..) Segment Market Share, By Region 2017-2022
TABLE 48 Global Others (wires & cables, hoses & tubings, etc..) Segment Y-o-Y, By Region 2015-2022
TABLE 49 Global Heat & Sound Insulation Segment Value (US$ Mn), By Region 2012-2016
TABLE 50 Global Heat & Sound Insulation Segment Value (US$ Mn), By Region 2017-2022
TABLE 51 Global Heat & Sound Insulation Segment Market Share, By Region 2012-2016
TABLE 52 Global Heat & Sound Insulation Segment Market Share, By Region 2017-2022
TABLE 53 Global Heat & Sound Insulation Segment Y-o-Y, By Region 2015-2022
TABLE 54 Global Aesthetics & Seating Comfort Segment Value (US$ Mn), By Region 2012-2016
TABLE 55 Global Aesthetics & Seating Comfort Segment Value (US$ Mn), By Region 2017-2022
TABLE 56 Global Aesthetics & Seating Comfort Segment Market Share, By Region 2012-2016
TABLE 57 Global Aesthetics & Seating Comfort Segment Market Share, By Region 2017-2022
TABLE 58 Global Aesthetics & Seating Comfort Segment Y-o-Y, By Region 2015-2022
TABLE 59 Global Packaging Safety Segment Value (US$ Mn), By Region 2012-2016
TABLE 60 Global Packaging Safety Segment Value (US$ Mn), By Region 2017-2022
TABLE 61 Global Packaging Safety Segment Market Share, By Region 2012-2016
TABLE 62 Global Packaging Safety Segment Market Share, By Region 2017-2022
TABLE 63 Global Packaging Safety Segment Y-o-Y, By Region 2015-2022
TABLE 64 Global Dielectric & Adhesive Segment Value (US$ Mn), By Region 2012-2016
TABLE 65 Global Dielectric & Adhesive Segment Value (US$ Mn), By Region 2017-2022
TABLE 66 Global Dielectric & Adhesive Segment Market Share, By Region 2012-2016
TABLE 67 Global Dielectric & Adhesive Segment Market Share, By Region 2017-2022
TABLE 68 Global Dielectric & Adhesive Segment Y-o-Y, By Region 2015-2022
TABLE 69 North America Polyurethane Foam Market Value (US$ Mn), By Product Type2012-2016
TABLE 70 North America Polyurethane Foam Market Value (US$ Mn), By Product Type2017-2022
TABLE 71 North America Polyurethane Foam Market Value (US$ Mn), By Application2012-2016
TABLE 72 North America Polyurethane Foam Market Value (US$ Mn), By Application2017-2022
TABLE 73 North America Polyurethane Foam Market Value (US$ Mn), By End Use2012-2016
TABLE 74 North America Polyurethane Foam Market Value (US$ Mn), By End Use2017-2022
TABLE 75 Latin America Polyurethane Foam Market Value (US$ Mn), By Product Type2012-2016
TABLE 76 Latin America Polyurethane Foam Market Value (US$ Mn), By Product Type2017-2022
TABLE 77 Latin America Polyurethane Foam Market Value (US$ Mn), By Application2012-2016
TABLE 78 Latin America Polyurethane Foam Market Value (US$ Mn), By Application2017-2022
TABLE 79 Latin America Polyurethane Foam Market Value (US$ Mn), By End Use2012-2016
TABLE 80 Latin America Polyurethane Foam Market Value (US$ Mn), By End Use2017-2022
TABLE 81 Europe Polyurethane Foam Market Value (US$ Mn), By Product Type2012-2016
TABLE 82 Europe Polyurethane Foam Market Value (US$ Mn), By Product Type2017-2022
TABLE 83 Europe Polyurethane Foam Market Value (US$ Mn), By Application2012-2016
TABLE 84 Europe Polyurethane Foam Market Value (US$ Mn), By Application2017-2022
TABLE 85 Europe Polyurethane Foam Market Value (US$ Mn), By End Use2012-2016
TABLE 86 Europe Polyurethane Foam Market Value (US$ Mn), By End Use2017-2022
TABLE 87 Japan Polyurethane Foam Market Value (US$ Mn), By Product Type2012-2016
TABLE 88 Japan Polyurethane Foam Market Value (US$ Mn), By Product Type2017-2022
TABLE 89 Japan Polyurethane Foam Market Value (US$ Mn), By Application2012-2016
TABLE 90 Japan Polyurethane Foam Market Value (US$ Mn), By Application2017-2022
TABLE 91 Japan Polyurethane Foam Market Value (US$ Mn), By End Use2012-2016
TABLE 92 Japan Polyurethane Foam Market Value (US$ Mn), By End Use2017-2022
TABLE 93 APEJ Polyurethane Foam Market Value (US$ Mn), By Product Type2012-2016
TABLE 94 APEJ Polyurethane Foam Market Value (US$ Mn), By Product Type2017-2022
TABLE 95 APEJ Polyurethane Foam Market Value (US$ Mn), By Application2012-2016
TABLE 96 APEJ Polyurethane Foam Market Value (US$ Mn), By Application2017-2022
TABLE 97 APEJ Polyurethane Foam Market Value (US$ Mn), By End Use2012-2016
TABLE 98 APEJ Polyurethane Foam Market Value (US$ Mn), By End Use2017-2022
TABLE 99 MEA Polyurethane Foam Market Value (US$ Mn), By Product Type2012-2016
TABLE 100 MEA Polyurethane Foam Market Value (US$ Mn), By Product Type2017-2022
TABLE 101 MEA Polyurethane Foam Market Value (US$ Mn), By Application2012-2016
TABLE 102 MEA Polyurethane Foam Market Value (US$ Mn), By Application2017-2022
TABLE 103 MEA Polyurethane Foam Market Value (US$ Mn), By End Use2012-2016
TABLE 104 MEA Polyurethane Foam Market Value (US$ Mn), By End Use2017-2022
TABLE 105 US Polyurethane Foam Market Value (US$ Mn), By Product Type2012-2016
TABLE 106 US Polyurethane Foam Market Value (US$ Mn), By Product Type2017-2022
TABLE 107 US Polyurethane Foam Market Value (US$ Mn), By Application2012-2016
TABLE 108 US Polyurethane Foam Market Value (US$ Mn), By Application2017-2022
TABLE 109 US Polyurethane Foam Market Value (US$ Mn), By End Use2012-2016
TABLE 110 US Polyurethane Foam Market Value (US$ Mn), By End Use2017-2022
TABLE 111 Canada Polyurethane Foam Market Value (US$ Mn), By Product Type2012-2016
TABLE 112 Canada Polyurethane Foam Market Value (US$ Mn), By Product Type2017-2022
TABLE 113 Canada Polyurethane Foam Market Value (US$ Mn), By Application2012-2016
TABLE 114 Canada Polyurethane Foam Market Value (US$ Mn), By Application2017-2022
TABLE 115 Canada Polyurethane Foam Market Value (US$ Mn), By End Use2012-2016
TABLE 116 Canada Polyurethane Foam Market Value (US$ Mn), By End Use2017-2022
TABLE 117 Brazil Polyurethane Foam Market Value (US$ Mn), By Product Type2012-2016
TABLE 118 Brazil Polyurethane Foam Market Value (US$ Mn), By Product Type2017-2022
TABLE 119 Brazil Polyurethane Foam Market Value (US$ Mn), By Application2012-2016
TABLE 120 Brazil Polyurethane Foam Market Value (US$ Mn), By Application2017-2022
TABLE 121 Brazil Polyurethane Foam Market Value (US$ Mn), By End Use2012-2016
TABLE 122 Brazil Polyurethane Foam Market Value (US$ Mn), By End Use2017-2022
TABLE 123 Mexico Polyurethane Foam Market Value (US$ Mn), By Product Type2012-2016
TABLE 124 Mexico Polyurethane Foam Market Value (US$ Mn), By Product Type2017-2022
TABLE 125 Mexico Polyurethane Foam Market Value (US$ Mn), By Application2012-2016
TABLE 126 Mexico Polyurethane Foam Market Value (US$ Mn), By Application2017-2022
TABLE 127 Mexico Polyurethane Foam Market Value (US$ Mn), By End Use2012-2016
TABLE 128 Mexico Polyurethane Foam Market Value (US$ Mn), By End Use2017-2022
TABLE 129 Argentina Polyurethane Foam Market Value (US$ Mn), By Product Type2012-2016
TABLE 130 Argentina Polyurethane Foam Market Value (US$ Mn), By Product Type2017-2022
TABLE 131 Argentina Polyurethane Foam Market Value (US$ Mn), By Application2012-2016
TABLE 132 Argentina Polyurethane Foam Market Value (US$ Mn), By Application2017-2022
TABLE 133 Argentina Polyurethane Foam Market Value (US$ Mn), By End Use2012-2016
TABLE 134 Argentina Polyurethane Foam Market Value (US$ Mn), By End Use2017-2022
TABLE 135 Germany Polyurethane Foam Market Value (US$ Mn), By Product Type2012-2016
TABLE 136 Germany Polyurethane Foam Market Value (US$ Mn), By Product Type2017-2022
TABLE 137 Germany Polyurethane Foam Market Value (US$ Mn), By Application2012-2016
TABLE 138 Germany Polyurethane Foam Market Value (US$ Mn), By Application2017-2022
TABLE 139 Germany Polyurethane Foam Market Value (US$ Mn), By End Use2012-2016
TABLE 140 Germany Polyurethane Foam Market Value (US$ Mn), By End Use2017-2022
TABLE 141 France Polyurethane Foam Market Value (US$ Mn), By Product Type2012-2016
TABLE 142 France Polyurethane Foam Market Value (US$ Mn), By Product Type2017-2022
TABLE 143 France Polyurethane Foam Market Value (US$ Mn), By Application2012-2016
TABLE 144 France Polyurethane Foam Market Value (US$ Mn), By Application2017-2022
TABLE 145 France Polyurethane Foam Market Value (US$ Mn), By End Use2012-2016
TABLE 146 France Polyurethane Foam Market Value (US$ Mn), By End Use2017-2022
TABLE 147 U.K. Polyurethane Foam Market Value (US$ Mn), By Product Type2012-2016
TABLE 148 U.K. Polyurethane Foam Market Value (US$ Mn), By Product Type2017-2022
TABLE 149 U.K. Polyurethane Foam Market Value (US$ Mn), By Application2012-2016
TABLE 150 U.K. Polyurethane Foam Market Value (US$ Mn), By Application2017-2022
TABLE 151 U.K. Polyurethane Foam Market Value (US$ Mn), By End Use2012-2016
TABLE 152 U.K. Polyurethane Foam Market Value (US$ Mn), By End Use2017-2022
TABLE 153 Italy Polyurethane Foam Market Value (US$ Mn), By Product Type2012-2016
TABLE 154 Italy Polyurethane Foam Market Value (US$ Mn), By Product Type2017-2022
TABLE 155 Italy Polyurethane Foam Market Value (US$ Mn), By Application2012-2016
TABLE 156 Italy Polyurethane Foam Market Value (US$ Mn), By Application2017-2022
TABLE 157 Italy Polyurethane Foam Market Value (US$ Mn), By End Use2012-2016
TABLE 158 Italy Polyurethane Foam Market Value (US$ Mn), By End Use2017-2022
TABLE 159 Spain Polyurethane Foam Market Value (US$ Mn), By Product Type2012-2016
TABLE 160 Spain Polyurethane Foam Market Value (US$ Mn), By Product Type2017-2022
TABLE 161 Spain Polyurethane Foam Market Value (US$ Mn), By Application2012-2016
TABLE 162 Spain Polyurethane Foam Market Value (US$ Mn), By Application2017-2022
TABLE 163 Spain Polyurethane Foam Market Value (US$ Mn), By End Use2012-2016
TABLE 164 Spain Polyurethane Foam Market Value (US$ Mn), By End Use2017-2022
TABLE 165 Russia Polyurethane Foam Market Value (US$ Mn), By Product Type2012-2016
TABLE 166 Russia Polyurethane Foam Market Value (US$ Mn), By Product Type2017-2022
TABLE 167 Russia Polyurethane Foam Market Value (US$ Mn), By Application2012-2016
TABLE 168 Russia Polyurethane Foam Market Value (US$ Mn), By Application2017-2022
TABLE 169 Russia Polyurethane Foam Market Value (US$ Mn), By End Use2012-2016
TABLE 170 Russia Polyurethane Foam Market Value (US$ Mn), By End Use2017-2022
TABLE 171 Japan Polyurethane Foam Market Value (US$ Mn), By Product Type2012-2016
TABLE 172 Japan Polyurethane Foam Market Value (US$ Mn), By Product Type2017-2022
TABLE 173 Japan Polyurethane Foam Market Value (US$ Mn), By Application2012-2016
TABLE 174 Japan Polyurethane Foam Market Value (US$ Mn), By Application2017-2022
TABLE 175 Japan Polyurethane Foam Market Value (US$ Mn), By End Use2012-2016
TABLE 176 Japan Polyurethane Foam Market Value (US$ Mn), By End Use2017-2022
TABLE 177 China Polyurethane Foam Market Value (US$ Mn), By Product Type2012-2016
TABLE 178 China Polyurethane Foam Market Value (US$ Mn), By Product Type2017-2022
TABLE 179 China Polyurethane Foam Market Value (US$ Mn), By Application2012-2016
TABLE 180 China Polyurethane Foam Market Value (US$ Mn), By Application2017-2022
TABLE 181 China Polyurethane Foam Market Value (US$ Mn), By End Use2012-2016
TABLE 182 China Polyurethane Foam Market Value (US$ Mn), By End Use2017-2022
TABLE 183 ASEAN Polyurethane Foam Market Value (US$ Mn), By Product Type2012-2016
TABLE 184 ASEAN Polyurethane Foam Market Value (US$ Mn), By Product Type2017-2022
TABLE 185 ASEAN Polyurethane Foam Market Value (US$ Mn), By Application2012-2016
TABLE 186 ASEAN Polyurethane Foam Market Value (US$ Mn), By Application2017-2022
TABLE 187 ASEAN Polyurethane Foam Market Value (US$ Mn), By End Use2012-2016
TABLE 188 ASEAN Polyurethane Foam Market Value (US$ Mn), By End Use2017-2022
TABLE 189 India Polyurethane Foam Market Value (US$ Mn), By Product Type2012-2016
TABLE 190 India Polyurethane Foam Market Value (US$ Mn), By Product Type2017-2022
TABLE 191 India Polyurethane Foam Market Value (US$ Mn), By Application2012-2016
TABLE 192 India Polyurethane Foam Market Value (US$ Mn), By Application2017-2022
TABLE 193 India Polyurethane Foam Market Value (US$ Mn), By End Use2012-2016
TABLE 194 India Polyurethane Foam Market Value (US$ Mn), By End Use2017-2022
TABLE 195 Taiwan Polyurethane Foam Market Value (US$ Mn), By Product Type2012-2016
TABLE 196 Taiwan Polyurethane Foam Market Value (US$ Mn), By Product Type2017-2022
TABLE 197 Taiwan Polyurethane Foam Market Value (US$ Mn), By Application2012-2016
TABLE 198 Taiwan Polyurethane Foam Market Value (US$ Mn), By Application2017-2022
TABLE 199 Taiwan Polyurethane Foam Market Value (US$ Mn), By End Use2012-2016
TABLE 200 Taiwan Polyurethane Foam Market Value (US$ Mn), By End Use2017-2022
TABLE 201 South Korea Polyurethane Foam Market Value (US$ Mn), By Product Type2012-2016
TABLE 202 South Korea Polyurethane Foam Market Value (US$ Mn), By Product Type2017-2022
TABLE 203 South Korea Polyurethane Foam Market Value (US$ Mn), By Application2012-2016
TABLE 204 South Korea Polyurethane Foam Market Value (US$ Mn), By Application2017-2022
TABLE 205 South Korea Polyurethane Foam Market Value (US$ Mn), By End Use2012-2016
TABLE 206 South Korea Polyurethane Foam Market Value (US$ Mn), By End Use2017-2022
TABLE 207 Australia & New Zealand Polyurethane Foam Market Value (US$ Mn), By Product Type2012-2016
TABLE 208 Australia & New Zealand Polyurethane Foam Market Value (US$ Mn), By Product Type2017-2022
TABLE 209 Australia & New Zealand Polyurethane Foam Market Value (US$ Mn), By Application2012-2016
TABLE 210 Australia & New Zealand Polyurethane Foam Market Value (US$ Mn), By Application2017-2022
TABLE 211 Australia & New Zealand Polyurethane Foam Market Value (US$ Mn), By End Use2012-2016
TABLE 212 Australia & New Zealand Polyurethane Foam Market Value (US$ Mn), By End Use2017-2022
TABLE 213 GCC Countries Polyurethane Foam Market Value (US$ Mn), By Product Type2012-2016
TABLE 214 GCC Countries Polyurethane Foam Market Value (US$ Mn), By Product Type2017-2022
TABLE 215 GCC Countries Polyurethane Foam Market Value (US$ Mn), By Application2012-2016
TABLE 216 GCC Countries Polyurethane Foam Market Value (US$ Mn), By Application2017-2022
TABLE 217 GCC Countries Polyurethane Foam Market Value (US$ Mn), By End Use2012-2016
TABLE 218 GCC Countries Polyurethane Foam Market Value (US$ Mn), By End Use2017-2022
TABLE 219 Turkey Polyurethane Foam Market Value (US$ Mn), By Product Type2012-2016
TABLE 220 Turkey Polyurethane Foam Market Value (US$ Mn), By Product Type2017-2022
TABLE 221 Turkey Polyurethane Foam Market Value (US$ Mn), By Application2012-2016
TABLE 222 Turkey Polyurethane Foam Market Value (US$ Mn), By Application2017-2022
TABLE 223 Turkey Polyurethane Foam Market Value (US$ Mn), By End Use2012-2016
TABLE 224 Turkey Polyurethane Foam Market Value (US$ Mn), By End Use2017-2022
TABLE 225 Northern Africa Polyurethane Foam Market Value (US$ Mn), By Product Type2012-2016
TABLE 226 Northern Africa Polyurethane Foam Market Value (US$ Mn), By Product Type2017-2022
TABLE 227 Northern Africa Polyurethane Foam Market Value (US$ Mn), By Application2012-2016
TABLE 228 Northern Africa Polyurethane Foam Market Value (US$ Mn), By Application2017-2022
TABLE 229 Northern Africa Polyurethane Foam Market Value (US$ Mn), By End Use2012-2016
TABLE 230 Northern Africa Polyurethane Foam Market Value (US$ Mn), By End Use2017-2022
TABLE 231 South Africa Polyurethane Foam Market Value (US$ Mn), By Product Type2012-2016
TABLE 232 South Africa Polyurethane Foam Market Value (US$ Mn), By Product Type2017-2022
TABLE 233 South Africa Polyurethane Foam Market Value (US$ Mn), By Application2012-2016
TABLE 234 South Africa Polyurethane Foam Market Value (US$ Mn), By Application2017-2022
TABLE 235 South Africa Polyurethane Foam Market Value (US$ Mn), By End Use2012-2016
TABLE 236 South Africa Polyurethane Foam Market Value (US$ Mn), By End Use2017-2022
List of Figures
FIG. 1 Global Polyurethane Foam Market Value (US$ Mn), 2012-2016
FIG. 2 Global Polyurethane Foam Market Value (US$ Mn) Forecast, 2017-2022
FIG. 3 Global Polyurethane Foam Market Value (US$ Mn) and Y-o-Y, 2015-2022
FIG. 4 Global Flexible Polyurethane Foam Segment Market Value (US$ Mn) By Region, 2012-2016
FIG. 5 Global Flexible Polyurethane Foam Segment Market Value (US$ Mn) By Region, 2017-2022
FIG. 6 Global Flexible Polyurethane Foam Segment Y-o-Y Growth Rate, By Region, 2015-2022
FIG. 7 Global Rigid Polyurethane Foam Segment Market Value (US$ Mn) By Region, 2012-2016
FIG. 8 Global Rigid Polyurethane Foam Segment Market Value (US$ Mn) By Region, 2017-2022
FIG. 9 Global Rigid Polyurethane Foam Segment Y-o-Y Growth Rate, By Region, 2015-2022
FIG. 10 Global Building & Construction Segment Market Value (US$ Mn) By Region, 2012-2016
FIG. 11 Global Building & Construction Segment Market Value (US$ Mn) By Region, 2017-2022
FIG. 12 Global Building & Construction Segment Y-o-Y Growth Rate, By Region, 2015-2022
FIG. 13 Global Bedding & Furniture Segment Market Value (US$ Mn) By Region, 2012-2016
FIG. 14 Global Bedding & Furniture Segment Market Value (US$ Mn) By Region, 2017-2022
FIG. 15 Global Bedding & Furniture Segment Y-o-Y Growth Rate, By Region, 2015-2022
FIG. 16 Global Automotive Segment Market Value (US$ Mn) By Region, 2012-2016
FIG. 17 Global Automotive Segment Market Value (US$ Mn) By Region, 2017-2022
FIG. 18 Global Automotive Segment Y-o-Y Growth Rate, By Region, 2015-2022
FIG. 19 Global Packaging Segment Market Value (US$ Mn) By Region, 2012-2016
FIG. 20 Global Packaging Segment Market Value (US$ Mn) By Region, 2017-2022
FIG. 21 Global Packaging Segment Y-o-Y Growth Rate, By Region, 2015-2022
FIG. 22 Global Electronics Segment Market Value (US$ Mn) By Region, 2012-2016
FIG. 23 Global Electronics Segment Market Value (US$ Mn) By Region, 2017-2022
FIG. 24 Global Electronics Segment Y-o-Y Growth Rate, By Region, 2015-2022
FIG. 25 Global Footwear Segment Market Value (US$ Mn) By Region, 2012-2016
FIG. 26 Global Footwear Segment Market Value (US$ Mn) By Region, 2017-2022
FIG. 27 Global Footwear Segment Y-o-Y Growth Rate, By Region, 2015-2022
FIG. 28 Global Others (wires & cables, hoses & tubings, etc..) Segment Market Value (US$ Mn) By Region, 2012-2016
FIG. 29 Global Others (wires & cables, hoses & tubings, etc..) Segment Market Value (US$ Mn) By Region, 2017-2022
FIG. 30 Global Others (wires & cables, hoses & tubings, etc..) Segment Y-o-Y Growth Rate, By Region, 2015-2022
FIG. 31 Global Heat & Sound Insulation Segment Market Value (US$ Mn) By Region, 2012-2016
FIG. 32 Global Heat & Sound Insulation Segment Market Value (US$ Mn) By Region, 2017-2022
FIG. 33 Global Heat & Sound Insulation Segment Y-o-Y Growth Rate, By Region, 2015-2022
FIG. 34 Global Aesthetics & Seating Comfort Segment Market Value (US$ Mn) By Region, 2012-2016
FIG. 35 Global Aesthetics & Seating Comfort Segment Market Value (US$ Mn) By Region, 2017-2022
FIG. 36 Global Aesthetics & Seating Comfort Segment Y-o-Y Growth Rate, By Region, 2015-2022
FIG. 37 Global Packaging Safety Segment Market Value (US$ Mn) By Region, 2012-2016
FIG. 38 Global Packaging Safety Segment Market Value (US$ Mn) By Region, 2017-2022
FIG. 39 Global Packaging Safety Segment Y-o-Y Growth Rate, By Region, 2015-2022
FIG. 40 Global Dielectric & Adhesive Segment Market Value (US$ Mn) By Region, 2012-2016
FIG. 41 Global Dielectric & Adhesive Segment Market Value (US$ Mn) By Region, 2017-2022
FIG. 42 Global Dielectric & Adhesive Segment Y-o-Y Growth Rate, By Region, 2015-2022
FIG. 43 North America Polyurethane Foam Market Value (US$ Mn), By Product Type2012-2016
FIG. 44 North America Polyurethane Foam Market Value (US$ Mn), By Product Type2017-2022
FIG. 45 North America Polyurethane Foam Market Value (US$ Mn), By Application2012-2016
FIG. 46 North America Polyurethane Foam Market Value (US$ Mn), By Application2017-2022
FIG. 47 North America Polyurethane Foam Market Value (US$ Mn), By End Use2012-2016
FIG. 48 North America Polyurethane Foam Market Value (US$ Mn), By End Use2017-2022
FIG. 49 Latin America Polyurethane Foam Market Value (US$ Mn), By Product Type2012-2016
FIG. 50 Latin America Polyurethane Foam Market Value (US$ Mn), By Product Type2017-2022
FIG. 51 Latin America Polyurethane Foam Market Value (US$ Mn), By Application2012-2016
FIG. 52 Latin America Polyurethane Foam Market Value (US$ Mn), By Application2017-2022
FIG. 53 Latin America Polyurethane Foam Market Value (US$ Mn), By End Use2012-2016
FIG. 54 Latin America Polyurethane Foam Market Value (US$ Mn), By End Use2017-2022
FIG. 55 Europe Polyurethane Foam Market Value (US$ Mn), By Product Type2012-2016
FIG. 56 Europe Polyurethane Foam Market Value (US$ Mn), By Product Type2017-2022
FIG. 57 Europe Polyurethane Foam Market Value (US$ Mn), By Application2012-2016
FIG. 58 Europe Polyurethane Foam Market Value (US$ Mn), By Application2017-2022
FIG. 59 Europe Polyurethane Foam Market Value (US$ Mn), By End Use2012-2016
FIG. 60 Europe Polyurethane Foam Market Value (US$ Mn), By End Use2017-2022
FIG. 61 Japan Polyurethane Foam Market Value (US$ Mn), By Product Type2012-2016
FIG. 62 Japan Polyurethane Foam Market Value (US$ Mn), By Product Type2017-2022
FIG. 63 Japan Polyurethane Foam Market Value (US$ Mn), By Application2012-2016
FIG. 64 Japan Polyurethane Foam Market Value (US$ Mn), By Application2017-2022
FIG. 65 Japan Polyurethane Foam Market Value (US$ Mn), By End Use2012-2016
FIG. 66 Japan Polyurethane Foam Market Value (US$ Mn), By End Use2017-2022
FIG. 67 APEJ Polyurethane Foam Market Value (US$ Mn), By Product Type2012-2016
FIG. 68 APEJ Polyurethane Foam Market Value (US$ Mn), By Product Type2017-2022
FIG. 69 APEJ Polyurethane Foam Market Value (US$ Mn), By Application2012-2016
FIG. 70 APEJ Polyurethane Foam Market Value (US$ Mn), By Application2017-2022
FIG. 71 APEJ Polyurethane Foam Market Value (US$ Mn), By End Use2012-2016
FIG. 72 APEJ Polyurethane Foam Market Value (US$ Mn), By End Use2017-2022
FIG. 73 MEA Polyurethane Foam Market Value (US$ Mn), By Product Type2012-2016
FIG. 74 MEA Polyurethane Foam Market Value (US$ Mn), By Product Type2017-2022
FIG. 75 MEA Polyurethane Foam Market Value (US$ Mn), By Application2012-2016
FIG. 76 MEA Polyurethane Foam Market Value (US$ Mn), By Application2017-2022
FIG. 77 MEA Polyurethane Foam Market Value (US$ Mn), By End Use2012-2016
FIG. 78 MEA Polyurethane Foam Market Value (US$ Mn), By End Use2017-2022
Copyright © Transparency Market Research, Inc. All Rights reserved
Trust Online

Polyurethane Foam Market