
Reports
Reports
Plastics Market for Electrical Appliances - Snapshot
Plastic is one of the highly functional, esthetic, and sustainable materials. It has replaced materials such as metal, concrete, and wood, as it is light in weight, corrosion proof, economical, and esthetically appealing. Manufacture of plastic also entails less energy. Global production of plastic stood at 322 million tons in 2015 and is estimated to increase at a CAGR of 6% to 7% by 2020. Plastics are bad conductors of electricity. Therefore, they are used in applications that require insulating properties. For instance, PVC is commonly used in wires and cables, while thermosets such as PU and PE are used in handles, switches, etc. Plastics is employed in outer body packaging of household appliances (toaster, blender, mixer, etc.) and personal care appliances (hair dryers, electrical razors, etc.).
Plastic is one of the key materials used in the manufacture of electrical appliances. Several resins such as ABS, SAN, PP, and PS are widely used in the manufacture of different appliances. In terms of revenue, the global plastics market for electrical appliances was valued at US$ 15.8 Bn. The market is anticipated to expand at a CAGR of 7.5% between 2017 and 2025. Growth in the market is largely driven by the rise in demand for electrical appliances across the globe. Demand for electrical appliances across the world is anticipated to increase at 6.6% per annum during the forecast period, thus offering substantial demand for plastics. In terms of type of resin, the PP segment accounted for substantial market share in 2016 as it is highly moldable and relatively inexpensive. The PP segment is anticipated to expand significantly during the forecast period. ABS & SAN and PS are also widely employed in electrical appliances. Other types of resins such as PC, PA, and LDPE have demand in niche applications. PC and PA demonstrate superior properties; however, their price is high. Thus, their usage in electrical appliances is limited.
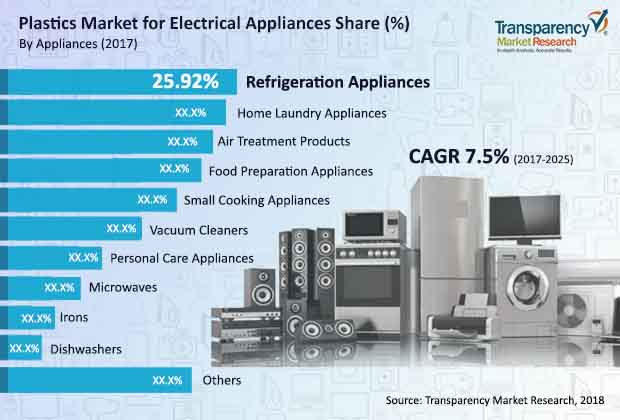
Air treatment products is one of the fast growing appliance segments of the market. Rise in demand for air treatment products such as air conditioners, especially split air conditioners, air purifiers, and fans is the key factor driving the segment. However, in terms of consumption, refrigeration appliances was the dominant segment of the market in 2016. The segment consumed substantial quanta of total plastic in 2016 and is anticipated to expand nearly twice by 2025. A typical refrigerator consists of several plastic components such as liners, trays, handles, holders, and stands. Thus, demand for plastic is high in the segment.
Demand for electrical appliances has been rising since the last two years. It is impacted by several factors such as availability of products, trends in an individual appliance segment, product development, per capita expenditure, disposable income, and economic factors. Increase in production of electrical appliances is expected to further boost the demand for plastics in the near future. Mass production of electrical appliances with plastic components also provides economic advantages while maintaining optimum functionality. Styrenic polymers, in particular, exhibit a wide range of properties through different products such as polystyrene, ABS, SAN, and block copolymers. The shift in usage from traditional materials to plastics has also propelled the plastics market. Unlike metals or organic materials, plastics are corrosion resistant. With the help of additives, they can also be made chemical- and acid-resistant. Furthermore, the need to produce lightweight appliances, while maintaining high performance, reliability, durability, and dimensional stability is met with the help of plastics. Different colors, textures, and properties such as transparency and opacity can be achieved with the use of colored additives or by blending two or more polymers. These factors work in tandem and propel the demand for plastics for electrical appliances.
Asia Pacific is a leading region of the market. The market in the region is anticipated to expand significantly during the forecast period. Asia Pacific is a global manufacturing hub. Prevalence of low-cost labor, lenient government regulations, inexpensive raw materials, and high demand for electrical appliances has rendered countries in Asia Pacific such as China, Thailand, Malaysia, India, South Korea, and Indonesia attractive manufacturing destinations for several electrical appliance brands. This has contributed to the dominant share of Asia Pacific in the total demand for plastics in the world. Following Asia Pacific, Europe was a significant market for plastics in electrical appliances. Various electrical appliances such as small cooking products, food preparation appliances, and dishwashers are manufactured in Europe. Thus, demand for plastics is high in the region.
Key players operating in the plastics market for electrical appliances include Lyondell Basell, Sinopec Group., PetroChina Group, Braskem Group, Shin-Etsu Chemicals, Ineos Styrolution Group GmbH, Borealis, SABIC, Exxon Mobil, Reliance Industries, Total PC, and Formosa Plastics Corp. Most manufacturers offer few polymers such as styrenics, i.e. ABS, SAN, and PS or polyethylene, i.e. LDPE, HDPE, LLPDE, XLPE, etc.
Stakeholders in Plastics Market for Electrical Appliances Lean on Improving Recyclability Value
Plastics are a versatile material that pose as cost-effective manufacturing materials for several industries. Plastics used in electrical and electronic devices are characterized by being flame-retardant, lightweight, electrical insulation properties, and melt stability. Additionally, suppliers in the plastics market for electrical appliances provide copolymers for manufacturing electrical devices which have high machinability, such as plastics that are compatible with high-temperature circuit assembly methods. The plastics market for electrical appliances has made remarkable strides on the back of the rise in demand for electrical home appliances in numerous developing and developed nations. Chemical companies and resin manufacturers are leaning on research and development activities with the objective of unveiling polymers and resins with attractive dimensional stability. Electronic device manufacturers have also been reaping benefits that newly developed plastics promise, notably excellent creep and fatigue resistance. Designers have gained access to polymers and resins that allow them to exercise freedom in developing a wide variety of electronics components.
Advances in the chemistries of polymers are the key pivot on which new product developments emerge in the plastics market for electrical appliances. Over the past few months, companies, however, have faced supply chain disruptions due to COVID-19-led lockdowns. The pandemic has also adversely affected the retail shopping trends in various countries across the globe. Hence, players in the plastics market for electrical appliances are keen on adopting strategies that help them remain agile in the post-COVID world. One of the prominent trends that might attract demand is the recyclability quotient of plastics. Some of the large electrical companies have begun strengthening their plastic recycling infrastructure. Moreover, a few electrical manufacturers have come with new technologies that enable them to sort out different polymers from the discarded electrical appliances and finally recycle these. Such initiatives allow them to recycle more than half of the plastics contained in these appliances. Key polymers recycled include polypropylene (PP), acrylonitrile-butadiene-styrene (ABS), and polystyrene (PS).
1. Preface
1.1. Report Scope and Market Segmentation
1.2. Research Highlights
2. Assumptions and Research Methodology
2.1. Report Assumptions
2.2. Secondary Sources
2.3. Scope of the Study
2.4. Research Methodology
3. Executive Summary
3.1. Market Outlook, Volume Share, 2016
3.2. Market Snapshot, by Resins
3.3. Market Snapshot, by Appliances
3.4. Market Key Trends
4. Market Overview
4.1. Market Indicators
4.2. Drivers and Restraints Snapshot Analysis
4.2.1. Drivers
4.2.2. Restraints
4.2.3. Opportunity Analysis
4.3. Porter’s Analysis
4.3.1. Bargaining Power of Buyers
4.3.2. Bargaining Power of Suppliers
4.3.3. Threat of New Entrants
4.3.4. Threat of Substitutes
4.3.5. Degree of Competition
4.4. Global Plastics Market for Electrical Appliances Analysis and Forecast, 2016-2025
4.5. Value Chain Analysis
4.6. Global Plastics Market for Electrical Appliances Industry: SWOT Analysis
5. Price Trend Analysis
5.1. Price Trend Analysis of Plastics, by Resin, 2016-2025
5.2. Price Comparison of Plastics, by Resin and Region, 2016
6. Global Plastics Import - Export Scenario, 2013-2020
7. Global Plastics Production Scenario, 2017
8. Plastics Market for Electrical Appliances Analysis, by Resin
8.1. Global Plastics Market for Electrical Appliances, by Resin: Snapshot
8.2. Global Plastics Demand: by Resin and Region, 2016
8.3. Global Plastics Market for Electrical Appliances Volume Share Analysis, by Resin
8.4. Global Plastics Market for Electrical Appliances Forecast, by Resin
8.4.1. Polycarbonate Volume (Kilo Tons) and Revenue (US$ Mn) Forecast, 2016–2025
8.4.2. Polypropylene Volume (Kilo Tons) and Revenue (US$ Mn) Forecast, 2016–2025
8.4.3. Acrylonitrile Butadiene Styrene & Styrene Acrylonitrile Volume (Kilo Tons) and Revenue (US$ Mn) Forecast, 2016–2025
8.4.4. Light-density Polyethylene (LDPE) Volume (Kilo Tons) and Revenue (US$ Mn) Forecast, 2016–2025
8.4.5. Polystyrene (PS) Volume (Kilo Tons) and Revenue (US$ Mn) Forecast, 2016–2025
8.4.6. Polyvinyl Chloride (PVC) Volume (Kilo Tons) and Revenue (US$ Mn) Forecast, 2016–2025
8.4.7. Polyamide (PA) Volume (Kilo Tons) and Revenue (US$ Mn) Forecast, 2016–2025
8.4.8. Others Market Volume (Kilo Tons) and Revenue (US$ Mn) Forecast, 2016–2025
8.5. Global Plastics Market for Electrical Appliances Snapshot: Appliance by Resin
8.6. Global Plastics Market for Electrical Appliances Attractiveness Analysis, by Resin
9. Plastics Market for Electrical Appliances Analysis, by Appliances
9.1. Global Plastics Market for Electrical Appliances, by Appliances: Snapshot
9.2. Global Plastics Demand, by Appliances and Region
9.3. Global Plastics Market for Electrical Appliances Volume Share Analysis, by Appliances
9.4. Global Plastics Market for Electrical Appliances Forecast, by Appliances
9.4.1. Refrigeration Appliances Market Volume (Kilo Tons) and Revenue (US$ Mn) Forecast, 2016–2025
9.4.2. Home Laundry Appliances Market Volume (Kilo Tons) and Revenue (US$ Mn) Forecast, 2016–2025
9.4.3. Dishwashers Market Volume (Kilo Tons) and Revenue (US$ Mn) Forecast, 2016–2025
9.4.4. Air Treatment Products Market Volume (Kilo Tons) and Revenue (US$ Mn) Forecast, 2016–2025
9.4.5. Microwaves Market Volume (Kilo Tons) and Revenue (US$ Mn) Forecast, 2016–2025
9.4.6. Small Cooking Appliances Market Volume (Kilo Tons) and Revenue (US$ Mn) Forecast, 2016–2025
9.4.7. Vacuum Cleaners Market Volume (Kilo Tons) and Revenue (US$ Mn) Forecast, 2016–2025
9.4.8. Food Preparation Appliances Market Volume (Kilo Tons) and Revenue (US$ Mn) Forecast, 2016–2025
9.4.9. Personal Care Appliances Market Volume (Kilo Tons) and Revenue (US$ Mn) Forecast, 2016–2025
9.4.10. Irons Market Volume (Kilo Tons) and Revenue (US$ Mn) Forecast, 2016–2025
9.4.11. Others Market Volume (Kilo Tons) and Revenue (US$ Mn) Forecast, 2016–2025
9.5. Global Plastics Market for Electrical Appliances Attractiveness Analysis, by Appliances
10. Global Plastics Market for Electrical Appliances Analysis by Region
10.1. Global Plastics Market for Electrical Appliances, by Region: Snapshot
10.2. Global Plastics Market for Electrical Appliances Volume Share Analysis, by Region
10.3. Global Plastics Market for Electrical Appliances Forecast, by Region
10.3.1. North America Market Volume (Kilo Tons) and Revenue (US$ Mn) Forecast, 2016–2025
10.3.2. Europe Market Volume (Kilo Tons) and Revenue (US$ Mn) Forecast, 2016–2025
10.3.3. Asia Pacific Market Volume (Kilo Tons) and Revenue (US$ Mn) Forecast, 2016–2025
10.3.4. Latin America Market Volume (Kilo Tons) and Revenue (US$ Mn) Forecast, 2016–2025
10.3.5. Middle East and Africa Market Volume (Kilo Tons) and Revenue (US$ Mn) Forecast, 2016–2025
10.4. Global Plastics Market for Electrical Appliances Attractiveness Analysis, by Region
11. Global Plastics Market for Electrical Appliances Analysis
11.1. Introduction & Overview
11.1.1. Refrigerator Appliances
11.1.2. Home Laundry Appliances
11.1.3. Dishwashers
11.1.4. Air Treatment Products
11.1.5. Microwaves
11.1.6. Small Cooking Appliances
11.1.7. Vacuum Cleaners
11.1.8. Food Preparation Appliances
11.1.9. Personal Care Appliances
11.1.10. Irons
11.1.11. Others
11.2. Global Plastics Market for Electrical Appliances: Region Snapshot, 2016
11.3. Global Plastics Market for Electrical Appliances: Snapshot (2016)
11.4. Global Plastics Market for Electrical Appliances Forecast, by Resin, 2016-2025
11.5. Global Plastics Market for Electrical Appliances Forecast, by Appliance, 2016-2025
11.6. Global Plastics Market for Electrical Appliances: Plastic Market Value, Volume, and Competition Dashboard, 2016
11.7. Global Plastics Market for Electrical Appliances Snapshot: Appliance by Resin, 2016
11.8. Global Plastics Market for Electrical Appliances: Market Trends
12. North America Plastics Market for Electrical Appliances Analysis Volume (Kilo Tons) and Revenue (US$ Mn) Forecast, 2016–2025
12.1. U.S. Plastic Market for Electrical Appliances Volume (Kilo Tons) and Revenue (US$ Mn) Forecast, 2016–2025
12.2. Canada Plastic Market for Electrical Appliances Volume (Kilo Tons) and Revenue (US$ Mn) Forecast, 2016–2025
13. Europe Plastics Market for Electrical Appliances Analysis Volume (Kilo Tons) and Revenue (US$ Mn) Forecast, 2016–2025
13.1. Germany Plastic Market for Electrical Appliances Volume (Kilo Tons) and Revenue (US$ Mn) Forecast, 2016–2025
13.2. France Plastic Market for Electrical Appliances Volume (Kilo Tons) and Revenue (US$ Mn) Forecast, 2016–2025
13.3. U.K. Plastic Market for Electrical Appliances Volume (Kilo Tons) and Revenue (US$ Mn) Forecast, 2016–2025
13.4. Italy Plastic Market for Electrical Appliances Volume (Kilo Tons) and Revenue (US$ Mn) Forecast, 2016–2025
13.5. Spain Plastic Market for Electrical Appliances Volume (Kilo Tons) and Revenue (US$ Mn) Forecast, 2016–2025
13.6. Rest of Europe Plastic Market for Electrical Appliances
14. Asia Pacific Plastics Market for Electrical Appliances Analysis Volume (Kilo Tons) and Revenue (US$ Mn) Forecast, 2016–2025
14.1. China Plastic Market for Electrical Appliances Volume (Kilo Tons) and Revenue (US$ Mn) Forecast, 2016–2025
14.2. Japan Plastic Market for Electrical Appliances Volume (Kilo Tons) and Revenue (US$ Mn) Forecast, 2016–2025
14.3. India Plastic Market for Electrical Appliances Volume (Kilo Tons) and Revenue (US$ Mn) Forecast, 2016–2025
14.4. Thailand Plastic Market for Electrical Appliances Volume (Kilo Tons) and Revenue (US$ Mn) Forecast, 2016–2025
14.5. Indonesia Plastic Market for Electrical Appliances Volume (Kilo Tons) and Revenue (US$ Mn) Forecast, 2016–2025
14.6. Vietnam Plastic Market for Electrical Appliances Volume (Kilo Tons) and Revenue (US$ Mn) Forecast, 2016–2025
14.7. Malaysia Plastic Market for Electrical Appliances Volume (Kilo Tons) and Revenue (US$ Mn) Forecast, 2016–2025
14.8. Philippines Plastic Market for Electrical Appliances Volume (Kilo Tons) and Revenue (US$ Mn) Forecast, 2016–2025
14.9. South Korea Plastic Market for Electrical Appliances Volume (Kilo Tons) and Revenue (US$ Mn) Forecast, 2016–2025
14.10. Rest of Asia Pacific Plastic Market for Electrical Appliances Volume (Kilo Tons) and Revenue (US$ Mn) Forecast, 2016–2025
15. Latin America Plastics Market for Electrical Appliances Analysis Volume (Kilo Tons) and Revenue (US$ Mn) Forecast, 2016–2025
15.1. Brazil Plastic Market for Electrical Appliances Volume (Kilo Tons) and Revenue (US$ Mn) Forecast, 2016–2025
15.2. Mexico Plastic Market for Electrical Appliances Volume (Kilo Tons) and Revenue (US$ Mn) Forecast, 2016–2025
15.3. Rest of Latin America Plastic Market for Electrical Appliances Volume (Kilo Tons) and Revenue (US$ Mn) Forecast, 2016–2025
16. Middle East & Africa Plastics Market for Electrical Appliances Analysis
16.1. GCC Plastic Market for Electrical Appliances Volume (Kilo Tons) and Revenue (US$ Mn) Forecast, 2016–2025
16.2. South Africa Plastic Market for Electrical Appliances Volume (Kilo Tons) and Revenue (US$ Mn) Forecast, 2016–2025
16.3. Rest of Middle East & Africa Plastic Market for Electrical Appliances Volume (Kilo Tons) and Revenue (US$ Mn) Forecast, 2016–2025
17. Competition Landscape
17.1. Company Market Share Analysis, by Major Resins (2016)
17.2. Competition Matrix
17.3. Company Profiles
17.3.1. LG Chem Ltd.
17.3.1.1. Company Description
17.3.1.2. Business Overview
17.3.1.3. Financial Details
17.3.1.4. Strategic Overview
17.3.2. BASF SE
17.3.2.1. Company Description
17.3.2.2. Business Overview
17.3.2.3. Financial Details
17.3.2.4. Strategic Overview
17.3.2.5. Product Details
17.3.3. Saudi Basic Industries Corporation (SABIC)
17.3.3.1. Company Description
17.3.3.2. Business Overview
17.3.3.3. Financial Details
17.3.3.4. Strategic Overview
17.3.3.5. Recent Developments
17.3.4. ExxonMobil Corporation
17.3.4.1. Company Description
17.3.4.2. Business Overview
17.3.4.3. Financial Details
17.3.4.4. Strategic Overview
17.3.5. LANXESS
17.3.5.1. Company Description
17.3.5.2. Business Overview
17.3.5.3. Financial Details
17.3.5.4. Strategic Overview
17.3.5.5. Product Details
17.3.6. INEOS Styrolution Group GmbH
17.3.6.1. Company Description
17.3.6.2. Business Overview
17.3.6.3. Financial Details
17.3.6.4. Strategic Overview
17.3.6.5. Product Details
17.3.7. Trinseo
17.3.7.1. Company Description
17.3.7.2. Business Overview
17.3.7.3. Financial Details
17.3.7.4. Strategic Overview
17.3.7.5. Product Details
17.3.7.6. Business Activities and Financial Overview
17.3.8. DuPont
17.3.8.1. Company Description
17.3.8.2. Business Overview
17.3.8.3. Financial Details
17.3.8.4. Strategic Overview
17.3.9. Covestro AG
17.3.9.1. Company Description
17.3.9.2. Business Overview
17.3.9.3. Financial Details
17.3.9.4. Strategic Overview
17.3.10. Toray Industries, Inc.
17.3.10.1. Company Description
17.3.10.2. Business Overview
17.3.10.3. Financial Details
17.3.10.4. Strategic Overview
17.3.11. LyondellBasell
17.3.11.1. Company Description
17.3.11.2. Business Overview
17.3.11.3. Financial Details
17.3.11.4. Strategic Overview
17.3.12. Asahi Kasei Corporation
17.3.12.1. Company Description
17.3.12.2. Business Overview
17.3.12.3. Financial Details
17.3.12.4. Strategic Overview
17.3.13. Mitsubishi Chemicals Corporation
17.3.13.1. Company Description
17.3.13.2. Business Overview
17.3.13.3. Product Details
17.3.14. Koninklijke DSM N.V.
17.3.14.1. Company Description
17.3.14.2. Business Overview
17.3.14.3. Financial Details
17.3.14.4. Strategic Overview
17.3.15. Reliance Industries Limited
17.3.15.1. Company Description
17.3.15.2. Business Overview
17.3.15.3. Financial Details
17.3.15.4. Strategic Overview
17.3.16. Eni S.p.A.
17.3.16.1. Company Description
17.3.16.2. Business Overview
17.3.16.3. Financial Details
17.3.16.4. Product Overview
17.3.17. IRPC Public
17.3.17.1. Company Description
17.3.17.2. Business Overview
17.3.17.3. Financial Details
17.3.18. SCG Chemicals
17.3.18.1. Company Description
17.3.18.2. Business Overview
17.3.18.3. Financial Details
17.3.18.4. Strategic Overview
17.3.18.5. Product Details
17.3.19. Petro Rabigh
17.3.19.1. Company Description
17.3.19.2. Business Overview
17.3.19.3. Financial Details
17.3.19.4. Strategic Overview
17.3.20. Formosa Plastics (Subsidiary of Formosa Plastics Group)
17.3.20.1. Company Description
17.3.20.2. Business Overview
17.3.21. Hanwha Total Petrochemical Co. Ltd.
17.3.21.1. Company Description
17.3.21.2. Business Overview
17.3.22. GS Caltex
17.3.22.1. Company Description
17.3.22.2. Business Overview
17.3.23. SK Chemicals
17.3.23.1. Company Description
17.3.23.2. Business Overview
18. Primary Research – Key Insights
List of Tables
Table 01: Price Range of plastics, by Resin, US$/KG, 2016–2025
Table 02: Price Comparison of Plastics, by Resin and Region, US$/Ton, 2016
Table 03: Global Plastics Import-Export Scenario (Tons), 2016, HS Code 390210 Polypropylene ‘PP’, in Primary Forms
Table 04: Global Plastics Import-Export Scenario (Tons), 2016, HS Code 390330, Acrylonitrile-butadiene-styrene copolymers ‘ABS’, in Primary Forms
Table 05: Global Plastics Import-Export Scenario (Tons), 2016, HS Code 390320, Styrene-acrylonitrile copolymers ‘SAN’, in Primary Forms
Table 06: Global Plastics Import-Export Scenario (Tons), 2016, HS Code 390319, Polystyrene ‘PS’, in Primary Forms (Excluding Expansible)
Table 07: Global Plastics Import-Export Scenario (Tons), 2016, HS Code 390410 Poly vinyl chloride ‘PVC’, in Primary Forms, Not Mixed with Any Other Substances
Table 08: Global Plastics Import-Export Scenario (Tons), 2016, HS Code 3908 Polyamides, in Primary Forms
Table 09: Global Plastics Market for Electrical Appliances Size (US$ Mn) & Volume (Kilo Tons) Forecast, by Resin, 2016–2025
Table 10: Global Plastics Market for Electrical Appliances Volume (Kilo Tons) Forecast, by Appliance, 2016–2025
Table 11: Global Plastics Market for Electrical Appliances Size (US$ Mn) Forecast, by Appliance, 2016–2025
Table 12: Global Plastics Market for Electrical Appliances Size (US$ Mn) & Volume (Kilo Tons) Forecast, by Region, 2016–2025
Table 13: Global Plastics Market for Electrical Appliances Size (US$ Mn) & Volume (Kilo Tons) Forecast, by Resin, 2016–2025
Table 14: Global Plastics Market for Electrical Appliances Volume (Kilo Tons) Forecast, by Appliance, 2016–2025
Table 15: Global Plastics Market for Electrical Appliances Size (US$ Mn) Forecast, by Appliance, 2016–2025
Table 16: North America Plastics Market for Electrical Appliances Size (US$ Mn) & Volume (Kilo Tons) Forecast, by Resin, 2016–2025
Table 17: North America Plastics Market for Electrical Appliances Volume (Kilo Tons) Forecast, by Appliance, 2016–2025
Table 18: North America Plastics Market for Electrical Appliances Size (US$ Mn) Forecast, by Appliance, 2016–2025
Table 19: North America Plastics Market for Electrical Appliances Size (US$ Mn) & Volume (Kilo Tons) Forecast, by Country, 2016–2025
Table 20: U.S. Plastics Market for Electrical Appliances Size (US$ Mn) & Volume (Kilo Tons) Forecast, by Resin, 2016–2025
Table 21: U.S. Plastics Market for Electrical Appliances Volume (Kilo Tons) Forecast, by Appliance, 2016–2025
Table 22: U.S. Plastics Market for Electrical Appliances Size (US$ Mn) Forecast, by Appliance, 2016–2025
Table 23: Canada Plastics Market for Electrical Appliances Size (US$ Mn) & Volume (Kilo Tons) Forecast, by Resin, 2016–2025
Table 24: Canada Plastics Market for Electrical Appliances Volume (Kilo Tons) Forecast, by Appliance, 2016–2025
Table 25: Canada Plastics Market for Electrical Appliances Size (US$ Mn) Forecast, by Appliance, 2016–2025
Table 26: Europe Plastics Market for Electrical Appliances Size (US$ Mn) & Volume (Kilo Tons) Forecast, by Resin, 2016–2025
Table 27: Europe Plastics Market for Electrical Appliances Volume (Kilo Tons) Forecast, by Appliance, 2016–2025
Table 28: Europe Plastics Market for Electrical Appliances Size (US$ Mn) Forecast, by Appliance, 2016–2025
Table 29: Europe Plastics Market for Electrical Appliances Size (US$ Mn) & Volume (Kilo Tons) Forecast, by Country, 2016–2025
Table 30: Germany Plastics Market for Electrical Appliances Size (US$ Mn) & Volume (Kilo Tons) Forecast, by Resin, 2016–2025
Table 31: Germany Plastics Market for Electrical Appliances Volume (Kilo Tons) Forecast, by Appliance, 2016–2025
Table 32: Germany Plastics Market for Electrical Appliances Size (US$ Mn) Forecast, by Appliance, 2016–2025
Table 33: France Plastics Market for Electrical Appliances Size (US$ Mn) & Volume (Kilo Tons) Forecast, by Resin, 2016–2025
Table 34: France Plastics Market for Electrical Appliances Volume (Kilo Tons) Forecast, by Appliance, 2016–2025
Table 35: France Plastics Market for Electrical Appliances Size (US$ Mn) Forecast, by Appliance, 2016–2025
Table 36: U.K. Plastics Market for Electrical Appliances Size (US$ Mn) & Volume (Kilo Tons) Forecast, by Resin, 2016–2025
Table 37: U.K. Plastics Market for Electrical Appliances Volume (Kilo Tons) Forecast, by Appliance, 2016–2025
Table 38: U.K. Plastics Market for Electrical Appliances Size (US$ Mn) Forecast, by Appliance, 2016–2025
Table 39: Italy Plastics Market for Electrical Appliances Size (US$ Mn) & Volume (Kilo Tons) Forecast, by Resin, 2016–2025
Table 40: Italy Plastics Market for Electrical Appliances Volume (Kilo Tons) Forecast, by Appliance, 2016–2025
Table 41: Italy Plastics Market for Electrical Appliances Size (US$ Mn) Forecast, by Appliance, 2016–2025
Table 42: Spain Plastics Market for Electrical Appliances Size (US$ Mn) & Volume (Kilo Tons) Forecast, by Resin, 2016–2025
Table 43: Spain Plastics Market for Electrical Appliances Volume (Kilo Tons) Forecast, by Appliance, 2016–2025
Table 44: Spain Plastics Market for Electrical Appliances Size (US$ Mn) Forecast, by Appliance, 2016–2025
Table 45: Rest of Europe Plastics Market for Electrical Appliances Size (US$ Mn) & Volume (Kilo Tons) Forecast, by Resin, 2016–2025
Table 46: Rest of Europe Plastics Market for Electrical Appliances Volume (Kilo Tons) Forecast, by Appliance, 2016–2025
Table 47: Rest of Europe Plastics Market for Electrical Appliances Size (US$ Mn) Forecast, by Appliance, 2016–2025
Table 48: Asia Pacific Plastics Market for Electrical Appliances Size (US$ Mn) & Volume (Kilo Tons) Forecast, by Resin, 2016–2025
Table 49: Asia Pacific Plastics Market for Electrical Appliances Volume (Kilo Tons) Forecast, by Appliance, 2016–2025
Table 50: Asia Pacific Plastics Market for Electrical Appliances Size (US$ Mn) Forecast, by Appliance, 2016–2025
Table 51: Asia Pacific Plastics Market for Electrical Appliances Volume (Kilo Tons) Forecast, by Country/Sub-region, 2016–2025
Table 52: Asia Pacific Plastics Market for Electrical Appliances Size (US$ Mn) Forecast, by Country/Sub-region, 2016–2025
Table 53: China Plastics Market for Electrical Appliances Size (US$ Mn) & Volume (Kilo Tons) Forecast, by Resin, 2016–2025
Table 54: China Plastics Market for Electrical Appliances Volume (Kilo Tons) Forecast, by Appliance, 2016–2025
Table 55: China Plastics Market for Electrical Appliances Size (US$ Mn) Forecast, by Appliance, 2016–2025
Table 56: Japan Plastics Market for Electrical Appliances Size (US$ Mn) & Volume (Kilo Tons) Forecast, by Resin, 2016–2025
Table 57: Japan Plastics Market for Electrical Appliances Volume (Kilo Tons) Forecast, by Appliance, 2016–2025
Table 58: Japan Plastics Market for Electrical Appliances Size (US$ Mn) Forecast, by Appliance, 2016–2025
Table 59: India Plastics Market for Electrical Appliances Size (US$ Mn) & Volume (Kilo Tons) Forecast, by Resin, 2016–2025
Table 60: India Plastics Market for Electrical Appliances Volume (Kilo Tons) Forecast, by Appliance, 2016–2025
Table 61: India Plastics Market for Electrical Appliances Size (US$ Mn) Forecast, by Appliance, 2016–2025
Table 62: Thailand Plastics Market for Electrical Appliances Size (US$ Mn) & Volume (Kilo Tons) Forecast, by Resin, 2016–2025
Table 63: Thailand Plastics Market for Electrical Appliances Volume (Kilo Tons) Forecast, by Appliance, 2016–2025
Table 64: Thailand Plastics Market for Electrical Appliances Size (US$ Mn) Forecast, by Appliance, 2016–2025
Table 65: Indonesia Plastics Market for Electrical Appliances Size (US$ Mn) & Volume (Kilo Tons) Forecast, by Resin, 2016–2025
Table 66: Indonesia Plastics Market for Electrical Appliances Volume (Kilo Tons) Forecast, by Appliance, 2016–2025
Table 67: Indonesia Plastics Market for Electrical Appliances Size (US$ Mn) Forecast, by Appliance, 2016–2025
Table 68: Vietnam Plastics Market for Electrical Appliances Size (US$ Mn) & Volume (Kilo Tons) Forecast, by Resin, 2016–2025
Table 69: Vietnam Plastics Market for Electrical Appliances Volume (Kilo Tons) Forecast, by Appliance, 2016–2025
Table 70: Vietnam Plastics Market for Electrical Appliances Size (US$ Mn) Forecast, by Appliance, 2016–2025
Table 71: Malaysia Plastics Market for Electrical Appliances Size (US$ Mn) & Volume (Kilo Tons) Forecast, by Resin, 2016–2025
Table 72: Malaysia Plastics Market for Electrical Appliances Volume (Kilo Tons) Forecast, by Appliance, 2016–2025
Table 73: Malaysia Plastics Market for Electrical Appliances Size (US$ Mn) Forecast, by Appliance, 2016–2025
Table 74: Philippines Plastics Market for Electrical Appliances Size (US$ Mn) & Volume (Kilo Tons) Forecast, by Resin, 2016–2025
Table 75: Philippines Plastics Market for Electrical Appliances Volume (Kilo Tons) Forecast, by Appliance, 2016–2025
Table 76: Philippines Plastics Market for Electrical Appliances Size (US$ Mn) Forecast, by Appliance, 2016–2025
Table 77: South Korea Plastics Market for Electrical Appliances Size (US$ Mn) & Volume (Kilo Tons) Forecast, by Resin, 2016–2025
Table 78: South Korea Plastics Market for Electrical Appliances Volume (Kilo Tons) Forecast, by Appliance, 2016–2025
Table 79: South Korea Plastics Market for Electrical Appliances Size (US$ Mn) Forecast, by Appliance, 2016–2025
Table 80: Rest of Asia Pacific Plastics Market for Electrical Appliances Size (US$ Mn) & Volume (Kilo Tons) Forecast, by Resin, 2016–2025
Table 81: Rest of Asia Pacific Plastics Market for Electrical Appliances Volume (Kilo Tons) Forecast, by Appliance, 2016–2025
Table 82: Rest of Asia Pacific Plastics Market for Electrical Appliances Size (US$ Mn) Forecast, by Appliance, 2016–2025
Table 83: Latin America Plastics Market for Electrical Appliances Size (US$ Mn) & Volume (Kilo Tons) Forecast, by Resin, 2016–2025
Table 84: Latin America Plastics Market for Electrical Appliances Volume (Kilo Tons) Forecast, by Appliance, 2016–2025
Table 85: Latin America Plastics Market for Electrical Appliances Size (US$ Mn) Forecast, by Appliance, 2016–2025
Table 86: Latin America Plastics Market for Electrical Appliances Size (US$ Mn) & Volume (Kilo Tons) Forecast, by Country/Sub-region, 2016–2025
Table 87: Brazil Plastics Market for Electrical Appliances Size (US$ Mn) & Volume (Kilo Tons) Forecast, by Resin, 2016–2025
Table 88: Brazil Plastics Market for Electrical Appliances Volume (Kilo Tons) Forecast, by Appliance, 2016–2025
Table 89: Brazil Plastics Market for Electrical Appliances Size (US$ Mn) Forecast, by Appliance, 2016–2025
Table 90: Mexico Plastics Market for Electrical Appliances Size (US$ Mn) & Volume (Kilo Tons) Forecast, by Resin, 2016–2025
Table 91: Rest of Latin America Plastics Market for Electrical Appliances Volume (Kilo Tons) Forecast, by Appliance, 2016–2025
Table 92: Mexico Plastics Market for Electrical Appliances Volume (Kilo Tons) Forecast, by Appliance, 2016–2025
Table 93: Mexico Plastics Market for Electrical Appliances Size (US$ Mn) Forecast, by Appliance, 2016–2025
Table 94: Rest of Latin America Plastics Market for Electrical Appliances Size (US$ Mn) & Volume (Kilo Tons) Forecast, by Resin, 2016–2025
Table 95: Rest of Latin America Plastics Market for Electrical Appliances Volume (Kilo Tons) Forecast, by Appliance, 2016–2025
Table 96: Rest of Latin America Plastics Market for Electrical Appliances Size (US$ Mn) Forecast, by Appliance, 2016–2025
Table 97: Middle East & Africa Plastics Market for Electrical Appliances Size (US$ Mn) & Volume (Kilo Tons) Forecast, by Resin, 2016–2025
Table 98: Middle East & Africa Plastics Market for Electrical Appliances Volume (Kilo Tons) Forecast, by Appliance, 2016–2025
Table 99: Middle East & Africa Plastics Market for Electrical Appliances Size (US$ Mn) Forecast, by Appliance, 2016–2025
Table 100: Middle East & Africa Plastics Market for Electrical Appliances Size (US$ Mn) & Volume (Kilo Tons) Forecast, by Country/Sub-region, 2016–2025
Table 101: GCC Plastics Market for Electrical Appliances Size (US$ Mn) & Volume (Kilo Tons) Forecast, by Resin, 2016–2025
Table 102: GCC Plastics Market for Electrical Appliances Volume (Kilo Tons) Forecast, by Appliance, 2016–2025
Table 103: GCC Plastics Market for Electrical Appliances Size (US$ Mn) Forecast, by Appliance, 2016–2025
Table 104: South Africa Plastics Market for Electrical Appliances Size (US$ Mn) & Volume (Kilo Tons) Forecast, by Resin, 2016–2025
Table 105: South Africa Plastics Market for Electrical Appliances Volume (Kilo Tons) Forecast, by Appliance, 2016–2025
Table 106: South Africa Plastics Market for Electrical Appliances Size (US$ Mn) Forecast, by Appliance, 2016–2025
Table 107: Rest of Middle East & Africa Plastics Market for Electrical Appliances Size (US$ Mn) & Volume (Kilo Tons) Forecast, by Resin, 2016–2025
Table 108: Rest of Middle East & Africa Plastics Market for Electrical Appliances Volume (Kilo Tons) Forecast, by Appliance, 2016–2025
Table 109: Rest of Middle East & Africa Plastics Market for Electrical Appliances Size (US$ Mn) Forecast, by Appliance, 2016–2025
List of Figures
Figure 01: Global Plastics Market for Electrical Appliances Volume Share, by Resin, 2016
Figure 02: Global Plastics Market for Electrical Appliances Volume Share, by Electrical Appliances, 2016
Figure 03: Global Plastics Market for Electrical Appliances Volume Share, by Region, 2016
Figure 04: Market Snapshot, Plastics Market for Electrical Appliances, by Resins, 2017 (E)
Figure 05: Market Snapshot, Plastics Market for Electrical Appliances, by Resins, 2025 (F)
Figure 06: Market Snapshot, Plastics Market for Electrical Appliances, by Electrical Appliances, 2017 (E)
Figure 07: Market Snapshot, Plastics Market for Electrical Appliances, by Electrical Appliances, 2025 (F)
Figure 08: World Production and Consumption of Electrical Appliances, by Region, 2016 (in Million Units)
Figure 09: World Production and Consumption of Electrical Appliances, by Appliances, 2016 (in Million Units)
Figure 10: Global Plastics Market for Electrical Appliances Volume (Kilo Tons) and Size (US$ Mn) Analysis, 2016–2025
Figure 11: Global Plastics Market for Electrical Appliances Size and Volume, Y-o-Y Growth Projection, 2016–2025
Figure 12: Price Comparison of Plastics, by Resin, US$/Ton, 2016
Figure 13: Price Comparison of Plastics, by Resin by Region, US$/Ton, 2016
Figure 14: Global Plastic Demand (Kilo Tons) for Electrical Appliance, by Resin vs. Region, 2016
Figure 15: Global Plastics Market for Electrical Appliances Market Volume Share Analysis, by Resin, 2016 and 2025
Figure 16: Global Plastic Demand (Kilo Tons) for Electrical Appliance, by Appliance vs. Resin, 2016
Figure 17: Global Plastics Market for Electrical Appliances Attractiveness Analysis, by Resin
Figure 18: Global Plastic Demand (Kilo Tons) for Electrical Appliance, by Appliance vs. Region, 2016
Figure 19: Global Plastics Market for Electrical Appliances Market Volume Share Analysis, by Appliances, 2016 and 2025
Figure 20: Global Plastics Market for Electrical Appliances Attractiveness Analysis, by Appliances
Figure 21: Global Plastics Market for Electrical Appliances Market Volume Share Analysis, by Region, 2016 and 2025
Figure 22: Global Plastics Market for Electrical Appliances Attractiveness Analysis, by Region
Figure 23: Global Market Attractiveness, by Resin
Figure 24: Global Market Attractiveness, by Appliance
Figure 25: Global Plastic Demand (Kilo Tons) for Electrical Appliance, by Appliance vs. Resin, 2016
Figure 26: North America Plastics Market for Electrical Appliances Market, Volume Share Analysis, by Resin, 2016 and 2025
Figure 27: North America Market for Electrical Appliances Market, Volume Share Analysis, by Appliance, 2016 and 2025
Figure 28: North America Market for Electrical Appliances Market, Volume Share Analysis, by Country, 2016 and 2025
Figure 29: North America Plastic Demand (Tons) for Electrical Appliance, by Appliance vs. Resin, 2016
Figure 30: U.S. Market Attractiveness, by Resin
Figure 31: U.S. Market Attractiveness, by Appliance
Figure 32: Canada Market Attractiveness, by Resin
Figure 33: Canada Market Attractiveness, by Appliance
Figure 34: Europe Plastics Market for Electrical Appliances Market Volume Share Analysis, by Resin, 2016 and 2025
Figure 35: Europe Plastics Market for Electrical Appliances Market Volume Share Analysis, by Appliance, 2016 and 2025
Figure 36: Europe Plastics Market for Electrical Appliances Market Volume Share Analysis, by Country, 2016 and 2025
Figure 37: Europe Plastic Demand (Kilo Tons) for Electrical Appliance, by Appliance vs Resin, 2016
Figure 38: Germany Market Attractiveness, by Resin
Figure 39: Germany Market Attractiveness, by Appliance
Figure 40: France Market Attractiveness, by Resin
Figure 41: France Market Attractiveness, by Appliance
Figure 42: U.K. Market Attractiveness, by Resin
Figure 43: U.K. Market Attractiveness, by Appliance
Figure 44: Italy Market Attractiveness, by Resin
Figure 45: Italy Market Attractiveness, by Appliance
Figure 46: Spain Market Attractiveness, by Resin
Figure 47: Spain Market Attractiveness, by Appliance
Figure 48: Rest of Europe Market Attractiveness, by Resin
Figure 49: Rest of Europe Market Attractiveness, by Appliance
Figure 50: Asia Pacific Plastics Market for Electrical Appliances Market Volume Share Analysis, by Resin, 2016 and 2025
Figure 51: Asia Pacific Plastics Market for Electrical Appliances Market Volume Share Analysis, by Appliance, 2016 and 2025
Figure 52: Asia Pacific Plastics Market for Electrical Appliances Market Volume Share Analysis, by Country/Sub-region, 2016 and 2025
Figure 53: Asia Pacific Plastic Demand (Kilo Tons) for Electrical Appliance, by Appliance by Resin, 2016
Figure 54: China Market Attractiveness, by Resin
Figure 55: China Market Attractiveness, by Appliance
Figure 56: Japan Market Attractiveness, by Resin
Figure 57: Japan Market Attractiveness, by Appliance
Figure 58: India Market Attractiveness, by Resin
Figure 59: India Market Attractiveness, by Appliance
Figure 60: Thailand Market Attractiveness, by Resin
Figure 61: Thailand Market Attractiveness, by Appliance
Figure 62: Indonesia Market Attractiveness, by Resin
Figure 63: Indonesia Market Attractiveness, by Appliance
Figure 64: Vietnam Market Attractiveness, by Resin
Figure 65: Vietnam Market Attractiveness, by Appliance
Figure 66: Malaysia Market Attractiveness, by Resin
Figure 67: Malaysia Market Attractiveness, by Appliance
Figure 68: Philippines Market Attractiveness, by Resin
Figure 69: Philippines Market Attractiveness, by Appliance
Figure 70: South Korea Market Attractiveness, by Resin
Figure 71: South Korea Market Attractiveness, by Appliance
Figure 72: Rest of Asia Pacific Market Attractiveness, by Resin
Figure 73: Rest of Asia Pacific Market Attractiveness, by Appliance
Figure 74: Latin America Plastics Market for Electrical Appliances Market Volume Share Analysis, by Resin, 2016 and 2025
Figure 75: Latin America Plastics Market for Electrical Appliances Market Volume Share Analysis, by Appliance, 2016 and 2025
Figure 76: Latin America Plastics Market for Electrical Appliances Market Volume Share Analysis, by Country/Sub-region, 2016 and 2025
Figure 77: Latin America Plastic Demand (Kilo Tons) for Electrical Appliance, by Appliance vs Resin, 2016
Figure 78: Brazil Market Attractiveness, by Resin
Figure 79: Brazil Market Attractiveness, by Appliance
Figure 80: Mexico Market Attractiveness, by Resin
Figure 81: Mexico Market Attractiveness, by Appliance
Figure 82: Rest of Latin America Market Attractiveness, by Resin
Figure 83: Rest of Latin America Market Attractiveness, by Appliance
Figure 84: Middle East & Africa Plastics Market for Electrical Appliances Market, Volume Share Analysis, by Resin, 2016 and 2025
Figure 85: Middle East & Africa Plastics Market for Electrical Appliances Market, Volume Share Analysis, by Appliance, 2016 and 2025
Figure 86: Middle East & Africa Plastics Market for Electrical Appliances Market, Volume Share Analysis, by Country, 2016 and 2025
Figure 87: Middle East & Africa Plastic Demand (Kilo Tons) for Electrical Appliance, by Appliance vs Resin, 2016
Figure 88: GCC Market Attractiveness, by Resin
Figure 89: GCC Market Attractiveness, by Appliance
Figure 90: South Africa Market Attractiveness, by Resin
Figure 91: South Africa Market Attractiveness, by Appliance
Figure 92: Rest of Middle East & Africa Market Attractiveness, by Resin
Figure 93: Rest of Middle East & Africa Market Attractiveness, by Appliance
Figure 94: Company Share Analysis for Polystyrene (2016)
Figure 95: Company Share Analysis for Polypropylene (2016)
Figure 96: Company Share Analysis for Polycarbonate (2016)
Figure 97: Company Share Analysis for PVC (2016)
Copyright © Transparency Market Research, Inc. All Rights reserved
Trust Online

Electrical Appliances Plastics Market