
Reports
Reports
Pistachios are seeds of pistachio tree, and have their origin in the Middle East and Central Asia. Pistachios are generally used as snacks and for food preparations by consumers globally. The seeds can be roasted or raw with seasoning for adding flavor. One of the commonly consumed nuts, pistachios are healthy, good in taste, and offer various health benefits, owing to their high antioxidant and low fat content, which in turn improves the immunity.
Pistachio Hulls to have Potential Applications in Nutraceuticals
According to researchers from North Carolina State University’s Plants for Human Health Institute, pistachio hulls represent a rich resource for value-added products, and have potential applications in drug industries and food supplements. The researchers have stated pistachio hulls to comprise a phytochemical composition with a blend of anacardic acid homologues, which are well-known for their anti-inflammatory, antioxidant activities, and pharmacological activities. This further creates potential opportunities for application of pistachio hulls in nutraceuticals. Presence of flavonoids and phenolics in pistachio hulls are higher as compared to several vegetables and fruits considered rich in polyphenols.
Prevalence of diseases on the back of unhealthy consumption patterns and ignorance of food safety has surged significantly across the globe. Consumers are now concentrating more on healthy eating habits for preventing health issues including food poisoning, high cholesterol, and obesity. Increasing awareness about presence of toxins in various food products owing to use of pesticides and chemical fertilizers in farming has resulted into a rise in demand for organic food products, may they be vegetables, fruits, or nuts. As pistachios are used in food processing industries, and are consumed as snacks, their organic variety is getting higher in demand. In addition, growing application of pistachios as flavoring agent will also propel their demand in the food & beverage sector. However, contamination by aflatoxin remains a major challenge impeding consumption of pistachios. Fungi produce aflatoxin that affect many tree nuts, and the production occurs at all stages of farming, or harvesting.
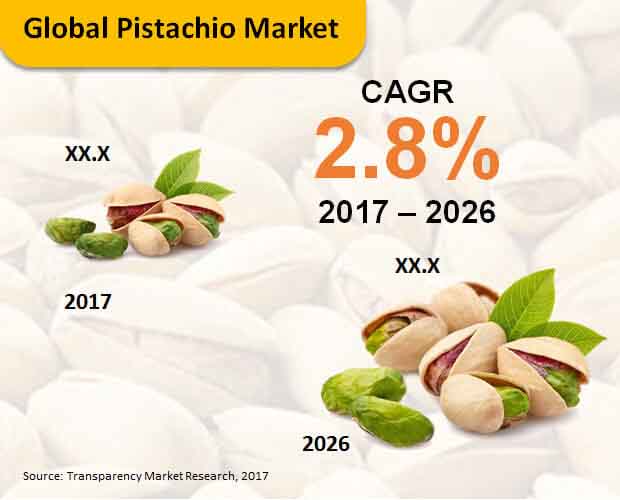
A new research analysis by Transparency Market Research (TMR) states that the global market for pistachios will witness a moderate expansion during the forecast period (2017-2026). Worldwide sales of pistachios are estimated to account for roughly US$ 5,000 Mn revenues by 2026-end.
Europe to Remain Leading Contributor to Global Pistachio Market’s Expansion in Terms of Revenues
Europe will continue to be the leading contributor to expansion of the global pistachio market, in terms of revenues. In Europe, pistachios are extensively used in bakery products such as cookies, biscuits, cakes, and pastries, for providing them with a distinguished flavor. Sales of pistachios in Europe will surpass US$ 1,500 Mn in revenues by 2026-end. North America and Asia-Pacific excluding Japan (APEJ) are also anticipated to remain remunerative for expansion of the pistachio market, mainly because of wide use of pistachios in food preparations in these regions.
Wholesaler/distributor display every variety and brand of pistachio, and deliver multiple options to choose from, which has gained increased interest of consumers. Based on distribution channels, wholesaler/distributor is anticipated to retain its dominance in the global pistachio market, followed by modern trade. Revenues from sales of pistachios in convenience stores will remain sluggish over the forecast period.
Key Takeaways from TMR’s Report on Pistachio Market
Competition Tracking
Key players profiled by TMR’s report, which are actively contributing to expansion of the global pistachio market, include Whistler Foods, Houston Pecan Company, Meridian Growers LLC, Sierra Nut House, Bates Nut Farm, Rasha Pistachio Co., Wonderful Pistachios & Almond Company LLC, Germack Pistachio Company, Setton Pistachio of Terra Bella, Inc., and The Pistachio Co Food Trading LLC.
High Fiber Content in Pistachio to Augment Growth of this Market
The name ‘Pistachio’ emerged from deciduous tree pistacia vera, having huge level of fat and rich wellspring of nutrient, carb, protein, magnesium, potassium, calcium and others, while utilized as enhancing specialist in pastry kitchen items and in numerous desserts, for example, frozen yogurt, refreshments and others. Pistachios are seeds derived from a pistachio tree, and have their starting point in the Central Asia and the Middle East. Pistachios are for the most part utilized as tidbits and for food arrangements by buyers internationally. The seeds can be simmered or crude with preparing for adding flavor. One of the normally devoured nuts, pistachios are solid, acceptable in taste, and offer different medical advantages, inferable from their high cancer prevention agent and low fat substance, which thus improves the insusceptibility.
The increasing applications in food enhancements and medication ventures have set out open doors sped up development in the worldwide pistachio market. According to late investigates, the phytochemical organization of pistachio frames with a mix of anacardic corrosive homologues have surprising enemy of oxidant and mitigating properties. This powers possibilities for the expanding utilization of pistachio frames in nutraceutical.
Pistachios are wealthy in fiber and consist of cell strengthening, and it helps in decreasing cholesterol levels, and furthermore controls sugar. These properties are tremendously pursued, which has fuelled the pistachio utilization essentially among type 2 diabetes patients. Likewise, pistachios additionally have high nutrient b^ content, with expands resistance levels. The rising information on benefits that can be acquired from the utilization of pistachio has thus empowered the market to acquire footing around the world. The rising number of wellbeing cognizant customers will consequently look good for the worldwide pistachio market.
Nowadays, pistachios are progressively utilized in assorted food items like treats for its interesting taste and inconspicuous quintessence. Moreover, they are utilized in bread kitchen items like treats, cakes, and rolls. Also, they have discovered application in food joints, eateries, and handling enterprises. With an expanding number of food makers enhancing pistachio seasoned items in a bid to benefit from their developing notoriety, the interest for pistachios is required to rise amazingly in the coming years.
Chapter 1 Global Business Outlook
Chapter 2 Global Pistachio Market - Executive Summary
Chapter 3 Global Pistachio Market Overview
3.1 Introduction
3.1.1 Global Pistachio Market Taxonomy
3.1.2 Global Pistachio Market Definition
3.2 Global Pistachio Market Size (US$ Mn) and Forecast, 2012-2026
3.2.1 Global Pistachio Market Y-o-Y Growth
3.3 Global Pistachio Market Dynamics
3.4 Regional Trends
3.5 Edible- Nuts Market Overview
3.6 Trade Analysis
3.7 Forecast Factors
3.8 PESTLE Analysis
3.9 Porter’s Five Force Analysis
3.10 Global Fair Trade
3.11 Supply Chain
3.12 List of Key Participants
3.13 List of Distributors
3.14 Regulatory Framework
3.15 Pricing Analysis
3.16 Key Participants Market Presence (Intensity Map) By Region
Chapter 4 Global Pistachio Market Analysis and Forecast 2012-2026
4.1 Global Pistachio Market Size and Forecast by Form, 2012-2026
4.1.1 Whole Market Size and Forecast, 2012-2026
4.1.1.1 Revenue (US$ Mn) Comparison, By Region
4.1.1.2 Market Share Comparison, By Region
4.1.1.3 Y-o-Y growth Comparison, By Region
4.1.2 Powdered Market Size and Forecast, 2012-2026
4.1.2.1 Revenue (US$ Mn) Comparison, By Region
4.1.2.2 Market Share Comparison, By Region
4.1.2.3 Y-o-Y growth Comparison, By Region
4.1.3 Roasted Market Size and Forecast, 2012-2026
4.1.3.1 Revenue (US$ Mn) Comparison, By Region
4.1.3.2 Market Share Comparison, By Region
4.1.3.3 Y-o-Y growth Comparison, By Region
4.1.4 Splits Market Size and Forecast, 2012-2026
4.1.4.1 Revenue (US$ Mn) Comparison, By Region
4.1.4.2 Market Share Comparison, By Region
4.1.4.3 Y-o-Y growth Comparison, By Region
4.2 Global Pistachio Market Size and Forecast by End-Use, 2012-2026
4.2.1 Bakery & Confectionery Market Size and Forecast, 2012-2026
4.2.1.1 Revenue (US$ Mn) Comparison, By Region
4.2.1.2 Market Share Comparison, By Region
4.2.1.3 Y-o-Y growth Comparison, By Region
4.2.2 Flavored Drink Market Size and Forecast, 2012-2026
4.2.2.1 Revenue (US$ Mn) Comparison, By Region
4.2.2.2 Market Share Comparison, By Region
4.2.2.3 Y-o-Y growth Comparison, By Region
4.2.3 Breakfast Cereals Market Size and Forecast, 2012-2026
4.2.3.1 Revenue (US$ Mn) Comparison, By Region
4.2.3.2 Market Share Comparison, By Region
4.2.3.3 Y-o-Y growth Comparison, By Region
4.2.4 Snacks Market Size and Forecast, 2012-2026
4.2.4.1 Revenue (US$ Mn) Comparison, By Region
4.2.4.2 Market Share Comparison, By Region
4.2.4.3 Y-o-Y growth Comparison, By Region
4.2.5 Butter & Spread Market Size and Forecast, 2012-2026
4.2.5.1 Revenue (US$ Mn) Comparison, By Region
4.2.5.2 Market Share Comparison, By Region
4.2.5.3 Y-o-Y growth Comparison, By Region
4.2.6 Dairy Products Market Size and Forecast, 2012-2026
4.2.6.1 Revenue (US$ Mn) Comparison, By Region
4.2.6.2 Market Share Comparison, By Region
4.2.6.3 Y-o-Y growth Comparison, By Region
4.2.7 Others Market Size and Forecast, 2012-2026
4.2.7.1 Revenue (US$ Mn) Comparison, By Region
4.2.7.2 Market Share Comparison, By Region
4.2.7.3 Y-o-Y growth Comparison, By Region
4.3 Global Pistachio Market Size and Forecast by Distribution Channel, 2012-2026
4.3.1 Whole seller/Distributor Market Size and Forecast, 2012-2026
4.3.1.1 Revenue (US$ Mn) Comparison, By Region
4.3.1.2 Market Share Comparison, By Region
4.3.1.3 Y-o-Y growth Comparison, By Region
4.3.2 Modern Trade Market Size and Forecast, 2012-2026
4.3.2.1 Revenue (US$ Mn) Comparison, By Region
4.3.2.2 Market Share Comparison, By Region
4.3.2.3 Y-o-Y growth Comparison, By Region
4.3.3 Convenience Stores Market Size and Forecast, 2012-2026
4.3.3.1 Revenue (US$ Mn) Comparison, By Region
4.3.3.2 Market Share Comparison, By Region
4.3.3.3 Y-o-Y growth Comparison, By Region
4.3.4 Online Sales Market Size and Forecast, 2012-2026
4.3.4.1 Revenue (US$ Mn) Comparison, By Region
4.3.4.2 Market Share Comparison, By Region
4.3.4.3 Y-o-Y growth Comparison, By Region
4.3.5 Other Sales Channel Market Size and Forecast, 2012-2026
4.3.5.1 Revenue (US$ Mn) Comparison, By Region
4.3.5.2 Market Share Comparison, By Region
4.3.5.3 Y-o-Y growth Comparison, By Region
Chapter 5 North America Pistachio Market Size and Forecast, 2012-2026
5.1 North America Market Outlook
5.2 North America Food & Beverage Market
5.3 Revenue (US$ Mn) Comparison, By Country
5.4 Revenue (US$ Mn) Comparison, By Form
5.5 Revenue (US$ Mn) Comparison, By End-Use
5.6 Revenue (US$ Mn) Comparison, By Distribution Channel
Chapter 6 Latin America Pistachio Market Size and Forecast, 2012-2026
6.1 Latin America Outlook
6.2 Latin America Food & Beverage Market
6.3 Revenue (US$ Mn) Comparison, By Country
6.4 Revenue (US$ Mn) Comparison, By Form
6.5 Revenue (US$ Mn) Comparison, By End-Use
6.6 Revenue (US$ Mn) Comparison, By Distribution Channel
Chapter 7 Europe Pistachio Market Size and Forecast, 2012-2026
7.1 Europe Outlook
7.2 Europe Food & Beverage Market
7.3 Revenue (US$ Mn) Comparison, By Country
7.4 Revenue (US$ Mn) Comparison, By Form
7.5 Revenue (US$ Mn) Comparison, By End-Use
7.6 Revenue (US$ Mn) Comparison, By Distribution Channel
Chapter 8 Japan Pistachio Market Size and Forecast, 2012-2026
8.1 Japan Outlook
8.2 Japan Food & Beverage Market
8.3 Revenue (US$ Mn) Comparison, By Country
8.4 Revenue (US$ Mn) Comparison, By Form
8.5 Revenue (US$ Mn) Comparison, By End-Use
8.6 Revenue (US$ Mn) Comparison, By Distribution Channel
Chapter 9 APEJ Pistachio Market Size and Forecast, 2012-2026
9.1 Asia Pacific Excluding Japan (APEJ) Outlook
9.2 Asia Pacific Excluding Japan (APEJ) Food & Beverage Market
9.3 Revenue (US$ Mn) Comparison, By Country
9.4 Revenue (US$ Mn) Comparison, By Form
9.5 Revenue (US$ Mn) Comparison, By End-Use
9.6 Revenue (US$ Mn) Comparison, By Distribution Channel
Chapter 10 MEA Pistachio Market Size and Forecast, 2012-2026
10.1 MEA Market Outlook
10.2 MEA Food & Beverage Market
10.3 Revenue (US$ Mn) Comparison, By Country
10.4 Revenue (US$ Mn) Comparison, By Form
10.5 Revenue (US$ Mn) Comparison, By End-Use
10.6 Revenue (US$ Mn) Comparison, By Distribution Channel
Chapter 11 Global Pistachio Market Company Share, Competition Landscape and Company Profiles
11.1 Global Pistachio Market Company Share Analysis
11.2 Global Pistachio Market Competition Landscape
11.3 Global Pistachio Market Company Profiles
11.3.1 Bates Nut Farm
11.3.1.1 Company Overview
11.3.1.2 Product Overview
11.3.2 Germack Pistachio Company
11.3.2.1 Company Overview
11.3.2.2 Product Overview
11.3.3 Houston Pecan Company
11.3.3.1 Company Overview
11.3.3.2 Product Overview
11.3.4 Meridian Growers LLC
11.3.4.1 Company Overview
11.3.4.2 Product Overview
11.3.5 Rasha Pistachio Co.
11.3.5.1 Company Overview
11.3.5.2 Product Overview
11.3.6 Setton Pistachio of Terra Bella, Inc.
11.3.6.1 Company Overview
11.3.6.2 Product Overview
11.3.7 Sierra Nut House
11.3.7.1 Company Overview
11.3.7.2 Product Overview
11.3.8 The Pistachio Co Food Trading LLC.
11.3.8.1 Company Overview
11.3.8.2 Product Overview
11.3.9 Whistler Foods
11.3.9.1 Company Overview
11.3.9.2 Product Overview
11.3.10 Wonderful Pistachios & Almond Company LLC
11.3.10.1 Company Overview
11.3.10.2 Product Overview
Chapter 12 TMR Research Methodology
Chapter 13 Disclaimer and Contact information
List of Tables
TABLE 1 Global Pistachio Market Value (US$ Mn), 2012-2017
TABLE 2 Global Pistachio Market Value (US$ Mn), 2018-2026
TABLE 3 Global Pistachio Market Value (US$ Mn) and Y-o-Y, 2017-2026
TABLE 4 Global Whole Segment Value (US$ Mn), By Region 2012-2017
TABLE 5 Global Whole Segment Value (US$ Mn), By Region 2018-2026
TABLE 6 Global Whole Segment Market Share, By Region 2012-2017
TABLE 7 Global Whole Segment Market Share, By Region 2018-2026
TABLE 8 Global Whole Segment Y-o-Y, By Region 2017-2026
TABLE 9 Global Powdered Segment Value (US$ Mn), By Region 2012-2017
TABLE 10 Global Powdered Segment Value (US$ Mn), By Region 2018-2026
TABLE 11 Global Powdered Segment Market Share, By Region 2012-2017
TABLE 12 Global Powdered Segment Market Share, By Region 2018-2026
TABLE 13 Global Powdered Segment Y-o-Y, By Region 2017-2026
TABLE 14 Global Roasted Segment Value (US$ Mn), By Region 2012-2017
TABLE 15 Global Roasted Segment Value (US$ Mn), By Region 2018-2026
TABLE 16 Global Roasted Segment Market Share, By Region 2012-2017
TABLE 17 Global Roasted Segment Market Share, By Region 2018-2026
TABLE 18 Global Roasted Segment Y-o-Y, By Region 2017-2026
TABLE 19 Global Splits Segment Value (US$ Mn), By Region 2012-2017
TABLE 20 Global Splits Segment Value (US$ Mn), By Region 2018-2026
TABLE 21 Global Splits Segment Market Share, By Region 2012-2017
TABLE 22 Global Splits Segment Market Share, By Region 2018-2026
TABLE 23 Global Splits Segment Y-o-Y, By Region 2017-2026
TABLE 24 Global Bakery & Confectionery Segment Value (US$ Mn), By Region 2012-2017
TABLE 25 Global Bakery & Confectionery Segment Value (US$ Mn), By Region 2018-2026
TABLE 26 Global Bakery & Confectionery Segment Market Share, By Region 2012-2017
TABLE 27 Global Bakery & Confectionery Segment Market Share, By Region 2018-2026
TABLE 28 Global Bakery & Confectionery Segment Y-o-Y, By Region 2017-2026
TABLE 29 Global Flavored Drink Segment Value (US$ Mn), By Region 2012-2017
TABLE 30 Global Flavored Drink Segment Value (US$ Mn), By Region 2018-2026
TABLE 31 Global Flavored Drink Segment Market Share, By Region 2012-2017
TABLE 32 Global Flavored Drink Segment Market Share, By Region 2018-2026
TABLE 33 Global Flavored Drink Segment Y-o-Y, By Region 2017-2026
TABLE 34 Global Breakfast Cereals Segment Value (US$ Mn), By Region 2012-2017
TABLE 35 Global Breakfast Cereals Segment Value (US$ Mn), By Region 2018-2026
TABLE 36 Global Breakfast Cereals Segment Market Share, By Region 2012-2017
TABLE 37 Global Breakfast Cereals Segment Market Share, By Region 2018-2026
TABLE 38 Global Breakfast Cereals Segment Y-o-Y, By Region 2017-2026
TABLE 39 Global Snacks Segment Value (US$ Mn), By Region 2012-2017
TABLE 40 Global Snacks Segment Value (US$ Mn), By Region 2018-2026
TABLE 41 Global Snacks Segment Market Share, By Region 2012-2017
TABLE 42 Global Snacks Segment Market Share, By Region 2018-2026
TABLE 43 Global Snacks Segment Y-o-Y, By Region 2017-2026
TABLE 44 Global Butter & Spread Segment Value (US$ Mn), By Region 2012-2017
TABLE 45 Global Butter & Spread Segment Value (US$ Mn), By Region 2018-2026
TABLE 46 Global Butter & Spread Segment Market Share, By Region 2012-2017
TABLE 47 Global Butter & Spread Segment Market Share, By Region 2018-2026
TABLE 48 Global Butter & Spread Segment Y-o-Y, By Region 2017-2026
TABLE 49 Global Dairy Products Segment Value (US$ Mn), By Region 2012-2017
TABLE 50 Global Dairy Products Segment Value (US$ Mn), By Region 2018-2026
TABLE 51 Global Dairy Products Segment Market Share, By Region 2012-2017
TABLE 52 Global Dairy Products Segment Market Share, By Region 2018-2026
TABLE 53 Global Dairy Products Segment Y-o-Y, By Region 2017-2026
TABLE 54 Global Others Segment Value (US$ Mn), By Region 2012-2017
TABLE 55 Global Others Segment Value (US$ Mn), By Region 2018-2026
TABLE 56 Global Others Segment Market Share, By Region 2012-2017
TABLE 57 Global Others Segment Market Share, By Region 2018-2026
TABLE 58 Global Others Segment Y-o-Y, By Region 2017-2026
TABLE 59 Global Whole seller/Distributor Segment Value (US$ Mn), By Region 2012-2017
TABLE 60 Global Whole seller/Distributor Segment Value (US$ Mn), By Region 2018-2026
TABLE 61 Global Whole seller/Distributor Segment Market Share, By Region 2012-2017
TABLE 62 Global Whole seller/Distributor Segment Market Share, By Region 2018-2026
TABLE 63 Global Whole seller/Distributor Segment Y-o-Y, By Region 2017-2026
TABLE 64 Global Modern Trade Segment Value (US$ Mn), By Region 2012-2017
TABLE 65 Global Modern Trade Segment Value (US$ Mn), By Region 2018-2026
TABLE 66 Global Modern Trade Segment Market Share, By Region 2012-2017
TABLE 67 Global Modern Trade Segment Market Share, By Region 2018-2026
TABLE 68 Global Modern Trade Segment Y-o-Y, By Region 2017-2026
TABLE 69 Global Convenience Stores Segment Value (US$ Mn), By Region 2012-2017
TABLE 70 Global Convenience Stores Segment Value (US$ Mn), By Region 2018-2026
TABLE 71 Global Convenience Stores Segment Market Share, By Region 2012-2017
TABLE 72 Global Convenience Stores Segment Market Share, By Region 2018-2026
TABLE 73 Global Convenience Stores Segment Y-o-Y, By Region 2017-2026
TABLE 74 Global Online Sales Segment Value (US$ Mn), By Region 2012-2017
TABLE 75 Global Online Sales Segment Value (US$ Mn), By Region 2018-2026
TABLE 76 Global Online Sales Segment Market Share, By Region 2012-2017
TABLE 77 Global Online Sales Segment Market Share, By Region 2018-2026
TABLE 78 Global Online Sales Segment Y-o-Y, By Region 2017-2026
TABLE 79 Global Other Sales Channel Segment Value (US$ Mn), By Region 2012-2017
TABLE 80 Global Other Sales Channel Segment Value (US$ Mn), By Region 2018-2026
TABLE 81 Global Other Sales Channel Segment Market Share, By Region 2012-2017
TABLE 82 Global Other Sales Channel Segment Market Share, By Region 2018-2026
TABLE 83 Global Other Sales Channel Segment Y-o-Y, By Region 2017-2026
TABLE 84 North America Pistachio Market Value (US$ Mn), By Country 2012-2017
TABLE 85 North America Pistachio Market Value (US$ Mn), By Country 2018-2026
TABLE 86 North America Pistachio Market Value (US$ Mn), By Form 2012-2017
TABLE 87 North America Pistachio Market Value (US$ Mn), By Form 2018-2026
TABLE 88 North America Pistachio Market Value (US$ Mn), By End-Use 2012-2017
TABLE 89 North America Pistachio Market Value (US$ Mn), By End-Use 2018-2026
TABLE 90 North America Pistachio Market Value (US$ Mn), By Distribution Channel 2012-2017
TABLE 91 North America Pistachio Market Value (US$ Mn), By Distribution Channel 2018-2026
TABLE 92 Latin America Pistachio Market Value (US$ Mn), By Country 2012-2017
TABLE 93 Latin America Pistachio Market Value (US$ Mn), By Country 2018-2026
TABLE 94 Latin America Pistachio Market Value (US$ Mn), By Form 2012-2017
TABLE 95 Latin America Pistachio Market Value (US$ Mn), By Form 2018-2026
TABLE 96 Latin America Pistachio Market Value (US$ Mn), By End-Use 2012-2017
TABLE 97 Latin America Pistachio Market Value (US$ Mn), By End-Use 2018-2026
TABLE 98 Latin America Pistachio Market Value (US$ Mn), By Distribution Channel 2012-2017
TABLE 99 Latin America Pistachio Market Value (US$ Mn), By Distribution Channel 2018-2026
TABLE 100 Europe Pistachio Market Value (US$ Mn), By Country 2012-2017
TABLE 101 Europe Pistachio Market Value (US$ Mn), By Country 2018-2026
TABLE 102 Europe Pistachio Market Value (US$ Mn), By Form 2012-2017
TABLE 103 Europe Pistachio Market Value (US$ Mn), By Form 2018-2026
TABLE 104 Europe Pistachio Market Value (US$ Mn), By End-Use 2012-2017
TABLE 105 Europe Pistachio Market Value (US$ Mn), By End-Use 2018-2026
TABLE 106 Europe Pistachio Market Value (US$ Mn), By Distribution Channel 2012-2017
TABLE 107 Europe Pistachio Market Value (US$ Mn), By Distribution Channel 2018-2026
TABLE 108 Japan Pistachio Market Value (US$ Mn), By Country 2012-2017
TABLE 109 Japan Pistachio Market Value (US$ Mn), By Country 2018-2026
TABLE 110 Japan Pistachio Market Value (US$ Mn), By Form 2012-2017
TABLE 111 Japan Pistachio Market Value (US$ Mn), By Form 2018-2026
TABLE 112 Japan Pistachio Market Value (US$ Mn), By End-Use 2012-2017
TABLE 113 Japan Pistachio Market Value (US$ Mn), By End-Use 2018-2026
TABLE 114 Japan Pistachio Market Value (US$ Mn), By Distribution Channel 2012-2017
TABLE 115 Japan Pistachio Market Value (US$ Mn), By Distribution Channel 2018-2026
TABLE 116 APEJ Pistachio Market Value (US$ Mn), By Country 2012-2017
TABLE 117 APEJ Pistachio Market Value (US$ Mn), By Country 2018-2026
TABLE 118 APEJ Pistachio Market Value (US$ Mn), By Form 2012-2017
TABLE 119 APEJ Pistachio Market Value (US$ Mn), By Form 2018-2026
TABLE 120 APEJ Pistachio Market Value (US$ Mn), By End-Use 2012-2017
TABLE 121 APEJ Pistachio Market Value (US$ Mn), By End-Use 2018-2026
TABLE 122 APEJ Pistachio Market Value (US$ Mn), By Distribution Channel 2012-2017
TABLE 123 APEJ Pistachio Market Value (US$ Mn), By Distribution Channel 2018-2026
TABLE 124 MEA Pistachio Market Value (US$ Mn), By Country 2012-2017
TABLE 125 MEA Pistachio Market Value (US$ Mn), By Country 2018-2026
TABLE 126 MEA Pistachio Market Value (US$ Mn), By Form 2012-2017
TABLE 127 MEA Pistachio Market Value (US$ Mn), By Form 2018-2026
TABLE 128 MEA Pistachio Market Value (US$ Mn), By End-Use 2012-2017
TABLE 129 MEA Pistachio Market Value (US$ Mn), By End-Use 2018-2026
TABLE 130 MEA Pistachio Market Value (US$ Mn), By Distribution Channel 2012-2017
TABLE 131 MEA Pistachio Market Value (US$ Mn), By Distribution Channel 2018-2026
List of Figures
FIG. 1 Global Pistachio Market Value (US$ Mn), 2012-2017
FIG. 2 Global Pistachio Market Value (US$ Mn) Forecast, 2018-2026
FIG. 3 Global Pistachio Market Value (US$ Mn) and Y-o-Y, 2017-2026
FIG. 4 Global Whole Segment Market Value (US$ Mn) By Region, 2012-2017
FIG. 5 Global Whole Segment Market Value (US$ Mn) By Region, 2018-2026
FIG. 6 Global Whole Segment Y-o-Y Growth Rate, By Region, 2017-2026
FIG. 7 Global Powdered Segment Market Value (US$ Mn) By Region, 2012-2017
FIG. 8 Global Powdered Segment Market Value (US$ Mn) By Region, 2018-2026
FIG. 9 Global Powdered Segment Y-o-Y Growth Rate, By Region, 2017-2026
FIG. 10 Global Roasted Segment Market Value (US$ Mn) By Region, 2012-2017
FIG. 11 Global Roasted Segment Market Value (US$ Mn) By Region, 2018-2026
FIG. 12 Global Roasted Segment Y-o-Y Growth Rate, By Region, 2017-2026
FIG. 13 Global Splits Segment Market Value (US$ Mn) By Region, 2012-2017
FIG. 14 Global Splits Segment Market Value (US$ Mn) By Region, 2018-2026
FIG. 15 Global Splits Segment Y-o-Y Growth Rate, By Region, 2017-2026
FIG. 16 Global Bakery & Confectionery Segment Market Value (US$ Mn) By Region, 2012-2017
FIG. 17 Global Bakery & Confectionery Segment Market Value (US$ Mn) By Region, 2018-2026
FIG. 18 Global Bakery & Confectionery Segment Y-o-Y Growth Rate, By Region, 2017-2026
FIG. 19 Global Flavored Drink Segment Market Value (US$ Mn) By Region, 2012-2017
FIG. 20 Global Flavored Drink Segment Market Value (US$ Mn) By Region, 2018-2026
FIG. 21 Global Flavored Drink Segment Y-o-Y Growth Rate, By Region, 2017-2026
FIG. 22 Global Breakfast Cereals Segment Market Value (US$ Mn) By Region, 2012-2017
FIG. 23 Global Breakfast Cereals Segment Market Value (US$ Mn) By Region, 2018-2026
FIG. 24 Global Breakfast Cereals Segment Y-o-Y Growth Rate, By Region, 2017-2026
FIG. 25 Global Snacks Segment Market Value (US$ Mn) By Region, 2012-2017
FIG. 26 Global Snacks Segment Market Value (US$ Mn) By Region, 2018-2026
FIG. 27 Global Snacks Segment Y-o-Y Growth Rate, By Region, 2017-2026
FIG. 28 Global Butter & Spread Segment Market Value (US$ Mn) By Region, 2012-2017
FIG. 29 Global Butter & Spread Segment Market Value (US$ Mn) By Region, 2018-2026
FIG. 30 Global Butter & Spread Segment Y-o-Y Growth Rate, By Region, 2017-2026
FIG. 31 Global Dairy Products Segment Market Value (US$ Mn) By Region, 2012-2017
FIG. 32 Global Dairy Products Segment Market Value (US$ Mn) By Region, 2018-2026
FIG. 33 Global Dairy Products Segment Y-o-Y Growth Rate, By Region, 2017-2026
FIG. 34 Global Others Segment Market Value (US$ Mn) By Region, 2012-2017
FIG. 35 Global Others Segment Market Value (US$ Mn) By Region, 2018-2026
FIG. 36 Global Others Segment Y-o-Y Growth Rate, By Region, 2017-2026
FIG. 37 Global Whole seller/Distributor Segment Market Value (US$ Mn) By Region, 2012-2017
FIG. 38 Global Whole seller/Distributor Segment Market Value (US$ Mn) By Region, 2018-2026
FIG. 39 Global Whole seller/Distributor Segment Y-o-Y Growth Rate, By Region, 2017-2026
FIG. 40 Global Modern Trade Segment Market Value (US$ Mn) By Region, 2012-2017
FIG. 41 Global Modern Trade Segment Market Value (US$ Mn) By Region, 2018-2026
FIG. 42 Global Modern Trade Segment Y-o-Y Growth Rate, By Region, 2017-2026
FIG. 43 Global Convenience Stores Segment Market Value (US$ Mn) By Region, 2012-2017
FIG. 44 Global Convenience Stores Segment Market Value (US$ Mn) By Region, 2018-2026
FIG. 45 Global Convenience Stores Segment Y-o-Y Growth Rate, By Region, 2017-2026
FIG. 46 Global Online Sales Segment Market Value (US$ Mn) By Region, 2012-2017
FIG. 47 Global Online Sales Segment Market Value (US$ Mn) By Region, 2018-2026
FIG. 48 Global Online Sales Segment Y-o-Y Growth Rate, By Region, 2017-2026
FIG. 49 Global Other Sales Channel Segment Market Value (US$ Mn) By Region, 2012-2017
FIG. 50 Global Other Sales Channel Segment Market Value (US$ Mn) By Region, 2018-2026
FIG. 51 Global Other Sales Channel Segment Y-o-Y Growth Rate, By Region, 2017-2026
FIG. 52 North America Pistachio Market Value (US$ Mn), By Country 2012-2017
FIG. 53 North America Pistachio Market Value (US$ Mn), By Country 2018-2026
FIG. 54 North America Pistachio Market Value (US$ Mn), By Form 2012-2017
FIG. 55 North America Pistachio Market Value (US$ Mn), By Form 2018-2026
FIG. 56 North America Pistachio Market Value (US$ Mn), By End-Use 2012-2017
FIG. 57 North America Pistachio Market Value (US$ Mn), By End-Use 2018-2026
FIG. 58 North America Pistachio Market Value (US$ Mn), By Distribution Channel 2012-2017
FIG. 59 North America Pistachio Market Value (US$ Mn), By Distribution Channel 2018-2026
FIG. 60 Latin America Pistachio Market Value (US$ Mn), By Country 2012-2017
FIG. 61 Latin America Pistachio Market Value (US$ Mn), By Country 2018-2026
FIG. 62 Latin America Pistachio Market Value (US$ Mn), By Form 2012-2017
FIG. 63 Latin America Pistachio Market Value (US$ Mn), By Form 2018-2026
FIG. 64 Latin America Pistachio Market Value (US$ Mn), By End-Use 2012-2017
FIG. 65 Latin America Pistachio Market Value (US$ Mn), By End-Use 2018-2026
FIG. 66 Latin America Pistachio Market Value (US$ Mn), By Distribution Channel 2012-2017
FIG. 67 Latin America Pistachio Market Value (US$ Mn), By Distribution Channel 2018-2026
FIG. 68 Europe Pistachio Market Value (US$ Mn), By Country 2012-2017
FIG. 69 Europe Pistachio Market Value (US$ Mn), By Country 2018-2026
FIG. 70 Europe Pistachio Market Value (US$ Mn), By Form 2012-2017
FIG. 71 Europe Pistachio Market Value (US$ Mn), By Form 2018-2026
FIG. 72 Europe Pistachio Market Value (US$ Mn), By End-Use 2012-2017
FIG. 73 Europe Pistachio Market Value (US$ Mn), By End-Use 2018-2026
FIG. 74 Europe Pistachio Market Value (US$ Mn), By Distribution Channel 2012-2017
FIG. 75 Europe Pistachio Market Value (US$ Mn), By Distribution Channel 2018-2026
FIG. 76 Japan Pistachio Market Value (US$ Mn), By Country 2012-2017
FIG. 77 Japan Pistachio Market Value (US$ Mn), By Country 2018-2026
FIG. 78 Japan Pistachio Market Value (US$ Mn), By Form 2012-2017
FIG. 79 Japan Pistachio Market Value (US$ Mn), By Form 2018-2026
FIG. 80 Japan Pistachio Market Value (US$ Mn), By Distribution Channel 2012-2017
FIG. 81 Japan Pistachio Market Value (US$ Mn), By End-Use 2018-2026
FIG. 82 Japan Pistachio Market Value (US$ Mn), By Distribution Channel 2012-2017
FIG. 83 Japan Pistachio Market Value (US$ Mn), By Distribution Channel 2018-2026
FIG. 84 APEJ Pistachio Market Value (US$ Mn), By Country 2012-2017
FIG. 85 APEJ Pistachio Market Value (US$ Mn), By Country 2018-2026
FIG. 86 APEJ Pistachio Market Value (US$ Mn), By Form 2012-2017
FIG. 87 APEJ Pistachio Market Value (US$ Mn), By Form 2018-2026
FIG. 88 APEJ Pistachio Market Value (US$ Mn), By End-Use 2012-2017
FIG. 89 APEJ Pistachio Market Value (US$ Mn), By End-Use 2018-2026
FIG. 90 APEJ Pistachio Market Value (US$ Mn), By Distribution Channel 2012-2017
FIG. 91 APEJ Pistachio Market Value (US$ Mn), By Distribution Channel 2018-2026
FIG. 92 MEA Pistachio Market Value (US$ Mn), By Country 2012-2017
FIG. 93 MEA Pistachio Market Value (US$ Mn), By Country 2018-2026
FIG. 94 MEA Pistachio Market Value (US$ Mn), By Form 2012-2017
FIG. 95 MEA Pistachio Market Value (US$ Mn), By Form 2018-2026
FIG. 96 MEA Pistachio Market Value (US$ Mn), By End-Use 2012-2017
FIG. 97 MEA Pistachio Market Value (US$ Mn), By End-Use 2018-2026
FIG. 98 MEA Pistachio Market Value (US$ Mn), By Distribution Channel 2012-2017
FIG. 99 MEA Pistachio Market Value (US$ Mn), By Distribution Channel 2018-2026
Copyright © Transparency Market Research, Inc. All Rights reserved
Trust Online

Pistachio Market