
Reports
Reports
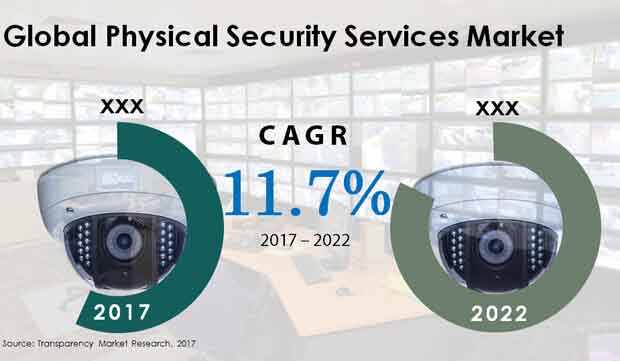
Global Physical Security Services Market: Snapshot
The global physical security services market is expected to be influenced by the swelling implementation of automobile tracking and other smart technologies and internet of things (IoT). However, a major chuck of the demand for physical security services could be driven by increasing terror attacks on humans as well as physical properties. Physical security is considered as a vital measure to protect against the surging incidences of terror attacks. Organizations of all sizes and across several regions of the globe are implementing security strategies at a rapid rate. Technological development in the industry and stringent government norms could be key factors enlarging the growth of the market.
The global physical security services market is predicted to rise at a CAGR of 11.7% during the forecast period 2017–2022. By 2022, the market could draw a valuation of US$191.7 bn. In 2017, a valuation of US$110.3 bn was recorded by the market.
Market to Honor ACaaS as Leader in Revenue Growth throughout 2022
According to the analysis of expert researchers, the world physical security services market is prognosticated to be segregated as per type and vertical segmentation. By type, the market could be classified into four key segments, viz. security system integration, remote monitoring services, access control as a service (ACaaS), and video surveillance as a service (VSaaS). Amongst these, ACaaS could post a dominating revenue of US$80.9 bn by the end of 2022.
By vertical, the world physical security services market is envisioned to be divided into several segments such as banking, financial services, and insurance (BFSI), education, healthcare, government, manufacturing, retail, residential, transportation, utilities and energy, and commercial.
Each segment analyzed in the report is studied in-depth in order to provide the best of information to buyers so that they become well-equipped to take important decisions in their individual businesses.
North America to Spearhead Market Growth with Sweeping Revenue Share
On the basis of geography, the international physical security services market is prophesied to be segmented into five vital regions and one country, i.e. North America, Europe, Latin America, the Middle East and Africa (MEA), Asia Pacific except Japan (APEJ), and Japan. The analysts foretell the market of North America to top revenue share in 2017 and also 2022 while expanding at a 12.6% CAGR. The region could even become one of the most lucrative markets for physical security services over the course of the forecast timeframe.
Japan and the MEA are forecasted to be among the slow-moving markets as they could lose 139 BPS and 59 BPS respectively in their share by the concluding forecast year. However, APEJ is anticipated to gain 225 BPS in its share by the same year. Europe could create an absolute revenue prospect of US$13.7 bn between 2017 and 2022.
The publication presented herewith offers an exhaustive study of the vendor landscape of the worldwide physical security services market with crucial players profiled, including Tyco International Limited, The ADT Corp., SECOM Company Limited, STANLEY Convergent Security Solutions, Inc., and United Technologies Corporation.
Increased Adoption of Unmanned Guarding Services Boosts Sales Opportunities in Physical Security Services Market
Physical security refers to the protection of physical assets, people, and property from activities and events that can lead to loss or damage. In recent period, physical security services are widely utilized as an important measure to gain protection against the increased cases of terror attacks. Thus, many large as well as small-sized organizations across the globe are growing inclination toward opting the physical security services. In addition to this, many government organizations from all across the globe are growing the adoption of physical security services. This factor is generating promising sales opportunities for vendors working in the global physical security services market.
Physical security services are in high demand in various smart cities, which are largely controlled by internet of things (IoT) and information and communication technology (ICT). Thus, considerable growth in the number of smart cities in all worldwide locations is expected to generate lucrative avenues in the global physical security services market.
Many companies in the global physical security services market are growing focus toward incorporation of technological advancements. They are experiencing considerable growth in adoption of unmanned guarding as well as area under surveillance services. One of the key factors driving this adoption is the ability of unmanned guarding services to curb the labor costs offer superior quality of security.
Recent COVID-19 pandemic has impacted adversely on the growth of the global physical security services market. Many players in the market for physical security services are experiencing declined sales and thereby reduced revenues number in recent few months following the onset on pandemic. Thus, analysts predict that the physical security services market is likely to experience downward growth curve for short period but it will show fast recovery owing to growing efforts of market players to regain their regular activities.
1. Global Physical Security Services Market - Executive Summary
2. Global Physical Security Services Market Overview
2.1. Introduction
2.1.1. Global Physical Security Services Market Taxonomy
2.1.2. Global Physical Security Services Market Definition
2.2. Global Physical Security Services Market Size (US$ Mn) and Forecast, 2012-2022
2.2.1. Global Physical Security Services Market Y-o-Y Growth
2.3. Global Physical Security Services Market Dynamics
2.4. Cost Structure Analysis
2.5. Value Chain Assessment and Profitability Margins
2.6. Region Wise Market Positioning Assessment
2.7. Key Participants Market Presence (Intensity Map) By Region
3. Global Physical Security Services Market Analysis and Forecast By Service Type
3.1. Global Physical Security Services Market Size and Forecast By Service Type, 2012-2022
3.1.1. VSaaS Physical Security Services Market Size and Forecast, 2012-2022
3.1.1.1. Revenue (US$ Mn) Comparison, By Region
3.1.1.2. Market Share Comparison, By Region
3.1.1.3. Y-o-Y growth Comparison, By Region
3.1.2. ACaaS Physical Security Services Market Size and Forecast, 2012-2022
3.1.2.1. Revenue (US$ Mn) Comparison, By Region
3.1.2.2. Market Share Comparison, By Region
3.1.2.3. Y-o-Y growth Comparison, By Region
3.1.3. Remote Monitoring Services Physical Security Services Market Size and Forecast, 2012-2022
3.1.3.1. Revenue (US$ Mn) Comparison, By Region
3.1.3.2. Market Share Comparison, By Region
3.1.3.3. Y-o-Y growth Comparison, By Region
3.1.4. Security System Integration Physical Security Services Market Size and Forecast, 2012-2022
3.1.4.1. Revenue (US$ Mn) Comparison, By Region
3.1.4.2. Market Share Comparison, By Region
3.1.4.3. Y-o-Y growth Comparison, By Region
4. Global Physical Security Services Market Analysis and Forecast By Vertical
4.1. Global Physical Security Services Market Size and Forecast By Vertical, 2012-2022
4.1.1. BFSI Physical Security Services Market Size and Forecast, 2012-2022
4.1.1.1. Revenue (US$ Mn) Comparison, By Region
4.1.1.2. Market Share Comparison, By Region
4.1.1.3. Y-o-Y growth Comparison, By Region
4.1.2. Education Physical Security Services Market Size and Forecast, 2012-2022
4.1.2.1. Revenue (US$ Mn) Comparison, By Region
4.1.2.2. Market Share Comparison, By Region
4.1.2.3. Y-o-Y growth Comparison, By Region
4.1.3. Healthcare Physical Security Services Market Size and Forecast, 2012-2022
4.1.3.1. Revenue (US$ Mn) Comparison, By Region
4.1.3.2. Market Share Comparison, By Region
4.1.3.3. Y-o-Y growth Comparison, By Region
4.1.4. Government Physical Security Services Market Size and Forecast, 2012-2022
4.1.4.1. Revenue (US$ Mn) Comparison, By Region
4.1.4.2. Market Share Comparison, By Region
4.1.4.3. Y-o-Y growth Comparison, By Region
4.1.5. Manufacturing Physical Security Services Market Size and Forecast, 2012-2022
4.1.5.1. Revenue (US$ Mn) Comparison, By Region
4.1.5.2. Market Share Comparison, By Region
4.1.5.3. Y-o-Y growth Comparison, By Region
4.1.6. Retail Physical Security Services Market Size and Forecast, 2012-2022
4.1.6.1. Revenue (US$ Mn) Comparison, By Region
4.1.6.2. Market Share Comparison, By Region
4.1.6.3. Y-o-Y growth Comparison, By Region
4.1.7. Residential Physical Security Services Market Size and Forecast, 2012-2022
4.1.7.1. Revenue (US$ Mn) Comparison, By Region
4.1.7.2. Market Share Comparison, By Region
4.1.7.3. Y-o-Y growth Comparison, By Region
4.1.8. Transportation Physical Security Services Market Size and Forecast, 2012-2022
4.1.8.1. Revenue (US$ Mn) Comparison, By Region
4.1.8.2. Market Share Comparison, By Region
4.1.8.3. Y-o-Y growth Comparison, By Region
4.1.9. Utilities & Energy Physical Security Services Market Size and Forecast, 2012-2022
4.1.9.1. Revenue (US$ Mn) Comparison, By Region
4.1.9.2. Market Share Comparison, By Region
4.1.9.3. Y-o-Y growth Comparison, By Region
4.1.10. Commercial Physical Security Services Market Size and Forecast, 2012-2022
4.1.10.1.Revenue (US$ Mn) Comparison, By Region
4.1.10.2.Market Share Comparison, By Region
4.1.10.3.Y-o-Y growth Comparison, By Region
5. Global Physical Security Services Market Analysis and Forecast By Region
5.1. Global Physical Security Services Market Size and Forecast, 2012-2022
5.1.1. North America Physical Security Services Market Size and Forecast, 2012-2022
5.1.1.1. Revenue (US$ Mn) Comparison, By Service Type
5.1.1.2. Revenue (US$ Mn) Comparison, By Vertical
5.1.2. Latin America Physical Security Services Market Size and Forecast, 2012-2022
5.1.2.1. Revenue (US$ Mn) Comparison, By Service Type
5.1.2.2. Revenue (US$ Mn) Comparison, By Vertical
5.1.3. Europe Physical Security Services Market Size and Forecast, 2012-2022
5.1.3.1. Revenue (US$ Mn) Comparison, By Service Type
5.1.3.2. Revenue (US$ Mn) Comparison, By Vertical
5.1.4. Japan Physical Security Services Market Size and Forecast, 2012-2022
5.1.4.1. Revenue (US$ Mn) Comparison, By Service Type
5.1.4.2. Revenue (US$ Mn) Comparison, By Vertical
5.1.5. APEJ Physical Security Services Market Size and Forecast, 2012-2022
5.1.5.1. Revenue (US$ Mn) Comparison, By Service Type
5.1.5.2. Revenue (US$ Mn) Comparison, By Vertical
5.1.6. MEA Physical Security Services Market Size and Forecast, 2012-2022
5.1.6.1. Revenue (US$ Mn) Comparison, By Service Type
5.1.6.2. Revenue (US$ Mn) Comparison, By Vertical
6. North America Physical Security Services Market Analysis and Forecast, By Country, 2012-2022
6.1. US Physical Security Services Market Size and Forecast, 2012-2022
6.1.1. Revenue (US$ Mn) Comparison, By Service Type
6.1.2. Revenue (US$ Mn) Comparison, By Vertical
6.2. Canada Physical Security Services Market Size and Forecast, 2012-2022
6.2.1. Revenue (US$ Mn) Comparison, By Service Type
6.2.2. Revenue (US$ Mn) Comparison, By Vertical
7. Latin America Physical Security Services Market Analysis and Forecast, By Country, 2012-2022
7.1. Brazil Physical Security Services Market Size and Forecast, 2012-2022
7.1.1. Revenue (US$ Mn) Comparison, By Service Type
7.1.2. Revenue (US$ Mn) Comparison, By Vertical
7.2. Mexico Physical Security Services Market Size and Forecast, 2012-2022
7.2.1. Revenue (US$ Mn) Comparison, By Service Type
7.2.2. Revenue (US$ Mn) Comparison, By Vertical
7.3. Argentina Physical Security Services Market Size and Forecast, 2012-2022
7.3.1. Revenue (US$ Mn) Comparison, By Service Type
7.3.2. Revenue (US$ Mn) Comparison, By Vertical
8. Europe Physical Security Services Market Analysis and Forecast, By Country, 2012-2022
8.1. Germany Physical Security Services Market Size and Forecast, 2012-2022
8.1.1. Revenue (US$ Mn) Comparison, By Service Type
8.1.2. Revenue (US$ Mn) Comparison, By Vertical
8.2. UK Physical Security Services Market Size and Forecast, 2012-2022
8.2.1. Revenue (US$ Mn) Comparison, By Service Type
8.2.2. Revenue (US$ Mn) Comparison, By Vertical
8.3. France Physical Security Services Market Size and Forecast, 2012-2022
8.3.1. Revenue (US$ Mn) Comparison, By Service Type
8.3.2. Revenue (US$ Mn) Comparison, By Vertical
8.4. Spain Physical Security Services Market Size and Forecast, 2012-2022
8.4.1. Revenue (US$ Mn) Comparison, By Service Type
8.4.2. Revenue (US$ Mn) Comparison, By Vertical
8.5. Italy Physical Security Services Market Size and Forecast, 2012-2022
8.5.1. Revenue (US$ Mn) Comparison, By Service Type
8.5.2. Revenue (US$ Mn) Comparison, By Vertical
8.6. Nordic Physical Security Services Market Size and Forecast, 2012-2022
8.6.1. Revenue (US$ Mn) Comparison, By Service Type
8.6.2. Revenue (US$ Mn) Comparison, By Vertical
9. Japan Physical Security Services Market Analysis and Forecast, By Country, 2012-2022
9.1. Japan Physical Security Services Market Size and Forecast, 2012-2022
9.1.1. Revenue (US$ Mn) Comparison, By Service Type
9.1.2. Revenue (US$ Mn) Comparison, By Vertical
10. APEJ Physical Security Services Market Analysis and Forecast, By Country, 2012-2022
10.1. China Physical Security Services Market Size and Forecast, 2012-2022
10.1.1. Revenue (US$ Mn) Comparison, By Service Type
10.1.2. Revenue (US$ Mn) Comparison, By Vertical
10.2. India Physical Security Services Market Size and Forecast, 2012-2022
10.2.1. Revenue (US$ Mn) Comparison, By Service Type
10.2.2. Revenue (US$ Mn) Comparison, By Vertical
10.3. Malaysia Physical Security Services Market Size and Forecast, 2012-2022
10.3.1. Revenue (US$ Mn) Comparison, By Service Type
10.3.2. Revenue (US$ Mn) Comparison, By Vertical
10.4. Thailand Physical Security Services Market Size and Forecast, 2012-2022
10.4.1. Revenue (US$ Mn) Comparison, By Service Type
10.4.2. Revenue (US$ Mn) Comparison, By Vertical
10.5. Singapore Physical Security Services Market Size and Forecast, 2012-2022
10.5.1. Revenue (US$ Mn) Comparison, By Service Type
10.5.2. Revenue (US$ Mn) Comparison, By Vertical
10.6. Australia Physical Security Services Market Size and Forecast, 2012-2022
10.6.1. Revenue (US$ Mn) Comparison, By Service Type
10.6.2. Revenue (US$ Mn) Comparison, By Vertical
11. MEA Physical Security Services Market Analysis and Forecast, By Country, 2012-2022
11.1. GCC Countries Physical Security Services Market Size and Forecast, 2012-2022
11.1.1. Revenue (US$ Mn) Comparison, By Service Type
11.1.2. Revenue (US$ Mn) Comparison, By Vertical
11.2. South Africa Physical Security Services Market Size and Forecast, 2012-2022
11.2.1. Revenue (US$ Mn) Comparison, By Service Type
11.2.2. Revenue (US$ Mn) Comparison, By Vertical
11.3. Nigeria Physical Security Services Market Size and Forecast, 2012-2022
11.3.1. Revenue (US$ Mn) Comparison, By Service Type
11.3.2. Revenue (US$ Mn) Comparison, By Vertical
11.4. Israel Physical Security Services Market Size and Forecast, 2012-2022
11.4.1. Revenue (US$ Mn) Comparison, By Service Type
11.4.2. Revenue (US$ Mn) Comparison, By Vertical
12. Global Physical Security Services Market Company Share, Competition Landscape and Company Profiles
12.1. Company Share Analysis
12.2. Competition Landscape
12.3. Company Profiles
12.3.1. Tyco International Limited
12.3.2. The ADT Corp.
12.3.3. SECOM Company Limited
12.3.4. STANLEY Convergent Security Solutions, Inc.
12.3.5. United Technologies Corporation
12.3.6. SOHGO SECURITY SERVICES CO.,LTD. (ALSOK)
12.3.7. Bosch Sicherheitssysteme GmbH
12.3.8. Honeywell International Inc
12.3.9. S-1 Corp.
12.3.10.G4S PLC
13. Research Methodology
14. Secondary and Primary Sources
15. Assumptions and Acronyms
16. Disclaimer
List of Tables
TABLE 1 Global Physical Security Services Market Value (US$ Mn), 2012-2016
TABLE 2 Global Physical Security Services Market Value (US$ Mn), 2017-2022
TABLE 3 Global Physical Security Services Market Value (US$ Mn) and Y-o-Y, 2015-2022
TABLE 4 Global VSaaS Segment Value (US$ Mn), By Region 2012-2016
TABLE 5 Global VSaaS Segment Value (US$ Mn), By Region 2017-2022
TABLE 6 Global VSaaS Segment Market Share, By Region 2012-2016
TABLE 7 Global VSaaS Segment Market Share, By Region 2017-2022
TABLE 8 Global VSaaS Segment Y-o-Y, By Region 2015-2022
TABLE 9 Global ACaaS Segment Value (US$ Mn), By Region 2012-2016
TABLE 10 Global ACaaS Segment Value (US$ Mn), By Region 2017-2022
TABLE 11 Global ACaaS Segment Market Share, By Region 2012-2016
TABLE 12 Global ACaaS Segment Market Share, By Region 2017-2022
TABLE 13 Global ACaaS Segment Y-o-Y, By Region 2015-2022
TABLE 14 Global Remote Monitoring Services Segment Value (US$ Mn), By Region 2012-2016
TABLE 15 Global Remote Monitoring Services Segment Value (US$ Mn), By Region 2017-2022
TABLE 16 Global Remote Monitoring Services Segment Market Share, By Region 2012-2016
TABLE 17 Global Remote Monitoring Services Segment Market Share, By Region 2017-2022
TABLE 18 Global Remote Monitoring Services Segment Y-o-Y, By Region 2015-2022
TABLE 19 Global Security System Integration Segment Value (US$ Mn), By Region 2012-2016
TABLE 20 Global Security System Integration Segment Value (US$ Mn), By Region 2017-2022
TABLE 21 Global Security System Integration Segment Market Share, By Region 2012-2016
TABLE 22 Global Security System Integration Segment Market Share, By Region 2017-2022
TABLE 23 Global Security System Integration Segment Y-o-Y, By Region 2015-2022
TABLE 24 Global BFSI Segment Value (US$ Mn), By Region 2012-2016
TABLE 25 Global BFSI Segment Value (US$ Mn), By Region 2017-2022
TABLE 26 Global BFSI Segment Market Share, By Region 2012-2016
TABLE 27 Global BFSI Segment Market Share, By Region 2017-2022
TABLE 28 Global BFSI Segment Y-o-Y, By Region 2015-2022
TABLE 29 Global Education Segment Value (US$ Mn), By Region 2012-2016
TABLE 30 Global Education Segment Value (US$ Mn), By Region 2017-2022
TABLE 31 Global Education Segment Market Share, By Region 2012-2016
TABLE 32 Global Education Segment Market Share, By Region 2017-2022
TABLE 33 Global Education Segment Y-o-Y, By Region 2015-2022
TABLE 34 Global Healthcare Segment Value (US$ Mn), By Region 2012-2016
TABLE 35 Global Healthcare Segment Value (US$ Mn), By Region 2017-2022
TABLE 36 Global Healthcare Segment Market Share, By Region 2012-2016
TABLE 37 Global Healthcare Segment Market Share, By Region 2017-2022
TABLE 38 Global Healthcare Segment Y-o-Y, By Region 2015-2022
TABLE 39 Global Government Segment Value (US$ Mn), By Region 2012-2016
TABLE 40 Global Government Segment Value (US$ Mn), By Region 2017-2022
TABLE 41 Global Government Segment Market Share, By Region 2012-2016
TABLE 42 Global Government Segment Market Share, By Region 2017-2022
TABLE 43 Global Government Segment Y-o-Y, By Region 2015-2022
TABLE 44 Global Manufacturing Segment Value (US$ Mn), By Region 2012-2016
TABLE 45 Global Manufacturing Segment Value (US$ Mn), By Region 2017-2022
TABLE 46 Global Manufacturing Segment Market Share, By Region 2012-2016
TABLE 47 Global Manufacturing Segment Market Share, By Region 2017-2022
TABLE 48 Global Manufacturing Segment Y-o-Y, By Region 2015-2022
TABLE 49 Global Retail Segment Value (US$ Mn), By Region 2012-2016
TABLE 50 Global Retail Segment Value (US$ Mn), By Region 2017-2022
TABLE 51 Global Retail Segment Market Share, By Region 2012-2016
TABLE 52 Global Retail Segment Market Share, By Region 2017-2022
TABLE 53 Global Retail Segment Y-o-Y, By Region 2015-2022
TABLE 54 Global Residential Segment Value (US$ Mn), By Region 2012-2016
TABLE 55 Global Residential Segment Value (US$ Mn), By Region 2017-2022
TABLE 56 Global Residential Segment Market Share, By Region 2012-2016
TABLE 57 Global Residential Segment Market Share, By Region 2017-2022
TABLE 58 Global Residential Segment Y-o-Y, By Region 2015-2022
TABLE 59 Global Transportation Segment Value (US$ Mn), By Region 2012-2016
TABLE 60 Global Transportation Segment Value (US$ Mn), By Region 2017-2022
TABLE 61 Global Transportation Segment Market Share, By Region 2012-2016
TABLE 62 Global Transportation Segment Market Share, By Region 2017-2022
TABLE 63 Global Transportation Segment Y-o-Y, By Region 2015-2022
TABLE 64 Global Utilities & Energy Segment Value (US$ Mn), By Region 2012-2016
TABLE 65 Global Utilities & Energy Segment Value (US$ Mn), By Region 2017-2022
TABLE 66 Global Utilities & Energy Segment Market Share, By Region 2012-2016
TABLE 67 Global Utilities & Energy Segment Market Share, By Region 2017-2022
TABLE 68 Global Utilities & Energy Segment Y-o-Y, By Region 2015-2022
TABLE 69 Global Commercial Segment Value (US$ Mn), By Region 2012-2016
TABLE 70 Global Commercial Segment Value (US$ Mn), By Region 2017-2022
TABLE 71 Global Commercial Segment Market Share, By Region 2012-2016
TABLE 72 Global Commercial Segment Market Share, By Region 2017-2022
TABLE 73 Global Commercial Segment Y-o-Y, By Region 2015-2022
TABLE 74 North America Physical Security Services Market Value (US$ Mn), By Service Type 2012-2016
TABLE 75 North America Physical Security Services Market Value (US$ Mn), By Service Type 2017-2022
TABLE 76 North America Physical Security Services Market Value (US$ Mn), By Vertical 2012-2016
TABLE 77 North America Physical Security Services Market Value (US$ Mn), By Vertical 2017-2022
TABLE 78 Latin America Physical Security Services Market Value (US$ Mn), By Service Type 2012-2016
TABLE 79 Latin America Physical Security Services Market Value (US$ Mn), By Service Type 2017-2022
TABLE 80 Latin America Physical Security Services Market Value (US$ Mn), By Vertical 2012-2016
TABLE 81 Latin America Physical Security Services Market Value (US$ Mn), By Vertical 2017-2022
TABLE 82 Europe Physical Security Services Market Value (US$ Mn), By Service Type 2012-2016
TABLE 83 Europe Physical Security Services Market Value (US$ Mn), By Service Type 2017-2022
TABLE 84 Europe Physical Security Services Market Value (US$ Mn), By Vertical 2012-2016
TABLE 85 Europe Physical Security Services Market Value (US$ Mn), By Vertical 2017-2022
TABLE 86 Japan Physical Security Services Market Value (US$ Mn), By Service Type 2012-2016
TABLE 87 Japan Physical Security Services Market Value (US$ Mn), By Service Type 2017-2022
TABLE 88 Japan Physical Security Services Market Value (US$ Mn), By Vertical 2012-2016
TABLE 89 Japan Physical Security Services Market Value (US$ Mn), By Vertical 2017-2022
TABLE 90 APEJ Physical Security Services Market Value (US$ Mn), By Service Type 2012-2016
TABLE 91 APEJ Physical Security Services Market Value (US$ Mn), By Service Type 2017-2022
TABLE 92 APEJ Physical Security Services Market Value (US$ Mn), By Vertical 2012-2016
TABLE 93 APEJ Physical Security Services Market Value (US$ Mn), By Vertical 2017-2022
TABLE 94 MEA Physical Security Services Market Value (US$ Mn), By Service Type 2012-2016
TABLE 95 MEA Physical Security Services Market Value (US$ Mn), By Service Type 2017-2022
TABLE 96 MEA Physical Security Services Market Value (US$ Mn), By Vertical 2012-2016
TABLE 97 MEA Physical Security Services Market Value (US$ Mn), By Vertical 2017-2022
TABLE 98 US Physical Security Services Market Value (US$ Mn), By Service Type 2012-2016
TABLE 99 US Physical Security Services Market Value (US$ Mn), By Service Type 2017-2022
TABLE 100 US Physical Security Services Market Value (US$ Mn), By Vertical 2012-2016
TABLE 101 US Physical Security Services Market Value (US$ Mn), By Vertical 2017-2022
TABLE 102 Canada Physical Security Services Market Value (US$ Mn), By Service Type 2012-2016
TABLE 103 Canada Physical Security Services Market Value (US$ Mn), By Service Type 2017-2022
TABLE 104 Canada Physical Security Services Market Value (US$ Mn), By Vertical 2012-2016
TABLE 105 Canada Physical Security Services Market Value (US$ Mn), By Vertical 2017-2022
TABLE 106 Brazil Physical Security Services Market Value (US$ Mn), By Service Type 2012-2016
TABLE 107 Brazil Physical Security Services Market Value (US$ Mn), By Service Type 2017-2022
TABLE 108 Brazil Physical Security Services Market Value (US$ Mn), By Vertical 2012-2016
TABLE 109 Brazil Physical Security Services Market Value (US$ Mn), By Vertical 2017-2022
TABLE 110 Mexico Physical Security Services Market Value (US$ Mn), By Service Type 2012-2016
TABLE 111 Mexico Physical Security Services Market Value (US$ Mn), By Service Type 2017-2022
TABLE 112 Mexico Physical Security Services Market Value (US$ Mn), By Vertical 2012-2016
TABLE 113 Mexico Physical Security Services Market Value (US$ Mn), By Vertical 2017-2022
TABLE 114 Argentina Physical Security Services Market Value (US$ Mn), By Service Type 2012-2016
TABLE 115 Argentina Physical Security Services Market Value (US$ Mn), By Service Type 2017-2022
TABLE 116 Argentina Physical Security Services Market Value (US$ Mn), By Vertical 2012-2016
TABLE 117 Argentina Physical Security Services Market Value (US$ Mn), By Vertical 2017-2022
TABLE 118 Germany Physical Security Services Market Value (US$ Mn), By Service Type 2012-2016
TABLE 119 Germany Physical Security Services Market Value (US$ Mn), By Service Type 2017-2022
TABLE 120 Germany Physical Security Services Market Value (US$ Mn), By Vertical 2012-2016
TABLE 121 Germany Physical Security Services Market Value (US$ Mn), By Vertical 2017-2022
TABLE 122 UK Physical Security Services Market Value (US$ Mn), By Service Type 2012-2016
TABLE 123 UK Physical Security Services Market Value (US$ Mn), By Service Type 2017-2022
TABLE 124 UK Physical Security Services Market Value (US$ Mn), By Vertical 2012-2016
TABLE 125 UK Physical Security Services Market Value (US$ Mn), By Vertical 2017-2022
TABLE 126 France Physical Security Services Market Value (US$ Mn), By Service Type 2012-2016
TABLE 127 France Physical Security Services Market Value (US$ Mn), By Service Type 2017-2022
TABLE 128 France Physical Security Services Market Value (US$ Mn), By Vertical 2012-2016
TABLE 129 France Physical Security Services Market Value (US$ Mn), By Vertical 2017-2022
TABLE 130 Spain Physical Security Services Market Value (US$ Mn), By Service Type 2012-2016
TABLE 131 Spain Physical Security Services Market Value (US$ Mn), By Service Type 2017-2022
TABLE 132 Spain Physical Security Services Market Value (US$ Mn), By Vertical 2012-2016
TABLE 133 Spain Physical Security Services Market Value (US$ Mn), By Vertical 2017-2022
TABLE 134 Italy Physical Security Services Market Value (US$ Mn), By Service Type 2012-2016
TABLE 135 Italy Physical Security Services Market Value (US$ Mn), By Service Type 2017-2022
TABLE 136 Italy Physical Security Services Market Value (US$ Mn), By Vertical 2012-2016
TABLE 137 Italy Physical Security Services Market Value (US$ Mn), By Vertical 2017-2022
TABLE 138 Nordic Physical Security Services Market Value (US$ Mn), By Service Type 2012-2016
TABLE 139 Nordic Physical Security Services Market Value (US$ Mn), By Service Type 2017-2022
TABLE 140 Nordic Physical Security Services Market Value (US$ Mn), By Vertical 2012-2016
TABLE 141 Nordic Physical Security Services Market Value (US$ Mn), By Vertical 2017-2022
TABLE 142 Japan Physical Security Services Market Value (US$ Mn), By Service Type 2012-2016
TABLE 143 Japan Physical Security Services Market Value (US$ Mn), By Service Type 2017-2022
TABLE 144 Japan Physical Security Services Market Value (US$ Mn), By Vertical 2012-2016
TABLE 145 Japan Physical Security Services Market Value (US$ Mn), By Vertical 2017-2022
TABLE 146 China Physical Security Services Market Value (US$ Mn), By Service Type 2012-2016
TABLE 147 China Physical Security Services Market Value (US$ Mn), By Service Type 2017-2022
TABLE 148 China Physical Security Services Market Value (US$ Mn), By Vertical 2012-2016
TABLE 149 China Physical Security Services Market Value (US$ Mn), By Vertical 2017-2022
TABLE 150 India Physical Security Services Market Value (US$ Mn), By Service Type 2012-2016
TABLE 151 India Physical Security Services Market Value (US$ Mn), By Service Type 2017-2022
TABLE 152 India Physical Security Services Market Value (US$ Mn), By Vertical 2012-2016
TABLE 153 India Physical Security Services Market Value (US$ Mn), By Vertical 2017-2022
TABLE 154 Malaysia Physical Security Services Market Value (US$ Mn), By Service Type 2012-2016
TABLE 155 Malaysia Physical Security Services Market Value (US$ Mn), By Service Type 2017-2022
TABLE 156 Malaysia Physical Security Services Market Value (US$ Mn), By Vertical 2012-2016
TABLE 157 Malaysia Physical Security Services Market Value (US$ Mn), By Vertical 2017-2022
TABLE 158 Thailand Physical Security Services Market Value (US$ Mn), By Service Type 2012-2016
TABLE 159 Thailand Physical Security Services Market Value (US$ Mn), By Service Type 2017-2022
TABLE 160 Thailand Physical Security Services Market Value (US$ Mn), By Vertical 2012-2016
TABLE 161 Thailand Physical Security Services Market Value (US$ Mn), By Vertical 2017-2022
TABLE 162 Singapore Physical Security Services Market Value (US$ Mn), By Service Type 2012-2016
TABLE 163 Singapore Physical Security Services Market Value (US$ Mn), By Service Type 2017-2022
TABLE 164 Singapore Physical Security Services Market Value (US$ Mn), By Vertical 2012-2016
TABLE 165 Singapore Physical Security Services Market Value (US$ Mn), By Vertical 2017-2022
TABLE 166 Australia Physical Security Services Market Value (US$ Mn), By Service Type 2012-2016
TABLE 167 Australia Physical Security Services Market Value (US$ Mn), By Service Type 2017-2022
TABLE 168 Australia Physical Security Services Market Value (US$ Mn), By Vertical 2012-2016
TABLE 169 Australia Physical Security Services Market Value (US$ Mn), By Vertical 2017-2022
TABLE 170 GCC Countries Physical Security Services Market Value (US$ Mn), By Service Type 2012-2016
TABLE 171 GCC Countries Physical Security Services Market Value (US$ Mn), By Service Type 2017-2022
TABLE 172 GCC Countries Physical Security Services Market Value (US$ Mn), By Vertical 2012-2016
TABLE 173 GCC Countries Physical Security Services Market Value (US$ Mn), By Vertical 2017-2022
TABLE 174 South Africa Physical Security Services Market Value (US$ Mn), By Service Type 2012-2016
TABLE 175 South Africa Physical Security Services Market Value (US$ Mn), By Service Type 2017-2022
TABLE 176 South Africa Physical Security Services Market Value (US$ Mn), By Vertical 2012-2016
TABLE 177 South Africa Physical Security Services Market Value (US$ Mn), By Vertical 2017-2022
TABLE 178 Nigeria Physical Security Services Market Value (US$ Mn), By Service Type 2012-2016
TABLE 179 Nigeria Physical Security Services Market Value (US$ Mn), By Service Type 2017-2022
TABLE 180 Nigeria Physical Security Services Market Value (US$ Mn), By Vertical 2012-2016
TABLE 181 Nigeria Physical Security Services Market Value (US$ Mn), By Vertical 2017-2022
TABLE 182 Israel Physical Security Services Market Value (US$ Mn), By Service Type 2012-2016
TABLE 183 Israel Physical Security Services Market Value (US$ Mn), By Service Type 2017-2022
TABLE 184 Israel Physical Security Services Market Value (US$ Mn), By Vertical 2012-2016
TABLE 185 Israel Physical Security Services Market Value (US$ Mn), By Vertical 2017-2022
List of Figures
FIG. 1 Global Physical Security Services Market Value (US$ Mn), 2012-2016
FIG. 2 Global Physical Security Services Market Value (US$ Mn) Forecast, 2017-2022
FIG. 3 Global Physical Security Services Market Value (US$ Mn) and Y-o-Y, 2015-2022
FIG. 4 Global VSaaS Segment Market Value (US$ Mn) By Region, 2012-2016
FIG. 5 Global VSaaS Segment Market Value (US$ Mn) By Region, 2017-2022
FIG. 6 Global VSaaS Segment Y-o-Y Growth Rate, By Region, 2015-2022
FIG. 7 Global ACaaS Segment Market Value (US$ Mn) By Region, 2012-2016
FIG. 8 Global ACaaS Segment Market Value (US$ Mn) By Region, 2017-2022
FIG. 9 Global ACaaS Segment Y-o-Y Growth Rate, By Region, 2015-2022
FIG. 10 Global Remote Monitoring Services Segment Market Value (US$ Mn) By Region, 2012-2016
FIG. 11 Global Remote Monitoring Services Segment Market Value (US$ Mn) By Region, 2017-2022
FIG. 12 Global Remote Monitoring Services Segment Y-o-Y Growth Rate, By Region, 2015-2022
FIG. 13 Global Security System Integration Segment Market Value (US$ Mn) By Region, 2012-2016
FIG. 14 Global Security System Integration Segment Market Value (US$ Mn) By Region, 2017-2022
FIG. 15 Global Security System Integration Segment Y-o-Y Growth Rate, By Region, 2015-2022
FIG. 16 Global BFSI Segment Market Value (US$ Mn) By Region, 2012-2016
FIG. 17 Global BFSI Segment Market Value (US$ Mn) By Region, 2017-2022
FIG. 18 Global BFSI Segment Y-o-Y Growth Rate, By Region, 2015-2022
FIG. 19 Global Education Segment Market Value (US$ Mn) By Region, 2012-2016
FIG. 20 Global Education Segment Market Value (US$ Mn) By Region, 2017-2022
FIG. 21 Global Education Segment Y-o-Y Growth Rate, By Region, 2015-2022
FIG. 22 Global Healthcare Segment Market Value (US$ Mn) By Region, 2012-2016
FIG. 23 Global Healthcare Segment Market Value (US$ Mn) By Region, 2017-2022
FIG. 24 Global Healthcare Segment Y-o-Y Growth Rate, By Region, 2015-2022
FIG. 25 Global Government Segment Market Value (US$ Mn) By Region, 2012-2016
FIG. 26 Global Government Segment Market Value (US$ Mn) By Region, 2017-2022
FIG. 27 Global Government Segment Y-o-Y Growth Rate, By Region, 2015-2022
FIG. 28 Global Manufacturing Segment Market Value (US$ Mn) By Region, 2012-2016
FIG. 29 Global Manufacturing Segment Market Value (US$ Mn) By Region, 2017-2022
FIG. 30 Global Manufacturing Segment Y-o-Y Growth Rate, By Region, 2015-2022
FIG. 31 Global Retail Segment Market Value (US$ Mn) By Region, 2012-2016
FIG. 32 Global Retail Segment Market Value (US$ Mn) By Region, 2017-2022
FIG. 33 Global Retail Segment Y-o-Y Growth Rate, By Region, 2015-2022
FIG. 34 Global Residential Segment Market Value (US$ Mn) By Region, 2012-2016
FIG. 35 Global Residential Segment Market Value (US$ Mn) By Region, 2017-2022
FIG. 36 Global Residential Segment Y-o-Y Growth Rate, By Region, 2015-2022
FIG. 37 Global Transportation Segment Market Value (US$ Mn) By Region, 2012-2016
FIG. 38 Global Transportation Segment Market Value (US$ Mn) By Region, 2017-2022
FIG. 39 Global Transportation Segment Y-o-Y Growth Rate, By Region, 2015-2022
FIG. 40 Global Utilities & Energy Segment Market Value (US$ Mn) By Region, 2012-2016
FIG. 41 Global Utilities & Energy Segment Market Value (US$ Mn) By Region, 2017-2022
FIG. 42 Global Utilities & Energy Segment Y-o-Y Growth Rate, By Region, 2015-2022
FIG. 43 Global Commercial Segment Market Value (US$ Mn) By Region, 2012-2016
FIG. 44 Global Commercial Segment Market Value (US$ Mn) By Region, 2017-2022
FIG. 45 Global Commercial Segment Y-o-Y Growth Rate, By Region, 2015-2022
FIG. 46 North America Physical Security Services Market Value (US$ Mn), By Service Type 2012-2016
FIG. 47 North America Physical Security Services Market Value (US$ Mn), By Service Type 2017-2022
FIG. 48 North America Physical Security Services Market Value (US$ Mn), By Vertical 2012-2016
FIG. 49 North America Physical Security Services Market Value (US$ Mn), By Vertical 2017-2022
FIG. 50 Latin America Physical Security Services Market Value (US$ Mn), By Service Type 2012-2016
FIG. 51 Latin America Physical Security Services Market Value (US$ Mn), By Service Type 2017-2022
FIG. 52 Latin America Physical Security Services Market Value (US$ Mn), By Vertical 2012-2016
FIG. 53 Latin America Physical Security Services Market Value (US$ Mn), By Vertical 2017-2022
FIG. 54 Europe Physical Security Services Market Value (US$ Mn), By Service Type 2012-2016
FIG. 55 Europe Physical Security Services Market Value (US$ Mn), By Service Type 2017-2022
FIG. 56 Europe Physical Security Services Market Value (US$ Mn), By Vertical 2012-2016
FIG. 57 Europe Physical Security Services Market Value (US$ Mn), By Vertical 2017-2022
FIG. 58 Japan Physical Security Services Market Value (US$ Mn), By Service Type 2012-2016
FIG. 59 Japan Physical Security Services Market Value (US$ Mn), By Service Type 2017-2022
FIG. 60 Japan Physical Security Services Market Value (US$ Mn), By Vertical 2012-2016
FIG. 61 Japan Physical Security Services Market Value (US$ Mn), By Vertical 2017-2022
FIG. 62 APEJ Physical Security Services Market Value (US$ Mn), By Service Type 2012-2016
FIG. 63 APEJ Physical Security Services Market Value (US$ Mn), By Service Type 2017-2022
FIG. 64 APEJ Physical Security Services Market Value (US$ Mn), By Vertical 2012-2016
FIG. 65 APEJ Physical Security Services Market Value (US$ Mn), By Vertical 2017-2022
FIG. 66 MEA Physical Security Services Market Value (US$ Mn), By Service Type 2012-2016
FIG. 67 MEA Physical Security Services Market Value (US$ Mn), By Service Type 2017-2022
FIG. 68 MEA Physical Security Services Market Value (US$ Mn), By Vertical 2012-2016
FIG. 69 MEA Physical Security Services Market Value (US$ Mn), By Vertical 2017-2022
Copyright © Transparency Market Research, Inc. All Rights reserved
Trust Online

Physical Security Services Market