
Reports
Reports
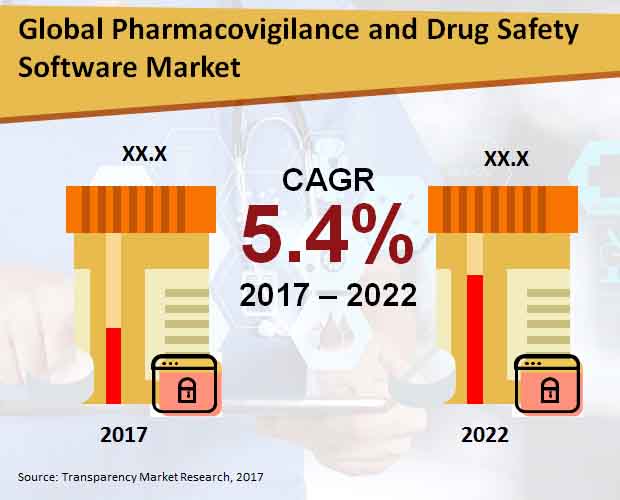
Pharmacovigilance and Drug Safety Software Market: Snapshot
Pharmacovigilance is the profession of monitoring medical drug effects after being licensed. This is especially done to identify and examine the previous unfavorable reactions of the medical drugs that has been unannounced. In simple terms it can be said drug safety. The global Pharmacovigilance and drug safety software market is anticipated to be accelerating because of the rising incidences of ADR or adverse drug reaction and surge in adoption of interconnected software services by a number of outsourcing companies. With the increase in demand for various drugs and medications all around the world and continuous efforts to manufacture safe drugs and the increasing pressure on various biotech and Pharma companies, the market is expected to witness a substantial growth in the future years.
The top players of global pharmacovigilance and drug safety software market could be more into benefit due to the associated use of cutting-edge softwares like Argus and ARISg. With easy accessible data and reduced use of outdated data, it has become easier for players to adopt pharmacovigilance softwares into the market. The critical use of pharmacovigilance and drug safety for various clinical research is estimated to propel the worldwide market.
The rise in patient safety issues and surging occurrences of adverse side effects as a result of certain drug consumption may boost the market for drug safety software and pharmacovigilance in the world. This could also be largely associated with the availability of clinical trial programs and reduction in medical expenditure and thus, propel the overall market for future growth.
Adverse Event Reporting Software to Offer Lucrative Growth Opportunities in Market
The global pharmacovigilance and drug safety software market can be categorized on the basis of delivery mode, end user, and software type. Based on classification by software type, the market can be divided into adverse event reporting software, drug safety audits software, issue tracking software, and fully integrated software. The adverse event reporting software segment is seen to be dominating the rest and is expected to continue its dominance in the years to come.
On the basis of end user, the global pharmacovigilance and drug safety software market can be divided into pharma and biotech, contract research organizations (CRO), business process outsourcing (BPO) firms. Among these, the segments seen to be dominating the market are the CRO and the BPO firms. They are also anticipated to continue their dominance in the years to come.
With respect to delivery mode, the global pharmacovigilance and drug safety software market can be further classified into cloud-based delivery mode and on-premise delivery mode.
North America Seen as an Attractive Region for Market Growth
Geographically, the global pharmacovigilance and drug safety software market is segmented into the regions of Latin America, North America, South America, Asia Pacific, Europe, and Middle East and Africa. Among these six segments, North America is estimated to be holding a substantial portion of the shares with a CAGR of 6.2%. By the end of the forecast period, North American region could show better prospects of growth in terms of revenue shares and drug safety software popularity.
Besides, Europe is also anticipated to reach a value of US$9.3 mn by the end of the forecast period followed by Asia Pacific with an exception of Japan. The estimated value of profit earned by Asia Pacific region is to be of value US$8.5 mn. Japan may show a slower growth rate as compare dto other countries of the Asia Pacific region. The total revenue projected is of a valuation of US$13.4 mn by the end of the forecast period. However, Middle East and Africa is envisioned to expand at a slower CAGR as compared to Japan.
Prominent players of the global pharmacovigilance and drug safety software market are United BioSource Corporation, Oracle Corporation, AB Cube, Sparta Systems, and UMBRA Global LLC.
Global Pharmacovigilance and Drug Safety Software Market to Expand with Advancements in Pharmaceutical Research
The demand within the global pharmacovigilance and drug safety software market is set to rise at a stellar pace in the times to follow. The use of high-end research and analysis technologies in the domain of pharmaceutical manufacturing has created new pathways for growth and advancement within the global market. The domain of pharmacovigilance and drug safety software has emerged as a saviour for the pharmaceutical industry that was previously battling the criticism from inspection authorities. The focus of the industry on safety and hygiene has brought pharmacovigilance and drug safety software under the scanner. Henceforth, the global pharma industry is treading along a lucrative trajectory, mainly due to advancements in drug safety and analysis.
1. Global Pharmacovigilance and Drug Safety Software Market - Executive Summary
2. Global Pharmacovigilance and Drug Safety Software Market Overview
2.1. Introduction
2.1.1. Global Pharmacovigilance and Drug Safety Software Market Taxonomy
2.1.2. Global Pharmacovigilance and Drug Safety Software Market Definition
2.2. Global Pharmacovigilance and Drug Safety Software Market Size (US$ Mn) and Forecast, 2012-2022
2.2.1. Global Pharmacovigilance and Drug Safety Software Market Y-o-Y Growth
2.3. Global Pharmacovigilance and Drug Safety Software Market Dynamics
2.4. Supply Chain
2.5. Cost Structure
2.6. Pricing Analysis
2.7. Technological Advancement
2.8. List of Distributors
2.9. Key Participants Market Presence (Intensity Map) By Region
3. Global Pharmacovigilance and Drug Safety Software Market Analysis and Forecast By Software Type
3.1. Global Pharmacovigilance and Drug Safety Software Market Size and Forecast By Software Type, 2012-2022
3.1.1. Adverse Event Reporting Software Market Size and Forecast, 2012-2022
3.1.1.1. Revenue (US$ Mn) Comparison, By Region
3.1.1.2. Market Share Comparison, By Region
3.1.1.3. Y-o-Y growth Comparison, By Region
3.1.2. Drug Safety Audits Software Market Size and Forecast, 2012-2022
3.1.2.1. Revenue (US$ Mn) Comparison, By Region
3.1.2.2. Market Share Comparison, By Region
3.1.2.3. Y-o-Y growth Comparison, By Region
3.1.3. Issue Tracking Software Market Size and Forecast, 2012-2022
3.1.3.1. Revenue (US$ Mn) Comparison, By Region
3.1.3.2. Market Share Comparison, By Region
3.1.3.3. Y-o-Y growth Comparison, By Region
3.1.4. Fully Integrated Software Market Size and Forecast, 2012-2022
3.1.4.1. Revenue (US$ Mn) Comparison, By Region
3.1.4.2. Market Share Comparison, By Region
3.1.4.3. Y-o-Y growth Comparison, By Region
4. Global Pharmacovigilance and Drug Safety Software Market Analysis and Forecast By End User
4.1. Global Pharmacovigilance and Drug Safety Software Market Size and Forecast By End User, 2012-2022
4.1.1. Pharma and Biotech Companies Market Size and Forecast, 2012-2022
4.1.1.1. Revenue (US$ Mn) Comparison, By Region
4.1.1.2. Market Share Comparison, By Region
4.1.1.3. Y-o-Y growth Comparison, By Region
4.1.2. Contract Research Organizations (CROs) Market Size and Forecast, 2012-2022
4.1.2.1. Revenue (US$ Mn) Comparison, By Region
4.1.2.2. Market Share Comparison, By Region
4.1.2.3. Y-o-Y growth Comparison, By Region
4.1.3. Business Process Outsourcing (BPO) Firms Market Size and Forecast, 2012-2022
4.1.3.1. Revenue (US$ Mn) Comparison, By Region
4.1.3.2. Market Share Comparison, By Region
4.1.3.3. Y-o-Y growth Comparison, By Region
4.1.4. Other Pharmacovigilance Service Providers Market Size and Forecast, 2012-2022
4.1.4.1. Revenue (US$ Mn) Comparison, By Region
4.1.4.2. Market Share Comparison, By Region
4.1.4.3. Y-o-Y growth Comparison, By Region
5. Global Pharmacovigilance and Drug Safety Software Market Analysis and Forecast By Delivery Mode
5.1. Global Pharmacovigilance and Drug Safety Software Market Size and Forecast By Delivery Mode, 2012-2022
5.1.1. On-premise Delivery Mode Market Size and Forecast, 2012-2022
5.1.1.1. Revenue (US$ Mn) Comparison, By Region
5.1.1.2. Market Share Comparison, By Region
5.1.1.3. Y-o-Y growth Comparison, By Region
5.1.2. Cloud-based Delivery Mode Market Size and Forecast, 2012-2022
5.1.2.1. Revenue (US$ Mn) Comparison, By Region
5.1.2.2. Market Share Comparison, By Region
5.1.2.3. Y-o-Y growth Comparison, By Region
6. Global Pharmacovigilance and Drug Safety Software Market Analysis and Forecast By Region
6.1. Global Pharmacovigilance and Drug Safety Software Market Size and Forecast, 2012-2022
6.1.1. North America Pharmacovigilance and Drug Safety Software Market Size and Forecast, 2012-2022
6.1.1.1. Revenue (US$ Mn) Comparison, By Software Type
6.1.1.2. Revenue (US$ Mn) Comparison, By End User
6.1.1.3. Revenue (US$ Mn) Comparison, By Delivery Mode
6.1.2. Latin America Pharmacovigilance and Drug Safety Software Market Size and Forecast, 2012-2022
6.1.2.1. Revenue (US$ Mn) Comparison, By Software Type
6.1.2.2. Revenue (US$ Mn) Comparison, By End User
6.1.2.3. Revenue (US$ Mn) Comparison, By Delivery Mode
6.1.3. Europe Pharmacovigilance and Drug Safety Software Market Size and Forecast, 2012-2022
6.1.3.1. Revenue (US$ Mn) Comparison, By Software Type
6.1.3.2. Revenue (US$ Mn) Comparison, By End User
6.1.3.3. Revenue (US$ Mn) Comparison, By Delivery Mode
6.1.4. Japan Pharmacovigilance and Drug Safety Software Market Size and Forecast, 2012-2022
6.1.4.1. Revenue (US$ Mn) Comparison, By Software Type
6.1.4.2. Revenue (US$ Mn) Comparison, By End User
6.1.4.3. Revenue (US$ Mn) Comparison, By Delivery Mode
6.1.5. APEJ Pharmacovigilance and Drug Safety Software Market Size and Forecast, 2012-2022
6.1.5.1. Revenue (US$ Mn) Comparison, By Software Type
6.1.5.2. Revenue (US$ Mn) Comparison, By End User
6.1.5.3. Revenue (US$ Mn) Comparison, By Delivery Mode
6.1.6. MEA Pharmacovigilance and Drug Safety Software Market Size and Forecast, 2012-2022
6.1.6.1. Revenue (US$ Mn) Comparison, By Software Type
6.1.6.2. Revenue (US$ Mn) Comparison, By End User
6.1.6.3. Revenue (US$ Mn) Comparison, By Delivery Mode
7. North America Pharmacovigilance and Drug Safety Software Market Analysis and Forecast, By Country, 2012-2022
7.1. US Pharmacovigilance and Drug Safety Software Market Size and Forecast, 2012-2022
7.1.1. Revenue (US$ Mn) Comparison, By Software Type
7.1.2. Revenue (US$ Mn) Comparison, By End User
7.1.3. Revenue (US$ Mn) Comparison, By Delivery Mode
7.2. Canada Pharmacovigilance and Drug Safety Software Market Size and Forecast, 2012-2022
7.2.1. Revenue (US$ Mn) Comparison, By Software Type
7.2.2. Revenue (US$ Mn) Comparison, By End User
7.2.3. Revenue (US$ Mn) Comparison, By Delivery Mode
8. Latin America Pharmacovigilance and Drug Safety Software Market Analysis and Forecast, By Country, 2012-2022
8.1. Brazil Pharmacovigilance and Drug Safety Software Market Size and Forecast, 2012-2022
8.1.1. Revenue (US$ Mn) Comparison, By Software Type
8.1.2. Revenue (US$ Mn) Comparison, By End User
8.1.3. Revenue (US$ Mn) Comparison, By Delivery Mode
8.2. Mexico Pharmacovigilance and Drug Safety Software Market Size and Forecast, 2012-2022
8.2.1. Revenue (US$ Mn) Comparison, By Software Type
8.2.2. Revenue (US$ Mn) Comparison, By End User
8.2.3. Revenue (US$ Mn) Comparison, By Delivery Mode
8.3. Argentina Pharmacovigilance and Drug Safety Software Market Size and Forecast, 2012-2022
8.3.1. Revenue (US$ Mn) Comparison, By Software Type
8.3.2. Revenue (US$ Mn) Comparison, By End User
8.3.3. Revenue (US$ Mn) Comparison, By Delivery Mode
9. Europe Pharmacovigilance and Drug Safety Software Market Analysis and Forecast, By Country, 2012-2022
9.1. Germany Pharmacovigilance and Drug Safety Software Market Size and Forecast, 2012-2022
9.1.1. Revenue (US$ Mn) Comparison, By Software Type
9.1.2. Revenue (US$ Mn) Comparison, By End User
9.1.3. Revenue (US$ Mn) Comparison, By Delivery Mode
9.2. UK Pharmacovigilance and Drug Safety Software Market Size and Forecast, 2012-2022
9.2.1. Revenue (US$ Mn) Comparison, By Software Type
9.2.2. Revenue (US$ Mn) Comparison, By End User
9.2.3. Revenue (US$ Mn) Comparison, By Delivery Mode
9.3. France Pharmacovigilance and Drug Safety Software Market Size and Forecast, 2012-2022
9.3.1. Revenue (US$ Mn) Comparison, By Software Type
9.3.2. Revenue (US$ Mn) Comparison, By End User
9.3.3. Revenue (US$ Mn) Comparison, By Delivery Mode
9.4. Spain Pharmacovigilance and Drug Safety Software Market Size and Forecast, 2012-2022
9.4.1. Revenue (US$ Mn) Comparison, By Software Type
9.4.2. Revenue (US$ Mn) Comparison, By End User
9.4.3. Revenue (US$ Mn) Comparison, By Delivery Mode
9.5. Italy Pharmacovigilance and Drug Safety Software Market Size and Forecast, 2012-2022
9.5.1. Revenue (US$ Mn) Comparison, By Software Type
9.5.2. Revenue (US$ Mn) Comparison, By End User
9.5.3. Revenue (US$ Mn) Comparison, By Delivery Mode
9.6. Nordic Pharmacovigilance and Drug Safety Software Market Size and Forecast, 2012-2022
9.6.1. Revenue (US$ Mn) Comparison, By Software Type
9.6.2. Revenue (US$ Mn) Comparison, By End User
9.6.3. Revenue (US$ Mn) Comparison, By Delivery Mode
10. Japan Pharmacovigilance and Drug Safety Software Market Analysis and Forecast, By Country, 2012-2022
10.1. Japan Pharmacovigilance and Drug Safety Software Market Size and Forecast, 2012-2022
10.1.1. Revenue (US$ Mn) Comparison, By Software Type
10.1.2. Revenue (US$ Mn) Comparison, By End User
10.1.3. Revenue (US$ Mn) Comparison, By Delivery Mode
11. APEJ Pharmacovigilance and Drug Safety Software Market Analysis and Forecast, By Country, 2012-2022
11.1. China Pharmacovigilance and Drug Safety Software Market Size and Forecast, 2012-2022
11.1.1. Revenue (US$ Mn) Comparison, By Software Type
11.1.2. Revenue (US$ Mn) Comparison, By End User
11.1.3. Revenue (US$ Mn) Comparison, By Delivery Mode
11.2. India Pharmacovigilance and Drug Safety Software Market Size and Forecast, 2012-2022
11.2.1. Revenue (US$ Mn) Comparison, By Software Type
11.2.2. Revenue (US$ Mn) Comparison, By End User
11.2.3. Revenue (US$ Mn) Comparison, By Delivery Mode
11.3. Malaysia Pharmacovigilance and Drug Safety Software Market Size and Forecast, 2012-2022
11.3.1. Revenue (US$ Mn) Comparison, By Software Type
11.3.2. Revenue (US$ Mn) Comparison, By End User
11.3.3. Revenue (US$ Mn) Comparison, By Delivery Mode
11.4. Thailand Pharmacovigilance and Drug Safety Software Market Size and Forecast, 2012-2022
11.4.1. Revenue (US$ Mn) Comparison, By Software Type
11.4.2. Revenue (US$ Mn) Comparison, By End User
11.4.3. Revenue (US$ Mn) Comparison, By Delivery Mode
11.5. Singapore Pharmacovigilance and Drug Safety Software Market Size and Forecast, 2012-2022
11.5.1. Revenue (US$ Mn) Comparison, By Software Type
11.5.2. Revenue (US$ Mn) Comparison, By End User
11.5.3. Revenue (US$ Mn) Comparison, By Delivery Mode
11.6. Australia Pharmacovigilance and Drug Safety Software Market Size and Forecast, 2012-2022
11.6.1. Revenue (US$ Mn) Comparison, By Software Type
11.6.2. Revenue (US$ Mn) Comparison, By End User
11.6.3. Revenue (US$ Mn) Comparison, By Delivery Mode
12. MEA Pharmacovigilance and Drug Safety Software Market Analysis and Forecast, By Country, 2012-2022
12.1. GCC Countries Pharmacovigilance and Drug Safety Software Market Size and Forecast, 2012-2022
12.1.1. Revenue (US$ Mn) Comparison, By Software Type
12.1.2. Revenue (US$ Mn) Comparison, By End User
12.1.3. Revenue (US$ Mn) Comparison, By Delivery Mode
12.2. South Africa Pharmacovigilance and Drug Safety Software Market Size and Forecast, 2012-2022
12.2.1. Revenue (US$ Mn) Comparison, By Software Type
12.2.2. Revenue (US$ Mn) Comparison, By End User
12.2.3. Revenue (US$ Mn) Comparison, By Delivery Mode
12.3. Nigeria Pharmacovigilance and Drug Safety Software Market Size and Forecast, 2012-2022
12.3.1. Revenue (US$ Mn) Comparison, By Software Type
12.3.2. Revenue (US$ Mn) Comparison, By End User
12.3.3. Revenue (US$ Mn) Comparison, By Delivery Mode
12.4. Israel Pharmacovigilance and Drug Safety Software Market Size and Forecast, 2012-2022
12.4.1. Revenue (US$ Mn) Comparison, By Software Type
12.4.2. Revenue (US$ Mn) Comparison, By End User
12.4.3. Revenue (US$ Mn) Comparison, By Delivery Mode
13. Global Pharmacovigilance and Drug Safety Software Market Company Share, Competition Landscape and Company Profiles
13.1. Company Share Analysis
13.2. Competition Landscape
13.3. Company Profiles
13.3.1. ArisGlobal
13.3.2. Ennov Solutions Inc.
13.3.3. EXTEDO GmbH
13.3.4. Oracle Corporation
13.3.5. Sparta Systems, Inc.
13.3.6. United BioSource Corporation
13.3.7. AB Cube
13.3.8. UMBRA Global LLC
14. Research Methodology
15. Secondary and Primary Sources
16. Assumptions and Acronyms
17. Disclaimer
List of Tables
TABLE 1 Global Pharmacovigilance and Drug Safety Software Market Value (US$ Mn), 2012-2016
TABLE 2 Global Pharmacovigilance and Drug Safety Software Market Value (US$ Mn), 2017-2022
TABLE 3 Global Pharmacovigilance and Drug Safety Software Market Value (US$ Mn) and Y-o-Y, 2015-2022
TABLE 4 Global Adverse Event Reporting Software Segment Value (US$ Mn), By Region 2012-2016
TABLE 5 Global Adverse Event Reporting Software Segment Value (US$ Mn), By Region 2017-2022
TABLE 6 Global Adverse Event Reporting Software Segment Market Share, By Region 2012-2016
TABLE 7 Global Adverse Event Reporting Software Segment Market Share, By Region 2017-2022
TABLE 8 Global Adverse Event Reporting Software Segment Y-o-Y, By Region 2015-2022
TABLE 9 Global Drug Safety Audits Software Segment Value (US$ Mn), By Region 2012-2016
TABLE 10 Global Drug Safety Audits Software Segment Value (US$ Mn), By Region 2017-2022
TABLE 11 Global Drug Safety Audits Software Segment Market Share, By Region 2012-2016
TABLE 12 Global Drug Safety Audits Software Segment Market Share, By Region 2017-2022
TABLE 13 Global Drug Safety Audits Software Segment Y-o-Y, By Region 2015-2022
TABLE 14 Global Issue Tracking Software Segment Value (US$ Mn), By Region 2012-2016
TABLE 15 Global Issue Tracking Software Segment Value (US$ Mn), By Region 2017-2022
TABLE 16 Global Issue Tracking Software Segment Market Share, By Region 2012-2016
TABLE 17 Global Issue Tracking Software Segment Market Share, By Region 2017-2022
TABLE 18 Global Issue Tracking Software Segment Y-o-Y, By Region 2015-2022
TABLE 19 Global Fully Integrated Software Segment Value (US$ Mn), By Region 2012-2016
TABLE 20 Global Fully Integrated Software Segment Value (US$ Mn), By Region 2017-2022
TABLE 21 Global Fully Integrated Software Segment Market Share, By Region 2012-2016
TABLE 22 Global Fully Integrated Software Segment Market Share, By Region 2017-2022
TABLE 23 Global Fully Integrated Software Segment Y-o-Y, By Region 2015-2022
TABLE 24 Global Pharma and Biotech Companies Segment Value (US$ Mn), By Region 2012-2016
TABLE 25 Global Pharma and Biotech Companies Segment Value (US$ Mn), By Region 2017-2022
TABLE 26 Global Pharma and Biotech Companies Segment Market Share, By Region 2012-2016
TABLE 27 Global Pharma and Biotech Companies Segment Market Share, By Region 2017-2022
TABLE 28 Global Pharma and Biotech Companies Segment Y-o-Y, By Region 2015-2022
TABLE 29 Global Contract Research Organizations (CROs) Segment Value (US$ Mn), By Region 2012-2016
TABLE 30 Global Contract Research Organizations (CROs) Segment Value (US$ Mn), By Region 2017-2022
TABLE 31 Global Contract Research Organizations (CROs) Segment Market Share, By Region 2012-2016
TABLE 32 Global Contract Research Organizations (CROs) Segment Market Share, By Region 2017-2022
TABLE 33 Global Contract Research Organizations (CROs) Segment Y-o-Y, By Region 2015-2022
TABLE 34 Global Business Process Outsourcing (BPO) Firms Segment Value (US$ Mn), By Region 2012-2016
TABLE 35 Global Business Process Outsourcing (BPO) Firms Segment Value (US$ Mn), By Region 2017-2022
TABLE 36 Global Business Process Outsourcing (BPO) Firms Segment Market Share, By Region 2012-2016
TABLE 37 Global Business Process Outsourcing (BPO) Firms Segment Market Share, By Region 2017-2022
TABLE 38 Global Business Process Outsourcing (BPO) Firms Segment Y-o-Y, By Region 2015-2022
TABLE 39 Global Other Pharmacovigilance Service Providers Segment Value (US$ Mn), By Region 2012-2016
TABLE 40 Global Other Pharmacovigilance Service Providers Segment Value (US$ Mn), By Region 2017-2022
TABLE 41 Global Other Pharmacovigilance Service Providers Segment Market Share, By Region 2012-2016
TABLE 42 Global Other Pharmacovigilance Service Providers Segment Market Share, By Region 2017-2022
TABLE 43 Global Other Pharmacovigilance Service Providers Segment Y-o-Y, By Region 2015-2022
TABLE 44 Global On-premise Delivery Mode Segment Value (US$ Mn), By Region 2012-2016
TABLE 45 Global On-premise Delivery Mode Segment Value (US$ Mn), By Region 2017-2022
TABLE 46 Global On-premise Delivery Mode Segment Market Share, By Region 2012-2016
TABLE 47 Global On-premise Delivery Mode Segment Market Share, By Region 2017-2022
TABLE 48 Global On-premise Delivery Mode Segment Y-o-Y, By Region 2015-2022
TABLE 49 Global Cloud-based Delivery Mode Segment Value (US$ Mn), By Region 2012-2016
TABLE 50 Global Cloud-based Delivery Mode Segment Value (US$ Mn), By Region 2017-2022
TABLE 51 Global Cloud-based Delivery Mode Segment Market Share, By Region 2012-2016
TABLE 52 Global Cloud-based Delivery Mode Segment Market Share, By Region 2017-2022
TABLE 53 Global Cloud-based Delivery Mode Segment Y-o-Y, By Region 2015-2022
TABLE 54 North America Pharmacovigilance and Drug Safety Software Market Value (US$ Mn), By Software Type 2012-2016
TABLE 55 North America Pharmacovigilance and Drug Safety Software Market Value (US$ Mn), By Software Type 2017-2022
TABLE 56 North America Pharmacovigilance and Drug Safety Software Market Value (US$ Mn), By End User 2012-2016
TABLE 57 North America Pharmacovigilance and Drug Safety Software Market Value (US$ Mn), By End User 2017-2022
TABLE 58 North America Pharmacovigilance and Drug Safety Software Market Value (US$ Mn), By Delivery Mode 2012-2016
TABLE 59 North America Pharmacovigilance and Drug Safety Software Market Value (US$ Mn), By Delivery Mode 2017-2022
TABLE 60 Latin America Pharmacovigilance and Drug Safety Software Market Value (US$ Mn), By Software Type 2012-2016
TABLE 61 Latin America Pharmacovigilance and Drug Safety Software Market Value (US$ Mn), By Software Type 2017-2022
TABLE 62 Latin America Pharmacovigilance and Drug Safety Software Market Value (US$ Mn), By End User 2012-2016
TABLE 63 Latin America Pharmacovigilance and Drug Safety Software Market Value (US$ Mn), By End User 2017-2022
TABLE 64 Latin America Pharmacovigilance and Drug Safety Software Market Value (US$ Mn), By Delivery Mode 2012-2016
TABLE 65 Latin America Pharmacovigilance and Drug Safety Software Market Value (US$ Mn), By Delivery Mode 2017-2022
TABLE 66 Europe Pharmacovigilance and Drug Safety Software Market Value (US$ Mn), By Software Type 2012-2016
TABLE 67 Europe Pharmacovigilance and Drug Safety Software Market Value (US$ Mn), By Software Type 2017-2022
TABLE 68 Europe Pharmacovigilance and Drug Safety Software Market Value (US$ Mn), By End User 2012-2016
TABLE 69 Europe Pharmacovigilance and Drug Safety Software Market Value (US$ Mn), By End User 2017-2022
TABLE 70 Europe Pharmacovigilance and Drug Safety Software Market Value (US$ Mn), By Delivery Mode 2012-2016
TABLE 71 Europe Pharmacovigilance and Drug Safety Software Market Value (US$ Mn), By Delivery Mode 2017-2022
TABLE 72 Japan Pharmacovigilance and Drug Safety Software Market Value (US$ Mn), By Software Type 2012-2016
TABLE 73 Japan Pharmacovigilance and Drug Safety Software Market Value (US$ Mn), By Software Type 2017-2022
TABLE 74 Japan Pharmacovigilance and Drug Safety Software Market Value (US$ Mn), By End User 2012-2016
TABLE 75 Japan Pharmacovigilance and Drug Safety Software Market Value (US$ Mn), By End User 2017-2022
TABLE 76 Japan Pharmacovigilance and Drug Safety Software Market Value (US$ Mn), By Delivery Mode 2012-2016
TABLE 77 Japan Pharmacovigilance and Drug Safety Software Market Value (US$ Mn), By Delivery Mode 2017-2022
TABLE 78 APEJ Pharmacovigilance and Drug Safety Software Market Value (US$ Mn), By Software Type 2012-2016
TABLE 79 APEJ Pharmacovigilance and Drug Safety Software Market Value (US$ Mn), By Software Type 2017-2022
TABLE 80 APEJ Pharmacovigilance and Drug Safety Software Market Value (US$ Mn), By End User 2012-2016
TABLE 81 APEJ Pharmacovigilance and Drug Safety Software Market Value (US$ Mn), By End User 2017-2022
TABLE 82 APEJ Pharmacovigilance and Drug Safety Software Market Value (US$ Mn), By Delivery Mode 2012-2016
TABLE 83 APEJ Pharmacovigilance and Drug Safety Software Market Value (US$ Mn), By Delivery Mode 2017-2022
TABLE 84 MEA Pharmacovigilance and Drug Safety Software Market Value (US$ Mn), By Software Type 2012-2016
TABLE 85 MEA Pharmacovigilance and Drug Safety Software Market Value (US$ Mn), By Software Type 2017-2022
TABLE 86 MEA Pharmacovigilance and Drug Safety Software Market Value (US$ Mn), By End User 2012-2016
TABLE 87 MEA Pharmacovigilance and Drug Safety Software Market Value (US$ Mn), By End User 2017-2022
TABLE 88 MEA Pharmacovigilance and Drug Safety Software Market Value (US$ Mn), By Delivery Mode 2012-2016
TABLE 89 MEA Pharmacovigilance and Drug Safety Software Market Value (US$ Mn), By Delivery Mode 2017-2022
TABLE 90 US Pharmacovigilance and Drug Safety Software Market Value (US$ Mn), By Software Type 2012-2016
TABLE 91 US Pharmacovigilance and Drug Safety Software Market Value (US$ Mn), By Software Type 2017-2022
TABLE 92 US Pharmacovigilance and Drug Safety Software Market Value (US$ Mn), By End User 2012-2016
TABLE 93 US Pharmacovigilance and Drug Safety Software Market Value (US$ Mn), By End User 2017-2022
TABLE 94 US Pharmacovigilance and Drug Safety Software Market Value (US$ Mn), By Delivery Mode 2012-2016
TABLE 95 US Pharmacovigilance and Drug Safety Software Market Value (US$ Mn), By Delivery Mode 2017-2022
TABLE 96 Canada Pharmacovigilance and Drug Safety Software Market Value (US$ Mn), By Software Type 2012-2016
TABLE 97 Canada Pharmacovigilance and Drug Safety Software Market Value (US$ Mn), By Software Type 2017-2022
TABLE 98 Canada Pharmacovigilance and Drug Safety Software Market Value (US$ Mn), By End User 2012-2016
TABLE 99 Canada Pharmacovigilance and Drug Safety Software Market Value (US$ Mn), By End User 2017-2022
TABLE 100 Canada Pharmacovigilance and Drug Safety Software Market Value (US$ Mn), By Delivery Mode 2012-2016
TABLE 101 Canada Pharmacovigilance and Drug Safety Software Market Value (US$ Mn), By Delivery Mode 2017-2022
TABLE 102 Brazil Pharmacovigilance and Drug Safety Software Market Value (US$ Mn), By Software Type 2012-2016
TABLE 103 Brazil Pharmacovigilance and Drug Safety Software Market Value (US$ Mn), By Software Type 2017-2022
TABLE 104 Brazil Pharmacovigilance and Drug Safety Software Market Value (US$ Mn), By End User 2012-2016
TABLE 105 Brazil Pharmacovigilance and Drug Safety Software Market Value (US$ Mn), By End User 2017-2022
TABLE 106 Brazil Pharmacovigilance and Drug Safety Software Market Value (US$ Mn), By Delivery Mode 2012-2016
TABLE 107 Brazil Pharmacovigilance and Drug Safety Software Market Value (US$ Mn), By Delivery Mode 2017-2022
TABLE 108 Mexico Pharmacovigilance and Drug Safety Software Market Value (US$ Mn), By Software Type 2012-2016
TABLE 109 Mexico Pharmacovigilance and Drug Safety Software Market Value (US$ Mn), By Software Type 2017-2022
TABLE 110 Mexico Pharmacovigilance and Drug Safety Software Market Value (US$ Mn), By End User 2012-2016
TABLE 111 Mexico Pharmacovigilance and Drug Safety Software Market Value (US$ Mn), By End User 2017-2022
TABLE 112 Mexico Pharmacovigilance and Drug Safety Software Market Value (US$ Mn), By Delivery Mode 2012-2016
TABLE 113 Mexico Pharmacovigilance and Drug Safety Software Market Value (US$ Mn), By Delivery Mode 2017-2022
TABLE 114 Argentina Pharmacovigilance and Drug Safety Software Market Value (US$ Mn), By Software Type 2012-2016
TABLE 115 Argentina Pharmacovigilance and Drug Safety Software Market Value (US$ Mn), By Software Type 2017-2022
TABLE 116 Argentina Pharmacovigilance and Drug Safety Software Market Value (US$ Mn), By End User 2012-2016
TABLE 117 Argentina Pharmacovigilance and Drug Safety Software Market Value (US$ Mn), By End User 2017-2022
TABLE 118 Argentina Pharmacovigilance and Drug Safety Software Market Value (US$ Mn), By Delivery Mode 2012-2016
TABLE 119 Argentina Pharmacovigilance and Drug Safety Software Market Value (US$ Mn), By Delivery Mode 2017-2022
TABLE 120 Germany Pharmacovigilance and Drug Safety Software Market Value (US$ Mn), By Software Type 2012-2016
TABLE 121 Germany Pharmacovigilance and Drug Safety Software Market Value (US$ Mn), By Software Type 2017-2022
TABLE 122 Germany Pharmacovigilance and Drug Safety Software Market Value (US$ Mn), By End User 2012-2016
TABLE 123 Germany Pharmacovigilance and Drug Safety Software Market Value (US$ Mn), By End User 2017-2022
TABLE 124 Germany Pharmacovigilance and Drug Safety Software Market Value (US$ Mn), By Delivery Mode 2012-2016
TABLE 125 Germany Pharmacovigilance and Drug Safety Software Market Value (US$ Mn), By Delivery Mode 2017-2022
TABLE 126 UK Pharmacovigilance and Drug Safety Software Market Value (US$ Mn), By Software Type 2012-2016
TABLE 127 UK Pharmacovigilance and Drug Safety Software Market Value (US$ Mn), By Software Type 2017-2022
TABLE 128 UK Pharmacovigilance and Drug Safety Software Market Value (US$ Mn), By End User 2012-2016
TABLE 129 UK Pharmacovigilance and Drug Safety Software Market Value (US$ Mn), By End User 2017-2022
TABLE 130 UK Pharmacovigilance and Drug Safety Software Market Value (US$ Mn), By Delivery Mode 2012-2016
TABLE 131 UK Pharmacovigilance and Drug Safety Software Market Value (US$ Mn), By Delivery Mode 2017-2022
TABLE 132 France Pharmacovigilance and Drug Safety Software Market Value (US$ Mn), By Software Type 2012-2016
TABLE 133 France Pharmacovigilance and Drug Safety Software Market Value (US$ Mn), By Software Type 2017-2022
TABLE 134 France Pharmacovigilance and Drug Safety Software Market Value (US$ Mn), By End User 2012-2016
TABLE 135 France Pharmacovigilance and Drug Safety Software Market Value (US$ Mn), By End User 2017-2022
TABLE 136 France Pharmacovigilance and Drug Safety Software Market Value (US$ Mn), By Delivery Mode 2012-2016
TABLE 137 France Pharmacovigilance and Drug Safety Software Market Value (US$ Mn), By Delivery Mode 2017-2022
TABLE 138 Spain Pharmacovigilance and Drug Safety Software Market Value (US$ Mn), By Software Type 2012-2016
TABLE 139 Spain Pharmacovigilance and Drug Safety Software Market Value (US$ Mn), By Software Type 2017-2022
TABLE 140 Spain Pharmacovigilance and Drug Safety Software Market Value (US$ Mn), By End User 2012-2016
TABLE 141 Spain Pharmacovigilance and Drug Safety Software Market Value (US$ Mn), By End User 2017-2022
TABLE 142 Spain Pharmacovigilance and Drug Safety Software Market Value (US$ Mn), By Delivery Mode 2012-2016
TABLE 143 Spain Pharmacovigilance and Drug Safety Software Market Value (US$ Mn), By Delivery Mode 2017-2022
TABLE 144 Italy Pharmacovigilance and Drug Safety Software Market Value (US$ Mn), By Software Type 2012-2016
TABLE 145 Italy Pharmacovigilance and Drug Safety Software Market Value (US$ Mn), By Software Type 2017-2022
TABLE 146 Italy Pharmacovigilance and Drug Safety Software Market Value (US$ Mn), By End User 2012-2016
TABLE 147 Italy Pharmacovigilance and Drug Safety Software Market Value (US$ Mn), By End User 2017-2022
TABLE 148 Italy Pharmacovigilance and Drug Safety Software Market Value (US$ Mn), By Delivery Mode 2012-2016
TABLE 149 Italy Pharmacovigilance and Drug Safety Software Market Value (US$ Mn), By Delivery Mode 2017-2022
TABLE 150 Nordic Pharmacovigilance and Drug Safety Software Market Value (US$ Mn), By Software Type 2012-2016
TABLE 151 Nordic Pharmacovigilance and Drug Safety Software Market Value (US$ Mn), By Software Type 2017-2022
TABLE 152 Nordic Pharmacovigilance and Drug Safety Software Market Value (US$ Mn), By End User 2012-2016
TABLE 153 Nordic Pharmacovigilance and Drug Safety Software Market Value (US$ Mn), By End User 2017-2022
TABLE 154 Nordic Pharmacovigilance and Drug Safety Software Market Value (US$ Mn), By Delivery Mode 2012-2016
TABLE 155 Nordic Pharmacovigilance and Drug Safety Software Market Value (US$ Mn), By Delivery Mode 2017-2022
TABLE 156 Japan Pharmacovigilance and Drug Safety Software Market Value (US$ Mn), By Software Type 2012-2016
TABLE 157 Japan Pharmacovigilance and Drug Safety Software Market Value (US$ Mn), By Software Type 2017-2022
TABLE 158 Japan Pharmacovigilance and Drug Safety Software Market Value (US$ Mn), By End User 2012-2016
TABLE 159 Japan Pharmacovigilance and Drug Safety Software Market Value (US$ Mn), By End User 2017-2022
TABLE 160 Japan Pharmacovigilance and Drug Safety Software Market Value (US$ Mn), By Delivery Mode 2012-2016
TABLE 161 Japan Pharmacovigilance and Drug Safety Software Market Value (US$ Mn), By Delivery Mode 2017-2022
TABLE 162 China Pharmacovigilance and Drug Safety Software Market Value (US$ Mn), By Software Type 2012-2016
TABLE 163 China Pharmacovigilance and Drug Safety Software Market Value (US$ Mn), By Software Type 2017-2022
TABLE 164 China Pharmacovigilance and Drug Safety Software Market Value (US$ Mn), By End User 2012-2016
TABLE 165 China Pharmacovigilance and Drug Safety Software Market Value (US$ Mn), By End User 2017-2022
TABLE 166 China Pharmacovigilance and Drug Safety Software Market Value (US$ Mn), By Delivery Mode 2012-2016
TABLE 167 China Pharmacovigilance and Drug Safety Software Market Value (US$ Mn), By Delivery Mode 2017-2022
TABLE 168 India Pharmacovigilance and Drug Safety Software Market Value (US$ Mn), By Software Type 2012-2016
TABLE 169 India Pharmacovigilance and Drug Safety Software Market Value (US$ Mn), By Software Type 2017-2022
TABLE 170 India Pharmacovigilance and Drug Safety Software Market Value (US$ Mn), By End User 2012-2016
TABLE 171 India Pharmacovigilance and Drug Safety Software Market Value (US$ Mn), By End User 2017-2022
TABLE 172 India Pharmacovigilance and Drug Safety Software Market Value (US$ Mn), By Delivery Mode 2012-2016
TABLE 173 India Pharmacovigilance and Drug Safety Software Market Value (US$ Mn), By Delivery Mode 2017-2022
TABLE 174 Malaysia Pharmacovigilance and Drug Safety Software Market Value (US$ Mn), By Software Type 2012-2016
TABLE 175 Malaysia Pharmacovigilance and Drug Safety Software Market Value (US$ Mn), By Software Type 2017-2022
TABLE 176 Malaysia Pharmacovigilance and Drug Safety Software Market Value (US$ Mn), By End User 2012-2016
TABLE 177 Malaysia Pharmacovigilance and Drug Safety Software Market Value (US$ Mn), By End User 2017-2022
TABLE 178 Malaysia Pharmacovigilance and Drug Safety Software Market Value (US$ Mn), By Delivery Mode 2012-2016
TABLE 179 Malaysia Pharmacovigilance and Drug Safety Software Market Value (US$ Mn), By Delivery Mode 2017-2022
TABLE 180 Thailand Pharmacovigilance and Drug Safety Software Market Value (US$ Mn), By Software Type 2012-2016
TABLE 181 Thailand Pharmacovigilance and Drug Safety Software Market Value (US$ Mn), By Software Type 2017-2022
TABLE 182 Thailand Pharmacovigilance and Drug Safety Software Market Value (US$ Mn), By End User 2012-2016
TABLE 183 Thailand Pharmacovigilance and Drug Safety Software Market Value (US$ Mn), By End User 2017-2022
TABLE 184 Thailand Pharmacovigilance and Drug Safety Software Market Value (US$ Mn), By Delivery Mode 2012-2016
TABLE 185 Thailand Pharmacovigilance and Drug Safety Software Market Value (US$ Mn), By Delivery Mode 2017-2022
TABLE 186 Singapore Pharmacovigilance and Drug Safety Software Market Value (US$ Mn), By Software Type 2012-2016
TABLE 187 Singapore Pharmacovigilance and Drug Safety Software Market Value (US$ Mn), By Software Type 2017-2022
TABLE 188 Singapore Pharmacovigilance and Drug Safety Software Market Value (US$ Mn), By End User 2012-2016
TABLE 189 Singapore Pharmacovigilance and Drug Safety Software Market Value (US$ Mn), By End User 2017-2022
TABLE 190 Singapore Pharmacovigilance and Drug Safety Software Market Value (US$ Mn), By Delivery Mode 2012-2016
TABLE 191 Singapore Pharmacovigilance and Drug Safety Software Market Value (US$ Mn), By Delivery Mode 2017-2022
TABLE 192 Australia Pharmacovigilance and Drug Safety Software Market Value (US$ Mn), By Software Type 2012-2016
TABLE 193 Australia Pharmacovigilance and Drug Safety Software Market Value (US$ Mn), By Software Type 2017-2022
TABLE 194 Australia Pharmacovigilance and Drug Safety Software Market Value (US$ Mn), By End User 2012-2016
TABLE 195 Australia Pharmacovigilance and Drug Safety Software Market Value (US$ Mn), By End User 2017-2022
TABLE 196 Australia Pharmacovigilance and Drug Safety Software Market Value (US$ Mn), By Delivery Mode 2012-2016
TABLE 197 Australia Pharmacovigilance and Drug Safety Software Market Value (US$ Mn), By Delivery Mode 2017-2022
TABLE 198 GCC Countries Pharmacovigilance and Drug Safety Software Market Value (US$ Mn), By Software Type 2012-2016
TABLE 199 GCC Countries Pharmacovigilance and Drug Safety Software Market Value (US$ Mn), By Software Type 2017-2022
TABLE 200 GCC Countries Pharmacovigilance and Drug Safety Software Market Value (US$ Mn), By End User 2012-2016
TABLE 201 GCC Countries Pharmacovigilance and Drug Safety Software Market Value (US$ Mn), By End User 2017-2022
TABLE 202 GCC Countries Pharmacovigilance and Drug Safety Software Market Value (US$ Mn), By Delivery Mode 2012-2016
TABLE 203 GCC Countries Pharmacovigilance and Drug Safety Software Market Value (US$ Mn), By Delivery Mode 2017-2022
TABLE 204 South Africa Pharmacovigilance and Drug Safety Software Market Value (US$ Mn), By Software Type 2012-2016
TABLE 205 South Africa Pharmacovigilance and Drug Safety Software Market Value (US$ Mn), By Software Type 2017-2022
TABLE 206 South Africa Pharmacovigilance and Drug Safety Software Market Value (US$ Mn), By End User 2012-2016
TABLE 207 South Africa Pharmacovigilance and Drug Safety Software Market Value (US$ Mn), By End User 2017-2022
TABLE 208 South Africa Pharmacovigilance and Drug Safety Software Market Value (US$ Mn), By Delivery Mode 2012-2016
TABLE 209 South Africa Pharmacovigilance and Drug Safety Software Market Value (US$ Mn), By Delivery Mode 2017-2022
TABLE 210 Nigeria Pharmacovigilance and Drug Safety Software Market Value (US$ Mn), By Software Type 2012-2016
TABLE 211 Nigeria Pharmacovigilance and Drug Safety Software Market Value (US$ Mn), By Software Type 2017-2022
TABLE 212 Nigeria Pharmacovigilance and Drug Safety Software Market Value (US$ Mn), By End User 2012-2016
TABLE 213 Nigeria Pharmacovigilance and Drug Safety Software Market Value (US$ Mn), By End User 2017-2022
TABLE 214 Nigeria Pharmacovigilance and Drug Safety Software Market Value (US$ Mn), By Delivery Mode 2012-2016
TABLE 215 Nigeria Pharmacovigilance and Drug Safety Software Market Value (US$ Mn), By Delivery Mode 2017-2022
TABLE 216 Israel Pharmacovigilance and Drug Safety Software Market Value (US$ Mn), By Software Type 2012-2016
TABLE 217 Israel Pharmacovigilance and Drug Safety Software Market Value (US$ Mn), By Software Type 2017-2022
TABLE 218 Israel Pharmacovigilance and Drug Safety Software Market Value (US$ Mn), By End User 2012-2016
TABLE 219 Israel Pharmacovigilance and Drug Safety Software Market Value (US$ Mn), By End User 2017-2022
TABLE 220 Israel Pharmacovigilance and Drug Safety Software Market Value (US$ Mn), By Delivery Mode 2012-2016
TABLE 221 Israel Pharmacovigilance and Drug Safety Software Market Value (US$ Mn), By Delivery Mode 2017-2022
List of Figures
FIG. 1 Global Pharmacovigilance and Drug Safety Software Market Value (US$ Mn), 2012-2016
FIG. 2 Global Pharmacovigilance and Drug Safety Software Market Value (US$ Mn) Forecast, 2017-2022
FIG. 3 Global Pharmacovigilance and Drug Safety Software Market Value (US$ Mn) and Y-o-Y, 2015-2022
FIG. 4 Global Adverse Event Reporting Software Segment Market Value (US$ Mn) By Region, 2012-2016
FIG. 5 Global Adverse Event Reporting Software Segment Market Value (US$ Mn) By Region, 2017-2022
FIG. 6 Global Adverse Event Reporting Software Segment Y-o-Y Growth Rate, By Region, 2015-2022
FIG. 7 Global Drug Safety Audits Software Segment Market Value (US$ Mn) By Region, 2012-2016
FIG. 8 Global Drug Safety Audits Software Segment Market Value (US$ Mn) By Region, 2017-2022
FIG. 9 Global Drug Safety Audits Software Segment Y-o-Y Growth Rate, By Region, 2015-2022
FIG. 10 Global Issue Tracking Software Segment Market Value (US$ Mn) By Region, 2012-2016
FIG. 11 Global Issue Tracking Software Segment Market Value (US$ Mn) By Region, 2017-2022
FIG. 12 Global Issue Tracking Software Segment Y-o-Y Growth Rate, By Region, 2015-2022
FIG. 13 Global Fully Integrated Software Segment Market Value (US$ Mn) By Region, 2012-2016
FIG. 14 Global Fully Integrated Software Segment Market Value (US$ Mn) By Region, 2017-2022
FIG. 15 Global Fully Integrated Software Segment Y-o-Y Growth Rate, By Region, 2015-2022
FIG. 16 Global Pharma and Biotech Companies Segment Market Value (US$ Mn) By Region, 2012-2016
FIG. 17 Global Pharma and Biotech Companies Segment Market Value (US$ Mn) By Region, 2017-2022
FIG. 18 Global Pharma and Biotech Companies Segment Y-o-Y Growth Rate, By Region, 2015-2022
FIG. 19 Global Contract Research Organizations (CROs) Segment Market Value (US$ Mn) By Region, 2012-2016
FIG. 20 Global Contract Research Organizations (CROs) Segment Market Value (US$ Mn) By Region, 2017-2022
FIG. 21 Global Contract Research Organizations (CROs) Segment Y-o-Y Growth Rate, By Region, 2015-2022
FIG. 22 Global Business Process Outsourcing (BPO) Firms Segment Market Value (US$ Mn) By Region, 2012-2016
FIG. 23 Global Business Process Outsourcing (BPO) Firms Segment Market Value (US$ Mn) By Region, 2017-2022
FIG. 24 Global Business Process Outsourcing (BPO) Firms Segment Y-o-Y Growth Rate, By Region, 2015-2022
FIG. 25 Global Other Pharmacovigilance Service Providers Segment Market Value (US$ Mn) By Region, 2012-2016
FIG. 26 Global Other Pharmacovigilance Service Providers Segment Market Value (US$ Mn) By Region, 2017-2022
FIG. 27 Global Other Pharmacovigilance Service Providers Segment Y-o-Y Growth Rate, By Region, 2015-2022
FIG. 28 Global On-premise Delivery Mode Segment Market Value (US$ Mn) By Region, 2012-2016
FIG. 29 Global On-premise Delivery Mode Segment Market Value (US$ Mn) By Region, 2017-2022
FIG. 30 Global On-premise Delivery Mode Segment Y-o-Y Growth Rate, By Region, 2015-2022
FIG. 31 Global Cloud-based Delivery Mode Segment Market Value (US$ Mn) By Region, 2012-2016
FIG. 32 Global Cloud-based Delivery Mode Segment Market Value (US$ Mn) By Region, 2017-2022
FIG. 33 Global Cloud-based Delivery Mode Segment Y-o-Y Growth Rate, By Region, 2015-2022
FIG. 34 North America Pharmacovigilance and Drug Safety Software Market Value (US$ Mn), By Software Type 2012-2016
FIG. 35 North America Pharmacovigilance and Drug Safety Software Market Value (US$ Mn), By Software Type 2017-2022
FIG. 36 North America Pharmacovigilance and Drug Safety Software Market Value (US$ Mn), By End User 2012-2016
FIG. 37 North America Pharmacovigilance and Drug Safety Software Market Value (US$ Mn), By End User 2017-2022
FIG. 38 North America Pharmacovigilance and Drug Safety Software Market Value (US$ Mn), By Delivery Mode 2012-2016
FIG. 39 North America Pharmacovigilance and Drug Safety Software Market Value (US$ Mn), By Delivery Mode 2017-2022
FIG. 40 Latin America Pharmacovigilance and Drug Safety Software Market Value (US$ Mn), By Software Type 2012-2016
FIG. 41 Latin America Pharmacovigilance and Drug Safety Software Market Value (US$ Mn), By Software Type 2017-2022
FIG. 42 Latin America Pharmacovigilance and Drug Safety Software Market Value (US$ Mn), By End User 2012-2016
FIG. 43 Latin America Pharmacovigilance and Drug Safety Software Market Value (US$ Mn), By End User 2017-2022
FIG. 44 Latin America Pharmacovigilance and Drug Safety Software Market Value (US$ Mn), By Delivery Mode 2012-2016
FIG. 45 Latin America Pharmacovigilance and Drug Safety Software Market Value (US$ Mn), By Delivery Mode 2017-2022
FIG. 46 Europe Pharmacovigilance and Drug Safety Software Market Value (US$ Mn), By Software Type 2012-2016
FIG. 47 Europe Pharmacovigilance and Drug Safety Software Market Value (US$ Mn), By Software Type 2017-2022
FIG. 48 Europe Pharmacovigilance and Drug Safety Software Market Value (US$ Mn), By End User 2012-2016
FIG. 49 Europe Pharmacovigilance and Drug Safety Software Market Value (US$ Mn), By End User 2017-2022
FIG. 50 Europe Pharmacovigilance and Drug Safety Software Market Value (US$ Mn), By Delivery Mode 2012-2016
FIG. 51 Europe Pharmacovigilance and Drug Safety Software Market Value (US$ Mn), By Delivery Mode 2017-2022
FIG. 52 Japan Pharmacovigilance and Drug Safety Software Market Value (US$ Mn), By Software Type 2012-2016
FIG. 53 Japan Pharmacovigilance and Drug Safety Software Market Value (US$ Mn), By Software Type 2017-2022
FIG. 54 Japan Pharmacovigilance and Drug Safety Software Market Value (US$ Mn), By End User 2012-2016
FIG. 55 Japan Pharmacovigilance and Drug Safety Software Market Value (US$ Mn), By End User 2017-2022
FIG. 56 Japan Pharmacovigilance and Drug Safety Software Market Value (US$ Mn), By Delivery Mode 2012-2016
FIG. 57 Japan Pharmacovigilance and Drug Safety Software Market Value (US$ Mn), By Delivery Mode 2017-2022
FIG. 58 APEJ Pharmacovigilance and Drug Safety Software Market Value (US$ Mn), By Software Type 2012-2016
FIG. 59 APEJ Pharmacovigilance and Drug Safety Software Market Value (US$ Mn), By Software Type 2017-2022
FIG. 60 APEJ Pharmacovigilance and Drug Safety Software Market Value (US$ Mn), By End User 2012-2016
FIG. 61 APEJ Pharmacovigilance and Drug Safety Software Market Value (US$ Mn), By End User 2017-2022
FIG. 62 APEJ Pharmacovigilance and Drug Safety Software Market Value (US$ Mn), By Delivery Mode 2012-2016
FIG. 63 APEJ Pharmacovigilance and Drug Safety Software Market Value (US$ Mn), By Delivery Mode 2017-2022
FIG. 64 MEA Pharmacovigilance and Drug Safety Software Market Value (US$ Mn), By Software Type 2012-2016
FIG. 65 MEA Pharmacovigilance and Drug Safety Software Market Value (US$ Mn), By Software Type 2017-2022
FIG. 66 MEA Pharmacovigilance and Drug Safety Software Market Value (US$ Mn), By End User 2012-2016
FIG. 67 MEA Pharmacovigilance and Drug Safety Software Market Value (US$ Mn), By End User 2017-2022
FIG. 68 MEA Pharmacovigilance and Drug Safety Software Market Value (US$ Mn), By Delivery Mode 2012-2016
FIG. 69 MEA Pharmacovigilance and Drug Safety Software Market Value (US$ Mn), By Delivery Mode 2017-2022
Copyright © Transparency Market Research, Inc. All Rights reserved
Trust Online

Pharmacovigilance and Drug Safety Software Market