
Reports
Reports
Analysts’ Viewpoint on Paper Straws Market Scenario
Manufacturers in the packaging industry are focusing on eliminating single-use plastic products from their portfolio. Companies are even replacing the complementary straws given with tetra packs. The paper straws market is estimated to witness significant growth in the upcoming years due to improved production capabilities. Instead of handmade bamboo straws, manufacturers may use manual machines to enhance their production capabilities. Furthermore, customization of bamboo straw semi-automatic machines may improve the overall production capacity of the manufacturers. The rate of manufacturing paper straws is also slow as compared to plastic straws. A typical paper straw machine can manufacture upto 200-300 straws/minute. In order to increase the share in the eco-friendly straw market, manufacturers need to enhance their manufacturing capabilities by using manual or semi-automatic straw machines.
According to the International Council of beverages Associations, 30% of the soft drinks that are sold across Europe are no- or low sugar beverages. The increasing demand for healthy food & beverage intake is expected to boost the growth of the global food & beverage industry. The United States is expected to retain its position in the global food & beverage industry. However, emerging countries such as India, China, and Thailand are projected to witness a high market growth in the upcoming years. Asia Pacific is the fastest growing region in terms of consumer spending on eating out, which is anticipated to trigger the usage of straws. Rise in the number of food outlets is expected to fuel the global food service industry during the forecast period.
Brand owners are realizing responsibilities associated with their business and thus, moving toward providing eco-friendly packaging products & cutlery to consumers. Manufacturers, brand owners, and retailers are offering sustainable packaging solutions that is reusable, recyclable, or biodegradable. For instance, in 2021, Sun-Rype Products, a division of A. Lassonde Inc., a Canadian fruit-based food & beverage manufacturer, announced that they have replaced plastic straws with recyclable, bendable paper straws on all SunRype 200ml single-serve beverage boxes in Canada. This includes all of SunRype’s 200ml 100 per cent juice, and 200ml 60 per cent less sugar juice products.
Apart from full service restaurants, fast food & beverage outlets and separate beverage outlets are also trending. Moreover, increase in consumption of alcoholic and non-alcoholic beverages is expected to create a significant demand for straws during the forecast period.
Paper straws are replacing plastic straws; however, the efficiency of the paper straw machines is very less as compared to the plastic straw machines. Manufacturers are looking forward to increasing per-minute capabilities of the paper straw machines. Leading players in the packaging industry can increase the number of straws manufactured per hour by using efficient and high-speed machines. Hence, to meet consumer requirements and replace plastic straws completely, manufacturers should enhance their production capabilities in terms of paper imports and machine usage. Increase in the usage of high-speed machinery is expected to influence the paper straws market drastically.
In order to differentiate product offerings and increase consumer appeal of any product, manufacturers are providing a wide range of paper straws, which include different prints, straw length, and diameters. As corporates are banning plastic straws, manufacturers are refining their strategies to make the most of the lucrative growth opportunities in the upcoming years. Brand owners are customizing straws with brand logos and taglines to use them as an eye-catchy branding tool for the packaging industry. Key marketing strategies of the brand owners in the food service industry are expected to fuel the paper straws market growth.
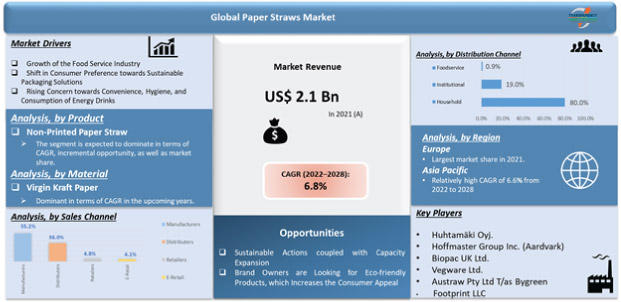
In terms of material, the virgin Kraft paper segment was valued at US$ 1.7 Bn in 2021 and is set to grow at the fastest CAGR from 2022 to 2028. The virgin Kraft paper segment is expected to dominate in terms of CAGR, incremental opportunity, as well as market share. This segment is expected to create an incremental opportunity of US$ 2.6 Bn by the end of the forecast period. The recycled paper segment is anticipated to grow 2.2x of its current value by 2028.
Based on product, the printed paper straw segment is expected to dominate in terms of CAGR in the upcoming years. The non-printed paper straw segment of the global paper straws market is expected to create an incremental opportunity of US$ 2.1 Bn by the end of the forecast period.
In terms of sales channel, the manufacturers segment is expected to dominate in terms of CAGR and incremental opportunity in the upcoming years. The manufacturers segment of the global paper straws market is expected to create an incremental opportunity of US$ 1.9 Bn by the end of the forecast period. The e-retail segment is estimated to grow at a CAGR of 5.4% in the global paper straws market.
The global spread of the COVID-19 virus has a mixed impact on the paper straws market. Shutdown of food service outlets and restaurants, and interruption in supply chain management reduced the demand and supply of paper straws in the market. However, there is a rising trend of online food ordering and increasing need for paper straws in hospitals for liquid medicines consumption, which is boosting the sales of paper straws.
Drinking straws play an important role in helping people enjoy their cold beverages. For instance, Huhtamaki offers the opportunity to switch to using non-plastic straws while serving cold drinks to their customers. Safe and natural paper straws are a sustainable and responsible choice to serve drinks. Their unprinted straws are made of food grade paper holding leading food safety certifications, including FDA, and have been tested and certified for food safety in Europe, China, and the United States. The paper substrate in use is certified for direct food contact by ISEGA in Germany. Their paper straws are crafted to ensure strength, reliability, and functionality with purpose-built European machinery. Consumer are switching to paper straws from Huhtamaki to serve cold beverages with drinking straws with premium product quality and superior performance, that are odor- and taint-free.
The global paper straws market as led by North America in 2021. The market in the region is anticipated to grow at a CAGR of 3.2% from 2022 to 2028. The growth of the market in North America can be attributed to the early adoption of paper as a material for sustainable trend.
Recently, the British government stated that it planned to ban the sale of single-use plastics, including straws. The European Union followed suit in late May. In France, the burger giant is testing alternatives. The Hilton hotel giant in May vowed to remove the offenders from its 650 properties.
In India's commercial capital Mumbai, Burger King, McDonald's, and Starbucks were fined for violating a ban on single use plastics, an official said earlier in June. India's Prime Minister has pledged to make his country free of single use plastic by 2022.
The paper straws market report concludes with the company profiles section, which includes key information about major players in the global paper straws market. Leading players analyzed in the report include Advanced Oncotherapy plc, Huhtamäki Oyj, Hoffmaster Group Inc. (Aardvark), Biopac UK Ltd., Vegware Ltd., U.S. Paper Straw, The Paper Straw Co., Austraw Pty Ltd T/as Bygreen, Footprint LLC, Okstraw, Transcend Packaging Ltd., PT. Strawland, TIPI Straws, MPM Marketing Services Pty Ltd, Canada Brown Eco Products Ltd., Aleco Straws Co. Ltd., Zhengzhou Gstar Plastics Co.,Ltd, YIWU JinDong Paper Co., Ltd., Sharp Serviettes, GP Paper Straw Sdn Bhd, and The Blue Straw.
Each of these players has been profiled in the paper straws market report based on parameters such as company overview, financial overview, business strategies, application portfolio, business segments, and recent developments
|
Attribute |
Detail |
|
Market Size Value in 2021 |
US$ 2.1 Bn |
|
Market Forecast Value in 2028 |
US$ 5.2 Bn |
|
Growth Rate (CAGR) |
6.8% from Year-to-Year |
|
Forecast Period |
2022–2028 |
|
Quantitative Units |
US$ Mn for Value |
|
Market Analysis |
It includes cross segment analysis at global as well as regional level. Moreover, qualitative analysis includes drivers, restraints, opportunities, key trends, and parent industry overview. |
|
Competition Landscape |
|
|
Format |
Electronic (PDF) + Excel |
|
Market Segmentation |
|
|
Regions Covered |
|
|
Countries Covered |
|
|
Companies Profiled |
|
|
Customization Scope |
Available upon request |
|
Pricing |
Available upon request |
Paper straws market was valued at US$ 2.1 Bn in 2021 and expected to exceed US$ 5.2 Bn by 2028
Paper straws market is expected to grow at a CAGR of 6.8% during the forecast period
Shift in consumer preference toward sustainable packaging solutions is projected to drive the market
The paper straws market in North America is likely to grow at the fastest CAGR during the forecast period
The food service segment is likely to generate highest revenue in 2028
Huhtamäki Oyj., Hoffmaster Group Inc. (Aardvark), Biopac UK Ltd., Vegware Ltd., and U.S. Paper Straw are prominent players in the global paper straws market
1. Executive Summary
1.1. Market Overview
1.2. Market Analysis
1.3. TMR Analysis and Recommendations
2. Market Viewpoint
2.1. Market Definition
2.2. Market Taxonomy
3. Paper Straws Market Overview
3.1. Introduction
3.2. Global Packaging Market Overview
3.3. Global Rigid Packaging Market Outlook
3.4. Global Food & beverages Sector Outlook
3.5. Macro-economic Factors – Correlation Analysis
3.6. Forecast Factors – Relevance & Impact
3.7. Paper Straws Market Value Chain Analysis
3.7.1. Exhaustive List of Active Participants
3.7.1.1. Raw Material Suppliers
3.7.1.2. Manufacturers
3.7.1.3. Distributors/Retailers
3.7.1.4. End-users/Customers
3.7.2. Profitability Margins
4. Impact of COVID-19
4.1. Current Statistics and Probable Future Impact
4.2. Impact of COVID-19 on Packaging Industry
5. Paper Straws Market Analysis
5.1. Pricing Analysis
5.1.1. Pricing Assumption
5.1.2. Price Projections By Product
5.2. Market Size (US$ Mn) and Forecast
5.2.1. Market Size and Y-o-Y Growth
5.2.2. Absolute $ Opportunity
6. Paper Straws Market Dynamics
6.1. Drivers
6.2. Restraints
6.3. Opportunity Analysis
6.4. Trends
7. Global Paper Straws Market Analysis and Forecast, by Product
7.1. Introduction
7.1.1. Market share and Basis Points (BPS) Analysis, by Product
7.1.2. Y-o-Y Growth Projections, by Product
7.2. Historical Market Value (US$ Mn) and Volume (Mn Units), 2015-2021, by Product
7.2.1. Printed Paper Straw
7.2.2. Non-Printed Paper Straw
7.3. Market Size (US$ Mn) and Volume (Mn Units) Forecast Analysis 2022-2028, by Product
7.3.1. Printed Paper Straw
7.3.2. Non-Printed Paper Straw
7.4. Market Attractiveness Analysis, by Product
8. Global Paper Straws Market Analysis and Forecast, by Material
8.1. Introduction
8.1.1. Market share and Basis Points (BPS) Analysis, by Material
8.1.2. Y-o-Y Growth Projections, by Material
8.2. Historical Market Value (US$ Mn) and Volume (Mn Units), 2015-2021, by Material
8.2.1. Virgin Kraft Paper
8.2.2. Recycled Paper
8.3. Market Size (US$ Mn) and Volume (Mn Units) Forecast Analysis 2022-2028, by Material
8.3.1. Virgin Kraft Paper
8.3.2. Recycled Paper
8.4. Market Attractiveness Analysis, by Material
9. Global Paper Straws Market Analysis and Forecast, by Straw Length
9.1. Introduction
9.1.1. Market share and Basis Points (BPS) Analysis, by Straw Length
9.1.2. Y-o-Y Growth Projections, by Straw Length
9.2. Historical Market Value (US$ Mn) and Volume (Mn Units), 2015-2021, by Straw Length
9.2.1. Less than 07 cm
9.2.2. 08 - 10 cm
9.2.3. 11 - 15 cm
9.2.4. More than 15 cm
9.3. Market Size (US$ Mn) and Volume (Mn Units) Forecast Analysis 2022-2028, by Straw Length
9.3.1. Less than 07 cm
9.3.2. 08 - 10 cm
9.3.3. 11 - 15 cm
9.3.4. More than 15 cm
9.4. Market Attractiveness Analysis, by Straw Length
10. Global Paper Straws Market Analysis and Forecast, by Sales Channel
10.1. Introduction
10.1.1. Market share and Basis Points (BPS) Analysis, by Sales Channel
10.1.2. Y-o-Y Growth Projections, by Sales Channel
10.2. Historical Market Value (US$ Mn) and Volume (Mn Units), 2015-2021, by Sales Channel
10.2.1. Manufacturers
10.2.2. Distributers
10.2.3. Retailers
10.2.3.1. Hypermarket
10.2.3.2. Supermarket
10.2.3.3. Convenience Stores
10.2.3.4. Specialty Stores
10.2.3.5. Discount Stores
10.2.4. E-Retail
10.3. Market Size (US$ Mn) and Volume (Mn Units) Forecast Analysis 2022-2028, by Sales Channel
10.3.1. Manufacturers
10.3.2. Distributers
10.3.3. Retailers
10.3.3.1. Hypermarket
10.3.3.2. Supermarket
10.3.3.3. Convenience Stores
10.3.3.4. Specialty Stores
10.3.4. Discount Stores
10.3.5. E-Retail
10.4. Market Attractiveness Analysis, by Sales Channel
11. Global Paper Straws Market Analysis and Forecast, by End Use
11.1. Introduction
11.1.1. Market share and Basis Points (BPS) Analysis, by End Use
11.1.2. Y-o-Y Growth Projections, by End Use
11.2. Historical Market Value (US$ Mn) and Volume (Mn Units), 2015-2021, by End Use
11.2.1. Foodservice
11.2.1.1. Hotels
11.2.1.2. Restaurants & Motels
11.2.1.3. Bars & Lounges
11.2.1.4. Cafes
11.2.1.5. Fast Food Outlets
11.2.1.6. Cinemas
11.2.1.7. Airline & Railway
11.2.2. Institutional
11.2.2.1. Educational
11.2.2.2. Healthcare
11.2.2.3. Corporate
11.2.3. Household
11.3. Market Size (US$ Mn) and Volume (Mn Units) Forecast Analysis 2022-2028, by End Use
11.3.1. Foodservice
11.3.1.1. Hotels
11.3.1.2. Restaurants & Motels
11.3.1.3. Bars & Lounges
11.3.1.4. Cafes
11.3.1.5. Fast Food Outlets
11.3.1.6. Cinemas
11.3.1.7. Airline & Railway
11.3.2. Institutional
11.3.2.1. Educational
11.3.2.2. Healthcare
11.3.2.3. Corporate
11.3.3. Household
11.4. Market Attractiveness Analysis, by End Use
12. Global Paper Straws Market Analysis and Forecast, By Region
12.1. Introduction
12.1.1. Market share and Basis Points (BPS) Analysis By Region
12.1.2. Y-o-Y Growth Projections By Region
12.2. Historical Market Value (US$ Mn) and Volume (Mn Units), 2015-2021, By Region
12.2.1. North America
12.2.2. Latin America
12.2.3. Europe
12.2.4. Asia Pacific (APAC)
12.2.5. Middle East and Africa (MEA)
12.3. Market Size (US$ Mn) and Volume (Mn Units) Forecast Analysis 2022-2028 By Region
12.3.1. North America
12.3.2. Latin America
12.3.3. Europe
12.3.4. Asia Pacific (APAC)
12.3.5. Middle East and Africa (MEA)
12.4. Market Attractiveness Analysis By Region
13. North America Paper Straws Market Analysis and Forecast
13.1. Introduction
13.1.1. Market share and Basis Points (BPS) Analysis, By Country
13.1.2. Y-o-Y Growth Projections, By Country
13.2. Historical Market Value (US$ Mn) and Volume (Mn Units), 2015-2021, By Country
13.3. Market Size (US$ Mn) and Volume (Mn Units) Forecast Analysis 2022-2028, By Country
13.3.1. U.S.
13.3.2. Canada
13.4. Historical Market Value (US$ Mn) and Volume (Mn Units), 2015-2021, By Product
13.5. Market Size (US$ Mn) and Volume (Mn Units) Forecast Analysis 2022-2028, By Product
13.5.1. Printed Paper Straw
13.5.2. Non-Printed Paper Straw
13.6. Historical Market Value (US$ Mn) and Volume (Mn Units), 2015-2021, By Material
13.7. Market Size (US$ Mn) and Volume (Mn Units) Forecast Analysis 2022-2028, By Material
13.7.1. Virgin Kraft Paper
13.7.2. Recycled Paper
13.8. Historical Market Value (US$ Mn) and Volume (Mn Units), 2015-2021, By Straw Length
13.9. Market Size (US$ Mn) and Volume (Mn Units) Forecast Analysis 2022-2028, By Straw Length
13.9.1. Less than 07 cm
13.9.2. 08 - 10 cm
13.9.3. 11 - 15 cm
13.9.4. More than 15 cm
13.10. Historical Market Value (US$ Mn) and Volume (Mn Units), 2015-2021, By End Use
13.11. Market Size (US$ Mn) and Volume (Mn Units) Forecast Analysis 2022-2028, By End Use
13.11.1. Manufacturers
13.11.2. Distributers
13.11.3. Retailers
13.11.3.1. Hypermarket
13.11.3.2. Supermarket
13.11.3.3. Convenience Stores
13.11.3.4. Specialty Stores
13.11.3.5. Discount Stores
13.11.4. E-Retail
13.12. Market Attractiveness Analysis
13.12.1. By Country
13.12.2. By Product
13.12.3. By Material
13.12.4. By Straw Length
13.12.5. By Sales Channel
13.12.6. By End Use
14. Latin America Paper Straws Market Analysis and Forecast
14.1. Introduction
14.1.1. Market share and Basis Points (BPS) Analysis, By Country
14.1.2. Y-o-Y Growth Projections, By Country
14.2. Historical Market Value (US$ Mn) and Volume (Mn Units), 2015-2021, By Country
14.3. Market Size (US$ Mn) and Volume (Mn Units) Forecast Analysis 2022-2028, By Country
14.3.1. Brazil
14.3.2. Mexico
14.3.3. Argentina
14.3.4. Rest of Latin America
14.4. Historical Market Value (US$ Mn) and Volume (Mn Units), 2015-2021, By Product
14.5. Market Size (US$ Mn) and Volume (Mn Units) Forecast Analysis 2022-2028, By Product
14.5.1. Printed Paper Straw
14.5.2. Non-Printed Paper Straw
14.6. Historical Market Value (US$ Mn) and Volume (Mn Units), 2015-2021, By Material
14.7. Market Size (US$ Mn) and Volume (Mn Units) Forecast Analysis 2022-2028, By Material
14.7.1. Virgin Kraft Paper
14.7.2. Recycled Paper
14.8. Historical Market Value (US$ Mn) and Volume (Mn Units), 2015-2021, By Straw Length
14.9. Market Size (US$ Mn) and Volume (Mn Units) Forecast Analysis 2022-2028, By Straw Length
14.9.1. Less than 07 cm
14.9.2. 08 - 10 cm
14.9.3. 11 - 15 cm
14.9.4. More than 15 cm
14.10. Historical Market Value (US$ Mn) and Volume (Mn Units), 2015-2021, By End Use
14.11. Market Size (US$ Mn) and Volume (Mn Units) Forecast Analysis 2022-2028, By End Use
14.11.1. Manufacturers
14.11.2. Distributers
14.11.3. Retailers
14.11.3.1. Hypermarket
14.11.3.2. Supermarket
14.11.3.3. Convenience Stores
14.11.3.4. Specialty Stores
14.11.3.5. Discount Stores
14.11.4. E-Retail
14.12. Market Attractiveness Analysis
14.12.1. By Country
14.12.2. By Product
14.12.3. By Material
14.12.4. By Straw Length
14.12.5. By Sales Channel
14.12.6. By End Use
15. Europe Paper Straws Market Analysis and Forecast
15.1. Introduction
15.1.1. Market share and Basis Points (BPS) Analysis, By Country
15.1.2. Y-o-Y Growth Projections, By Country
15.2. Historical Market Value (US$ Mn) and Volume (Mn Units), 2015-2021, By Country
15.3. Market Size (US$ Mn) and Volume (Mn Units) Forecast Analysis 2022-2028, By Country
15.3.1. Germany
15.3.2. Spain
15.3.3. Italy
15.3.4. France
15.3.5. U.K.
15.3.6. Benelux
15.3.7. Nordic
15.3.8. Russia
15.3.9. Poland
15.3.10. Rest of Europe
15.4. Historical Market Value (US$ Mn) and Volume (Mn Units), 2015-2021, By Product
15.5. Market Size (US$ Mn) and Volume (Mn Units) Forecast Analysis 2022-2028, By Product
15.5.1. Printed Paper Straw
15.5.2. Non-Printed Paper Straw
15.6. Historical Market Value (US$ Mn) and Volume (Mn Units), 2015-2021, By Material
15.7. Market Size (US$ Mn) and Volume (Mn Units) Forecast Analysis 2022-2028, By Material
15.7.1. Virgin Kraft Paper
15.7.2. Recycled Paper
15.8. Historical Market Value (US$ Mn) and Volume (Mn Units), 2015-2021, By Straw Length
15.9. Market Size (US$ Mn) and Volume (Mn Units) Forecast Analysis 2022-2028, By Straw Length
15.9.1. Less than 07 cm
15.9.2. 08 - 10 cm
15.9.3. 11 - 15 cm
15.9.4. More than 15 cm
15.10. Historical Market Value (US$ Mn) and Volume (Mn Units), 2015-2021, By End Use
15.11. Market Size (US$ Mn) and Volume (Mn Units) Forecast Analysis 2022-2028, By End Use
15.11.1. Manufacturers
15.11.2. Distributers
15.11.3. Retailers
15.11.3.1. Hypermarket
15.11.3.2. Supermarket
15.11.3.3. Convenience Stores
15.11.3.4. Specialty Stores
15.11.3.5. Discount Stores
15.11.4. E-Retail
15.12. Market Attractiveness Analysis
15.12.1. By Country
15.12.2. By Product
15.12.3. By Material
15.12.4. By Straw Length
15.12.5. By Sales Channel
15.12.6. By End Use
16. Asia Pacific Paper Straws Market Analysis and Forecast
16.1. Introduction
16.1.1. Market share and Basis Points (BPS) Analysis, By Country
16.1.2. Y-o-Y Growth Projections, By Country
16.2. Historical Market Value (US$ Mn) and Volume (Mn Units), 2015-2021, By Country
16.3. Market Size (US$ Mn) and Volume (Mn Units) Forecast Analysis 2022-2028, By Country
16.3.1. China
16.3.2. India
16.3.3. Japan
16.3.4. South Korea
16.3.5. ASEAN
16.3.6. Australia & New Zealand
16.3.7. Rest of Asia Pacific
16.4. Historical Market Value (US$ Mn) and Volume (Mn Units), 2015-2021, By Product
16.5. Market Size (US$ Mn) and Volume (Mn Units) Forecast Analysis 2022-2028, By Product
16.5.1. Printed Paper Straw
16.5.2. Non-Printed Paper Straw
16.6. Historical Market Value (US$ Mn) and Volume (Mn Units), 2015-2021, By Material
16.7. Market Size (US$ Mn) and Volume (Mn Units) Forecast Analysis 2022-2028, By Material
16.7.1. Virgin Kraft Paper
16.7.2. Recycled Paper
16.8. Historical Market Value (US$ Mn) and Volume (Mn Units), 2015-2021, By Straw Length
16.9. Market Size (US$ Mn) and Volume (Mn Units) Forecast Analysis 2022-2028, By Straw Length
16.9.1. Less than 07 cm
16.9.2. 08 - 10 cm
16.9.3. 11 - 15 cm
16.9.4. More than 15 cm
16.10. Historical Market Value (US$ Mn) and Volume (Mn Units), 2015-2021, By End Use
16.11. Market Size (US$ Mn) and Volume (Mn Units) Forecast Analysis 2022-2028, By End Use
16.11.1. Manufacturers
16.11.2. Distributers
16.11.3. Retailers
16.11.3.1. Hypermarket
16.11.3.2. Supermarket
16.11.3.3. Convenience Stores
16.11.3.4. Specialty Stores
16.11.3.5. Discount Stores
16.11.4. E-Retail
16.12. Market Attractiveness Analysis
16.12.1. By Country
16.12.2. By Product
16.12.3. By Material
16.12.4. By Straw Length
16.12.5. By Sales Channel
16.12.6. By End Use
17. Middle East & Africa Paper Straws Market Analysis and Forecast
17.1. Introduction
17.1.1. Market share and Basis Points (BPS) Analysis, By Country
17.1.2. Y-o-Y Growth Projections, By Country
17.2. Historical Market Value (US$ Mn) and Volume (Mn Units), 2015-2021, By Country
17.3. Market Size (US$ Mn) and Volume (Mn Units) Forecast Analysis 2022-2028, By Country
17.3.1. North Africa
17.3.2. South Africa
17.3.3. Turkey
17.3.4. GCC
17.3.5. Israel
17.3.6. Rest of MEA
17.4. Historical Market Value (US$ Mn) and Volume (Mn Units), 2015-2021, By Product
17.5. Market Size (US$ Mn) and Volume (Mn Units) Forecast Analysis 2022-2028, By Product
17.5.1. Printed Paper Straw
17.5.2. Non-Printed Paper Straw
17.6. Historical Market Value (US$ Mn) and Volume (Mn Units), 2015-2021, By Material
17.7. Market Size (US$ Mn) and Volume (Mn Units) Forecast Analysis 2022-2028, By Material
17.7.1. Virgin Kraft Paper
17.7.2. Recycled Paper
17.8. Historical Market Value (US$ Mn) and Volume (Mn Units), 2015-2021, By Straw Length
17.9. Market Size (US$ Mn) and Volume (Mn Units) Forecast Analysis 2022-2028, By Straw Length
17.9.1. Less than 07 cm
17.9.2. 08 - 10 cm
17.9.3. 11 - 15 cm
17.9.4. More than 15 cm
17.10. Historical Market Value (US$ Mn) and Volume (Mn Units), 2015-2021, By End Use
17.11. Market Size (US$ Mn) and Volume (Mn Units) Forecast Analysis 2022-2028, By End Use
17.11.1. Manufacturers
17.11.2. Distributers
17.11.3. Retailers
17.11.3.1. Hypermarket
17.11.3.2. Supermarket
17.11.3.3. Convenience Stores
17.11.3.4. Specialty Stores
17.11.3.5. Discount Stores
17.11.4. E-Retail
17.12. Market Attractiveness Analysis
17.12.1. By Country
17.12.2. By Product
17.12.3. By Material
17.12.4. By Straw Length
17.12.5. By Sales Channel
17.12.6. By End Use
18. Country-wise Analysis and Forecast for Paper Straws Market
18.1. United States (U.S.) Paper Straws Market Analysis 2022 & 2028
18.1.1. Market Value (US$ Mn) & Volume (Mn Units) Analysis and Forecast by Market Taxonomy
18.1.1.1. By Product
18.1.1.2. By Material
18.1.1.3. By Straw Length
18.1.1.4. By Sales Channel
18.1.1.5. By End Use
18.2. Brazil Paper Straws Market Analysis 2022 & 2028
18.2.1. Market Value (US$ Mn) & Volume (Mn Units) Analysis and Forecast by Market Taxonomy
18.2.1.1. By Product
18.2.1.2. By Material
18.2.1.3. By Straw Length
18.2.1.4. By Sales Channel
18.2.1.5. By End Use
18.3. Mexico Paper Straws Market Analysis 2022 & 2028
18.3.1. Market Value (US$ Mn) & Volume (Mn Units) Analysis and Forecast by Market Taxonomy
18.3.1.1. By Product
18.3.1.2. By Material
18.3.1.3. By Straw Length
18.3.1.4. By Sales Channel
18.3.1.5. By End Use
18.4. Germany Paper Straws Market Analysis 2022 & 2028
18.4.1. Market Value (US$ Mn) & Volume (Mn Units) Analysis and Forecast by Market Taxonomy
18.4.1.1. By Product
18.4.1.2. By Material
18.4.1.3. By Straw Length
18.4.1.4. By Sales Channel
18.4.1.5. By End Use
18.5. France Paper Straws Market Analysis 2022 & 2028
18.5.1. Market Value (US$ Mn) & Volume (Mn Units) Analysis and Forecast by Market Taxonomy
18.5.1.1. By Product
18.5.1.2. By Material
18.5.1.3. By Straw Length
18.5.1.4. By Sales Channel
18.5.1.5. By End Use
18.6. United Kingdom (U.K.) Paper Straws Market Analysis 2022 & 2028
18.6.1. Market Value (US$ Mn) & Volume (Mn Units) Analysis and Forecast by Market Taxonomy
18.6.1.1. By Product
18.6.1.2. By Material
18.6.1.3. By Straw Length
18.6.1.4. By Sales Channel
18.6.1.5. By End Use
18.7. Russia Paper Straws Market Analysis 2022 & 2028
18.7.1. Market Value (US$ Mn) & Volume (Mn Units) Analysis and Forecast by Market Taxonomy
18.7.1.1. By Product
18.7.1.2. By Material
18.7.1.3. By Straw Length
18.7.1.4. By Sales Channel
18.7.1.5. By End Use
18.8. China Paper Straws Market Analysis 2022 & 2028
18.8.1. Market Value (US$ Mn) & Volume (Mn Units) Analysis and Forecast by Market Taxonomy
18.8.1.1. By Product
18.8.1.2. By Material
18.8.1.3. By Straw Length
18.8.1.4. By Sales Channel
18.8.1.5. By End Use
18.9. India Paper Straws Market Analysis 2022 & 2028
18.9.1. Market Value (US$ Mn) & Volume (Mn Units) Analysis and Forecast by Market Taxonomy
18.9.1.1. By Product
18.9.1.2. By Material
18.9.1.3. By Straw Length
18.9.1.4. By Sales Channel
18.9.1.5. By End Use
18.10. Japan Paper Straws Market Analysis 2022 & 2028
18.10.1. Market Value (US$ Mn) & Volume (Mn Units) Analysis and Forecast by Market Taxonomy
18.10.1.1. By Product
18.10.1.2. By Material
18.10.1.3. By Straw Length
18.10.1.4. By Sales Channel
18.10.1.5. By End Use
18.11. GCC Countries Paper Straws Market Analysis 2022 & 2028
18.11.1. Market Value (US$ Mn) & Volume (Mn Units) Analysis and Forecast by Market Taxonomy
18.11.1.1. By Product
18.11.1.2. By Material
18.11.1.3. By Straw Length
18.11.1.4. By Sales Channel
18.11.1.5. By End Use
18.12. Northern Africa Paper Straws Market Analysis 2022 & 2028
18.12.1. Market Value (US$ Mn) & Volume (Mn Units) Analysis and Forecast by Market Taxonomy
18.12.1.1. By Product
18.12.1.2. By Material
18.12.1.3. By Straw Length
18.12.1.4. By Sales Channel
18.12.1.5. By End Use
19. Competitive Landscape
19.1. Market Structure
19.2. Competition Dashboard
19.3. Company Market Share Analysis
19.4. Company Profiles (Details – Overview, Financials, Strategy, Recent Developments, SWOT analysis)
19.5. Competition Deep Dive
19.5.1. Huhtamäki Oyj.
19.5.1.1. Overview
19.5.1.2. Financials
19.5.1.3. Strategy
19.5.1.4. Recent Developments
19.5.1.5. SWOT Analysis
19.5.2. Hoffmaster Group Inc. (Aardvark)
19.5.2.1. Overview
19.5.2.2. Financials
19.5.2.3. Strategy
19.5.2.4. Recent Developments
19.5.2.5. SWOT Analysis
19.5.3. Biopac UK Ltd.
19.5.3.1. Overview
19.5.3.2. Financials
19.5.3.3. Strategy
19.5.3.4. Recent Developments
19.5.3.5. SWOT Analysis
19.5.4. Vegware Ltd.
19.5.4.1. Overview
19.5.4.2. Financials
19.5.4.3. Strategy
19.5.4.4. Recent Developments
19.5.4.5. SWOT Analysis
19.5.5. U.S. Paper Straw
19.5.5.1. Overview
19.5.5.2. Financials
19.5.5.3. Strategy
19.5.5.4. Recent Developments
19.5.5.5. SWOT Analysis
19.5.6. The Paper Straw Co.
19.5.6.1. Overview
19.5.6.2. Financials
19.5.6.3. Strategy
19.5.6.4. Recent Developments
19.5.6.5. SWOT Analysis
19.5.7. Austraw Pty Ltd T/as Bygreen
19.5.7.1. Overview
19.5.7.2. Financials
19.5.7.3. Strategy
19.5.7.4. Recent Developments
19.5.7.5. SWOT Analysis
19.5.8. Footprint LLC
19.5.8.1. Overview
19.5.8.2. Financials
19.5.8.3. Strategy
19.5.8.4. Recent Developments
19.5.8.5. SWOT Analysis
19.5.9. Okstraw
19.5.9.1. Overview
19.5.9.2. Financials
19.5.9.3. Strategy
19.5.9.4. Recent Developments
19.5.9.5. SWOT Analysis
19.5.10. Transcend Packaging Ltd.
19.5.10.1. Overview
19.5.10.2. Financials
19.5.10.3. Strategy
19.5.10.4. Recent Developments
19.5.10.5. SWOT Analysis
19.5.11. PT. Strawland
19.5.11.1. Overview
19.5.11.2. Financials
19.5.11.3. Strategy
19.5.11.4. Recent Developments
19.5.11.5. SWOT Analysis
19.5.12. TIPI Straws
19.5.12.1. Overview
19.5.12.2. Financials
19.5.12.3. Strategy
19.5.12.4. Recent Developments
19.5.12.5. SWOT Analysis
19.5.13. MPM Marketing Services Pty Ltd
19.5.13.1. Overview
19.5.13.2. Financials
19.5.13.3. Strategy
19.5.13.4. Recent Developments
19.5.13.5. SWOT Analysis
19.5.14. Canada Brown Eco Products Ltd.
19.5.14.1. Overview
19.5.14.2. Financials
19.5.14.3. Strategy
19.5.14.4. Recent Developments
19.5.14.5. SWOT Analysis
19.5.15. Aleco Straws Co. Ltd.
19.5.15.1. Overview
19.5.15.2. Financials
19.5.15.3. Strategy
19.5.15.4. Recent Developments
19.5.15.5. SWOT Analysis
19.5.16. Zhengzhou Gstar Plastics Co.,Ltd
19.5.16.1. Overview
19.5.16.2. Financials
19.5.16.3. Strategy
19.5.16.4. Recent Developments
19.5.16.5. SWOT Analysis
19.5.17. YIWU JinDong Paper Co., Ltd.
19.5.17.1. Overview
19.5.17.2. Financials
19.5.17.3. Strategy
19.5.17.4. Recent Developments
19.5.17.5. SWOT Analysis
19.5.18. Sharp Serviettes
19.5.18.1. Overview
19.5.18.2. Financials
19.5.18.3. Strategy
19.5.18.4. Recent Developments
19.5.18.5. SWOT Analysis
19.5.19. GP Paper Straw Sdn Bhd
19.5.19.1. Overview
19.5.19.2. Financials
19.5.19.3. Strategy
19.5.19.4. Recent Developments
19.5.19.5. SWOT Analysis
19.5.20. The Blue Straw
19.5.20.1. Overview
19.5.20.2. Financials
19.5.20.3. Strategy
19.5.20.4. Recent Developments
19.5.20.5. SWOT Analysis
20. Assumptions and Acronyms Used
21. Research Methodology
List of Table
Table 01: Global Paper Straws Market Value (US$ Mn) and Volume (Mn Units) 2015-2028, by Material Type
Table 02: Global Paper Straws Market Value (US$ Mn) and Volume (Mn Units) 2015-2028, by Product Type
Table 03: Global Paper Straws Market Value (US$ Mn) and Volume (Mn Units) 2015-2028, by Straw Length
Table 04: Global Paper Straws Market Value (US$ Mn) and Volume (Mn Units) 2015-2028, by Sales Channel
Table 05: Global Paper Straws Market Value (US$ Mn) and Volume (Mn Units) 2015-2028, by Retailers Sub-segments
Table 06: Global Paper Straws Market Value (US$ Mn) and Volume (Mn Units) 2015-2028, by End Use
Table 07: Global Paper Straws Market Value (US$ Mn) and Volume (Mn Units) 2015-2028, by Food Service Sub-segments (1/2)
Table 08: Global Paper Straws Market Value (US$ Mn) and Volume (Mn Units) 2015-2028, by Food Service Sub-segments (2/2)
Table 09: Global Paper Straws Market Value (US$ Mn) and Volume (Mn Units) 2015-2028, by Institutional Sub-segments
Table 10: Global Paper Straws Market Value (US$ Mn) and Volume (Mn Units) 2015-2028, by Region
Table 11: North America Paper Straws Market Value (US$ Mn) and Volume (Mn Units) 2015-2028, by Country
Table 12: North America Paper Straws Market Value (US$ Mn) and Volume (Mn Units) 2015-2028, by Material Type
Table 13: North America Paper Straws Market Value (US$ Mn) and Volume (Mn Units) 2015-2028, by Product Type
Table 14: North America Paper Straws Market Value (US$ Mn) and Volume (Mn Units) 2015-2028, by Straw Length
Table 15: North America Paper Straws Market Value (US$ Mn) and Volume (Mn Units) 2015-2028, by Sales Channel
Table 16: North America Paper Straws Market Value (US$ Mn) and Volume (Mn Units) 2015-2028, by Retailers Sub-segments
Table 17: North America Paper Straws Market Value (US$ Mn) and Volume (Mn Units) 2015-2028, by End Use
Table 18: North America Paper Straws Market Value (US$ Mn) and Volume (Mn Units) 2015-2028, by Food Service Sub-segments (1/2)
Table 19: North America Paper Straws Market Value (US$ Mn) and Volume (Mn Units) 2015-2028, by Food Service Sub-segments (2/2)
Table 20: North America Paper Straws Market Value (US$ Mn) and Volume (Mn Units) 2015-2028, by Institutional Sub-segments
Table 21: Latin America Paper Straws Market Value (US$ Mn) and Volume (Mn Units) 2015-2028, by Country
Table 22: Latin America Paper Straws Market Value (US$ Mn) and Volume (Mn Units) 2015-2028, by Material Type
Table 23: Latin America Paper Straws Market Value (US$ Mn) and Volume (Mn Units) 2015-2028, by Product Type
Table 24: Latin America Paper Straws Market Value (US$ Mn) and Volume (Mn Units) 2015-2028, by Straw Length
Table 25: Latin America Paper Straws Market Value (US$ Mn) and Volume (Mn Units) 2015-2028, by Sales Channel
Table 26: Latin America Paper Straws Market Value (US$ Mn) and Volume (Mn Units) 2015-2028, by Retailers Sub-segments
Table 27: Latin America Paper Straws Market Value (US$ Mn) and Volume (Mn Units) 2015-2028, by End Use
Table 28: Latin America Paper Straws Market Value (US$ Mn) and Volume (Mn Units) 2015-2028, by Food Service Sub-segments (1/2)
Table 29: Latin America Paper Straws Market Value (US$ Mn) and Volume (Mn Units) 2015-2028, by Food Service Sub-segments (2/2)
Table 30: Latin America Paper Straws Market Value (US$ Mn) and Volume (Mn Units) 2015-2028, by Institutional Sub-segments
Table 31: Europe Paper Straws Market Value (US$ Mn) and Volume (Mn Units) 2015-2028, by Country (1/2)
Table 32: Europe Paper Straws Market Value (US$ Mn) and Volume (Mn Units) 2015-2028, by Country (2/2)
Table 33: Europe Paper Straws Market Value (US$ Mn) and Volume (Mn Units) 2015-2028, by Material Type
Table 34: Europe Paper Straws Market Value (US$ Mn) and Volume (Mn Units) 2015-2028, by Product Type
Table 35: Europe Paper Straws Market Value (US$ Mn) and Volume (Mn Units) 2015-2028, by Straw Length
Table 36: Europe Paper Straws Market Value (US$ Mn) and Volume (Mn Units) 2015-2028, by Sales Channel
Table 37: Europe Paper Straws Market Value (US$ Mn) and Volume (Mn Units) 2015-2028, by Retailers Sub-segments
Table 38: Europe Paper Straws Market Value (US$ Mn) and Volume (Mn Units) 2015-2028, by End Use
Table 39: Europe Paper Straws Market Value (US$ Mn) and Volume (Mn Units) 2015-2028, by Food Service Subsegments (1/2)
Table 40: Europe Paper Straws Market Value (US$ Mn) and Volume (Mn Units) 2015-2028, by Food Service Sub-segments (2/2)
Table 41: Europe Paper Straws Market Value (US$ Mn) and Volume (Mn Units) 2015-2028, by Institutional Sub-segments
Table 42: APAC Paper Straws Market Value (US$ Mn) and Volume (Mn Units) 2015-2028, by Country
Table 43: APAC Paper Straws Market Value (US$ Mn) and Volume (Mn Units) 2015-2028, by Material Type
Table 44: APAC Paper Straws Market Value (US$ Mn) and Volume (Mn Units) 2015-2028, by Product Type
Table 45: APAC Paper Straws Market Value (US$ Mn) and Volume (Mn Units) 2015-2028, by Straw Length
Table 46: APAC Paper Straws Market Value (US$ Mn) and Volume (Mn Units) 2015-2028, by Sales Channel
Table 47: APAC Paper Straws Market Value (US$ Mn) and Volume (Mn Units) 2015-2028, by Retailers Sub-segments
Table 48: APAC Paper Straws Market Value (US$ Mn) and Volume (Mn Units) 2015-2028, by End Use
Table 49: APAC Paper Straws Market Value (US$ Mn) and Volume (Mn Units) 2015-2028, by Food Service Sub-segments (1/2)
Table 50: APAC Paper Straws Market Value (US$ Mn) and Volume (Mn Units) 2015-2028, by Food Service Sub-segments (2/2)
Table 51: APAC Paper Straws Market Value (US$ Mn) and Volume (Mn Units) 2015-2028, by Institutional Sub-segments
Table 52: MEA Paper Straws Market Value (US$ Mn) and Volume (Mn Units) 2015-2028, by Country
Table 53: MEA Paper Straws Market Value (US$ Mn) and Volume (Mn Units) 2015-2028, by Material Type
Table 54: MEA Paper Straws Market Value (US$ Mn) and Volume (Mn Units) 2015-2028, by Product Type
Table 55: MEA Paper Straws Market Value (US$ Mn) and Volume (Mn Units) 2015-2028, by Straw Length
Table 56: MEA Paper Straws Market Value (US$ Mn) and Volume (Mn Units) 2015-2028, by Sales Channel
Table 57: MEA Paper Straws Market Value (US$ Mn) and Volume (Mn Units) 2015-2028, by Retailers Sub-segments
Table 58: MEA Paper Straws Market Value (US$ Mn) and Volume (Mn Units) 2015-2028, by End Use
Table 59: MEA Paper Straws Market Value (US$ Mn) and Volume (Mn Units) 2015-2028, by Food Service Sub-segments (1/2)
Table 60: MEA Paper Straws Market Value (US$ Mn) and Volume (Mn Units) 2015-2028, by Food Service Sub-segments (2/2)
Table 61: MEA Paper Straws Market Value (US$ Mn) and Volume (Mn Units) 2015-2028, by Institutional Sub-segments
List of Figures
Figure 01: Global Paper Straws Market Y-o-Y growth, by Material Type 2019-2028
Figure 02: Global Paper Straws Market Attractiveness Analysis, by Material Type, 2019-2028
Figure 03: Global Paper Straws Market Y-o-Y growth, by Product Type 2019-2028
Figure 04: Global Paper Straws Market Attractiveness Analysis, by Product Type, 2019-2028
Figure 05: Global Paper Straws Market Y-o-Y growth, by Straw Length 2019-2028
Figure 06: Global Paper Straws Market Attractiveness Analysis, by Straw Length, 2019-2028
Figure 07: Global Paper Straws Market Y-o-Y growth, by Sales Channel 2019-2028
Figure 08: Global Paper Straws Market Attractiveness Analysis, by Sales Channel, 2019-2028
Figure 09: Global Paper Straws Market Y-o-Y growth, by End Use, 2019-2028
Figure 10: Global Paper Straws Market Attractiveness Analysis, by End Use, 2019-2028
Figure 11: Global Paper Straws Market Y-o-Y growth, by Region, 2019-2028
Figure 12: Global Paper Straws Market Attractiveness Analysis, by Region, 2019-2028
Figure 13: North America Paper Straws Market Value Share Analysis, by Country, 2019-2028
Figure 14: North America Paper Straws Market Attractiveness Analysis, by Country, 2019-2028
Figure 15: North America Paper Straws Market Y-o-Y growth, by Material Type 2019-2028
Figure 16: North America Paper Straws Market Attractiveness Analysis, by Material Type, 2019-2028
Figure 17: North America Paper Straws Market Y-o-Y growth, by Product Type 2019-2028
Figure 18: North America Paper Straws Market Attractiveness Analysis, by Product Type, 2019-2028
Figure 19: North America Paper Straws Market Y-o-Y growth, by Straw Length 2019-2028
Figure 20: North America Paper Straws Market Attractiveness Analysis, by Straw Length, 2019-2028
Figure 21: North America Paper Straws Market Y-o-Y growth, by Sales Channel 2019-2028
Figure 22: North America Paper Straws Market Attractiveness Analysis, by Sales Channel, 2019-2028
Figure 23: North America Paper Straws Market Y-o-Y growth, by End Use, 2019-2028
Figure 24: North America Paper Straws Market Attractiveness Analysis, by End Use, 2019-2028
Figure 25: Latin America Paper Straws Market Value Share Analysis, by Country, 2019-2028
Figure 26: Latin America Paper Straws Market Attractiveness Analysis, by Country, 2019-2028
Figure 27: Latin America Paper Straws Market Y-o-Y growth, by Material Type 2019-2028
Figure 28: Latin America Paper Straws Market Attractiveness Analysis, by Material Type, 2019-2028
Figure 29: Latin America Paper Straws Market Y-o-Y growth, by Product Type 2019-2028
Figure 30: Latin America Paper Straws Market Attractiveness Analysis, by Product Type, 2019-2028
Figure 31: Latin America Paper Straws Market Y-o-Y growth, by Straw Length 2019-2028
Figure 32: Latin America Paper Straws Market Attractiveness Analysis, by Straw Length, 2019-2028
Figure 33: Latin America Paper Straws Market Y-o-Y growth, by Sales Channel 2019-2028
Figure 34: Latin America Paper Straws Market Attractiveness Analysis, by Sales Channel, 2019-2028
Figure 35: Latin America Paper Straws Market Y-o-Y growth, by End Use, 2019-2028
Figure 36: Latin America Paper Straws Market Attractiveness Analysis, by End Use, 2019-2028
Figure 37: Europe Paper Straws Market Value Share Analysis, by Country, 2019-2028
Figure 38: Europe Paper Straws Market Attractiveness Analysis, by Country, 2019-2028
Figure 39: Europe Paper Straws Market Y-o-Y growth, by Material Type 2019-2028
Figure 40: Europe Paper Straws Market Attractiveness Analysis, by Material Type, 2019-2028
Figure 41: Europe Paper Straws Market Y-o-Y growth, by Product Type 2019-2028
Figure 42: Europe Paper Straws Market Attractiveness Analysis, by Product Type, 2019-2028
Figure 43: Europe Paper Straws Market Y-o-Y growth, by Straw Length 2019-2028
Figure 44: Europe Paper Straws Market Attractiveness Analysis, by Straw Length, 2019-2028
Figure 45: Europe Paper Straws Market Y-o-Y growth, by Sales Channel 2019-2028
Figure 46: Europe Paper Straws Market Attractiveness Analysis, by Sales Channel, 2019-2028
Figure 47: Europe Paper Straws Market Y-o-Y growth, by End Use, 2019-2028
Figure 48: Europe Paper Straws Market Attractiveness Analysis, by End Use, 2019-2028
Figure 49: APAC Paper Straws Market Value Share Analysis, by Country, 2019-2028
Figure 50: APAC Paper Straws Market Attractiveness Analysis, by Country, 2019-2028
Figure 51: APAC Paper Straws Market Y-o-Y growth, by Material Type 2019-2028
Figure 52: APAC Paper Straws Market Attractiveness Analysis, by Material Type, 2019-2028
Figure 53: APAC Paper Straws Market Y-o-Y growth, by Product Type 2019-2028
Figure 54: APAC Paper Straws Market Attractiveness Analysis, by Product Type, 2019-2028
Figure 55: APAC Paper Straws Market Y-o-Y growth, by Straw Length 2019-2028
Figure 56: APAC Paper Straws Market Attractiveness Analysis, by Straw Length, 2019-2028
Figure 57: APAC Paper Straws Market Y-o-Y growth, by Sales Channel 2019-2028
Figure 58: APAC Paper Straws Market Attractiveness Analysis, by Sales Channel, 2019-2028
Figure 59: APAC Paper Straws Market Y-o-Y growth, by End Use, 2019-2028
Figure 60: APAC Paper Straws Market Attractiveness Analysis, by End Use, 2019-2028
Figure 61: MEA Paper Straws Market Value Share Analysis, by Country, 2019-2028
Figure 62: MEA Paper Straws Market Attractiveness Analysis, by Country, 2019-2028
Figure 63: MEA Paper Straws Market Y-o-Y growth, by Material Type 2019-2028
Figure 64: MEA Paper Straws Market Attractiveness Analysis, by Material Type, 2019-2028
Figure 65: MEA Paper Straws Market Y-o-Y growth, by Product Type 2019-2028
Figure 66: MEA Paper Straws Market Attractiveness Analysis, by Product Type, 2019-2028
Figure 67: MEA Paper Straws Market Y-o-Y growth, by Straw Length 2019-2028
Figure 68: MEA Paper Straws Market Attractiveness Analysis, by Straw Length, 2019-2028
Figure 69: MEA Paper Straws Market Y-o-Y growth, by Sales Channel 2019-2028
Figure 70: MEA Paper Straws Market Attractiveness Analysis, by Sales Channel, 2019-2028
Figure 71: MEA Paper Straws Market Y-o-Y growth, by End Use, 2019-2028
Figure 72: MEA Paper Straws Market Attractiveness Analysis, by End Use, 2019-2028
Copyright © Transparency Market Research, Inc. All Rights reserved
Trust Online

Paper Straws Market