
Reports
Reports
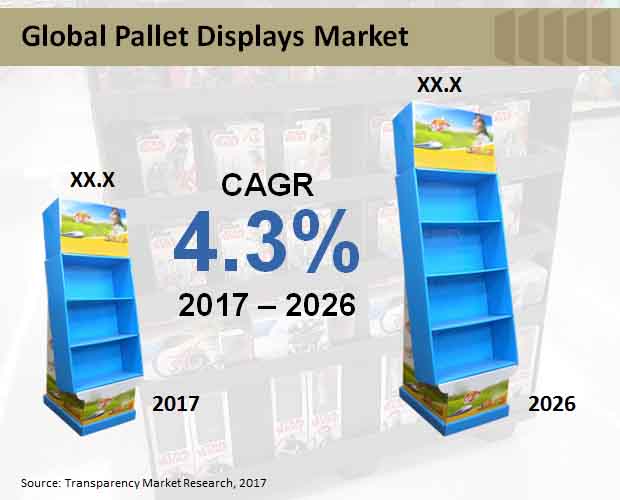
Pallet displays are becoming increasingly common in modern retail settings. These displays allow brands to have a fair level of product differentiation in stores and supermarkets. Moreover, pallet display add to the overall aesthetics involved in product branding. Pallet manufacturer are coming up with innovative designs for their clients. These pallets are attractive, catchy and supports the retail store product displays. Pallet displays come in a wide range of designs and styles that meet different packaging application. At the same time, manufacturers are also focusing on improving material durability and providing cost-effective packaging options. As per the latest report published by Transparency Market Research (TMR), the global pallet display market will surpass a valuation of US$ 1,600 Mn by the end of 2026. Factors such as rising demand for more attractive retail store product display, convenient packaging, increasing usage of pallet displays in electronic, food and grocery product display in expected to support the growth of the market. In addition, increasing availability of application-specific pallet displays that execute complicated pallet display programs is likely reflect favourably on the market during the forecast period. The high emphasis that is placed of enhancing quality has led to introduction of high quality pallet displays that fulfil the actual objectives.
Demand for corrugated board based pallet displays is expected to remain relatively high in 2017 and beyond. Corrugated cardboard pallet displays provision displaying of large volumes of a particular product for quick sale. Such pallet displays allow brand to showcases their product at scale. Further, they are available in most sizes (quarter, half and full) along with customization. Corrugated board pallet displays can be used for showcasing a single as well as multiple type of products and thereby present in most retail stores. Global sales of corrugated board pallet displays currently account for a significant revenue share of the market. Towards the end of the assessment period, close to US$ 1,091.6 Mn worth corrugated pallet displays are expected to be sold worldwide.
In terms of revenue, North America is expected to dominate global pallet displays market throughout the forecast period. The market in the region is expected to expand at a CAGR of 4.3% between 2017 and 2026. However, growing number of pallet display users who strive to become more competitive on a global level is expected to create market opportunities other regions. Proliferation of hypermarkets and supermarket in region such as Asia Pacific excluding Japan (APEJ), the Middle East & Africa (MEA) and Latin America is ushering the growth of the market in these regions. Increasing brand penetration in these regions is expected augur well for prospects of both local vendors and multinational players. The pallet displays market is thus anticipated to witness a steady expansion and contribute to overall product branding matrix in retail settings.
TMR in its report has profiled some of the leading companies that operate in the global pallet displays market, which include Sonoco Products Company, DS Smith Plc, Smurfit Kappa Group PLC, Georgia-Pacific LLC, WestRock Company, FFR Merchandising Company, U.S. Corrugated, Inc., Marketing Alliance Group, Creative Displays Now, Pratt Industries Inc., Mirada Medical Limited, Sciencesoft USA Corporation, Siemens Healthineers, Toshiba Medical Systems Corporation and Xinapse Systems Ltd. A majority of these companies are focusing on enhancement of their product quality and development of innovative designs.
Pallet Displays Market to Gain Impetus from Increasing Demand from Retail Industry
Pallet displays have become an extremely integral part of modern retail settings as they help to ease product differentiation in retail outlets such as stores and supermarkets. They also add aesthetics to the overall product branding, thereby aiding in expansion of the market. Manufacturers of the pallet displays market are thinking of imaginative plans for their customers. These pallets are alluring, appealing and underpins the retail location item displays. Pallet displays arrive in a wide scope of plans and styles that meet distinctive bundling application. Simultaneously, producers are likewise zeroing in on improving material strength and giving practical bundling choices.
Factors such as rising interest for more alluring retail location item display, helpful in bundling utilization of pallet displays in electronic, food and staple item display in expected to help the development of the market. Moreover, expanding accessibility of utilization explicit pallet displays that execute muddled pallet display programs is likely consider well the market during the conjecture time frame. The high accentuation that is set of improving quality has prompted presentation of top notch pallet displays that satisfy the real goals.
The global market for pallet displays is classified on the basis of product type, end user, application, material type, and region. Among the material types, he corrugated board segment is holding the highest shares on account of their availability in various sizes. Folded cardboard pallet displays arrangement displaying of huge volumes of a specific item for snappy deal. Such pallet displays permit brand to grandstands their item at scale. Folded board pallet displays can be utilized for exhibiting a solitary just as numerous kind of items and accordingly present in most retail locations. Worldwide deals of ridged board pallet displays as of now represent a huge income portion of the market.
Chapter 1 Global Economic Outlook
Chapter 2 Global Pallet Display Market - Executive Summary
Chapter 3 Global Pallet Display Market Overview
3.1 Introduction
3.1.1 Global Pallet display Market Taxonomy
3.1.2 Global Pallet display Market Definition
3.2 Global Pallet display Market Size (US$ Mn) and Forecast, 2012-2026
3.2.1 Global Pallet display Market Y-o-Y Growth
3.3 Global Pallet display Market Dynamics
3.4 Global Retail Top 250 Players Quick Statistics
3.5 Top 10 Retailers
3.6 Geographic Analysis
3.7 Retail revenue growth and profitability by region/country, FY2015
3.8 Product Sector Analysis
3.9 Retail revenue growth and profitability by primary product sector¹, FY2015
3.10 Top 10 Upcoming Retail Outlets
3.11 Global Retail Development Index 2016
3.12 Supply Chain Of Pallet Display Market
3.13 Cost Structure Of Pallet Display Market
3.14 Porter’s Five Forces Analysis Of Pallet Display Market
3.15 Product Life Cycle Of Pallet Display Market
3.16 Consumer Survey
3.17 Key Participants Market Presence (Intensity Map) By Region
Chapter 4 Global Pallet display Market Analysis and Forecast 2012-2026
4.1 Global Pallet display Market Size and Forecast By Product Type, 2012-2026
4.1.1 Full Pallet Display Market Size and Forecast, 2012-2026
4.1.1.1 Revenue (US$ Mn) Comparison, By Region
4.1.1.2 Market Share Comparison, By Region
4.1.1.3 Y-o-Y growth Comparison, By Region
4.1.2 Half Pallet Display Market Size and Forecast, 2012-2026
4.1.2.1 Revenue (US$ Mn) Comparison, By Region
4.1.2.2 Market Share Comparison, By Region
4.1.2.3 Y-o-Y growth Comparison, By Region
4.1.3 Quarter Pallet Display Market Size and Forecast, 2012-2026
4.1.3.1 Revenue (US$ Mn) Comparison, By Region
4.1.3.2 Market Share Comparison, By Region
4.1.3.3 Y-o-Y growth Comparison, By Region
4.2 Global Pallet display Market Size and Forecast By End Use, 2012-2026
4.2.1 Hyper Market Market Size and Forecast, 2012-2026
4.2.1.1 Revenue (US$ Mn) Comparison, By Region
4.2.1.2 Market Share Comparison, By Region
4.2.1.3 Y-o-Y growth Comparison, By Region
4.2.2 Supermarket Market Size and Forecast, 2012-2026
4.2.2.1 Revenue (US$ Mn) Comparison, By Region
4.2.2.2 Market Share Comparison, By Region
4.2.2.3 Y-o-Y growth Comparison, By Region
4.2.3 Departmental store Market Size and Forecast, 2012-2026
4.2.3.1 Revenue (US$ Mn) Comparison, By Region
4.2.3.2 Market Share Comparison, By Region
4.2.3.3 Y-o-Y growth Comparison, By Region
4.2.4 Specialty Store Market Size and Forecast, 2012-2026
4.2.4.1 Revenue (US$ Mn) Comparison, By Region
4.2.4.2 Market Share Comparison, By Region
4.2.4.3 Y-o-Y growth Comparison, By Region
4.2.5 Convenience Store Market Size and Forecast, 2012-2026
4.2.5.1 Revenue (US$ Mn) Comparison, By Region
4.2.5.2 Market Share Comparison, By Region
4.2.5.3 Y-o-Y growth Comparison, By Region
4.2.6 Other Retail Formats Market Size and Forecast, 2012-2026
4.2.6.1 Revenue (US$ Mn) Comparison, By Region
4.2.6.2 Market Share Comparison, By Region
4.2.6.3 Y-o-Y growth Comparison, By Region
4.3 Global Pallet display Market Size and Forecast By Application, 2012-2026
4.3.1 Food & Beverages Market Size and Forecast, 2012-2026
4.3.1.1 Revenue (US$ Mn) Comparison, By Region
4.3.1.2 Market Share Comparison, By Region
4.3.1.3 Y-o-Y growth Comparison, By Region
4.3.2 Cosmetics & Personal Care Market Size and Forecast, 2012-2026
4.3.2.1 Revenue (US$ Mn) Comparison, By Region
4.3.2.2 Market Share Comparison, By Region
4.3.2.3 Y-o-Y growth Comparison, By Region
4.3.3 Pharmaceuticals Market Size and Forecast, 2012-2026
4.3.3.1 Revenue (US$ Mn) Comparison, By Region
4.3.3.2 Market Share Comparison, By Region
4.3.3.3 Y-o-Y growth Comparison, By Region
4.3.4 Printing & Stationary Market Size and Forecast, 2012-2026
4.3.4.1 Revenue (US$ Mn) Comparison, By Region
4.3.4.2 Market Share Comparison, By Region
4.3.4.3 Y-o-Y growth Comparison, By Region
4.3.5 Electronics Market Size and Forecast, 2012-2026
4.3.5.1 Revenue (US$ Mn) Comparison, By Region
4.3.5.2 Market Share Comparison, By Region
4.3.5.3 Y-o-Y growth Comparison, By Region
4.3.6 Automotive Market Size and Forecast, 2012-2026
4.3.6.1 Revenue (US$ Mn) Comparison, By Region
4.3.6.2 Market Share Comparison, By Region
4.3.6.3 Y-o-Y growth Comparison, By Region
4.3.7 Others Market Size and Forecast, 2012-2026
4.3.7.1 Revenue (US$ Mn) Comparison, By Region
4.3.7.2 Market Share Comparison, By Region
4.3.7.3 Y-o-Y growth Comparison, By Region
4.4 Global Pallet display Market Size and Forecast By Material Type, 2012-2026
4.4.1 Corrugated Board Market Size and Forecast, 2012-2026
4.4.1.1 Revenue (US$ Mn) Comparison, By Region
4.4.1.2 Market Share Comparison, By Region
4.4.1.3 Y-o-Y growth Comparison, By Region
4.4.2 Foam Board Market Size and Forecast, 2012-2026
4.4.2.1 Revenue (US$ Mn) Comparison, By Region
4.4.2.2 Market Share Comparison, By Region
4.4.2.3 Y-o-Y growth Comparison, By Region
4.4.3 Plastic Sheet Market Size and Forecast, 2012-2026
4.4.3.1 Revenue (US$ Mn) Comparison, By Region
4.4.3.2 Market Share Comparison, By Region
4.4.3.3 Y-o-Y growth Comparison, By Region
4.4.4 Glass Market Size and Forecast, 2012-2026
4.4.4.1 Revenue (US$ Mn) Comparison, By Region
4.4.4.2 Market Share Comparison, By Region
4.4.4.3 Y-o-Y growth Comparison, By Region
4.4.5 Metal Market Size and Forecast, 2012-2026
4.4.5.1 Revenue (US$ Mn) Comparison, By Region
4.4.5.2 Market Share Comparison, By Region
4.4.5.3 Y-o-Y growth Comparison, By Region
Chapter 5 North America Pallet display Market Size and Forecast, 2012-2026
5.1 Revenue (US$ Mn) Comparison, By Country
5.2 Revenue (US$ Mn) Comparison, By Product Type
5.3 Revenue (US$ Mn) Comparison, By End Use
5.4 Revenue (US$ Mn) Comparison, By Application
5.5 Revenue (US$ Mn) Comparison, By Material Type
Chapter 6 Latin America Pallet display Market Size and Forecast, 2012-2026
6.1 Revenue (US$ Mn) Comparison, By Country
6.2 Revenue (US$ Mn) Comparison, By Product Type
6.3 Revenue (US$ Mn) Comparison, By End Use
6.4 Revenue (US$ Mn) Comparison, By Application
6.5 Revenue (US$ Mn) Comparison, By Material Type
Chapter 7 Europe Pallet display Market Size and Forecast, 2012-2026
7.1 Revenue (US$ Mn) Comparison, By Country
7.2 Revenue (US$ Mn) Comparison, By Product Type
7.3 Revenue (US$ Mn) Comparison, By End Use
7.4 Revenue (US$ Mn) Comparison, By Application
7.5 Revenue (US$ Mn) Comparison, By Material Type
Chapter 8 Japan Pallet display Market Size and Forecast, 2012-2026
8.1 Revenue (US$ Mn) Comparison, By Country
8.2 Revenue (US$ Mn) Comparison, By Product Type
8.3 Revenue (US$ Mn) Comparison, By End Use
8.4 Revenue (US$ Mn) Comparison, By Application
8.5 Revenue (US$ Mn) Comparison, By Material Type
Chapter 9 APEJ Pallet display Market Size and Forecast, 2012-2026
9.1 Revenue (US$ Mn) Comparison, By Country
9.2 Revenue (US$ Mn) Comparison, By Product Type
9.3 Revenue (US$ Mn) Comparison, By End Use
9.4 Revenue (US$ Mn) Comparison, By Application
9.5 Revenue (US$ Mn) Comparison, By Material Type
Chapter 10 MEA Pallet display Market Size and Forecast, 2012-2026
10.1 Revenue (US$ Mn) Comparison, By Country
10.2 Revenue (US$ Mn) Comparison, By Product Type
10.3 Revenue (US$ Mn) Comparison, By End Use
10.4 Revenue (US$ Mn) Comparison, By Application
10.5 Revenue (US$ Mn) Comparison, By Material Type
Chapter 11 Global Pallet display, Competition Landscape and Company Profiles
11.1 Company Share Analysis
11.2 Competitive Dashboard
11.3 Company Profiles
11.3.1 Sonoco Products Company
11.3.1.1 Company Overview
11.3.1.2 Product Overview
11.3.1.3 Key Financials
11.3.1.4 Key Developments
11.3.1.5 SWOT Analysis
11.3.2 DS Smith PLC
11.3.2.1 Company Overview
11.3.2.2 Product Overview
11.3.2.3 Key Financials
11.3.2.4 Key Developments
11.3.2.5 SWOT Analysis
11.3.3 Smurfit Kappa Group PLC
11.3.3.1 Company Overview
11.3.3.2 Product Overview
11.3.3.3 Key Financials
11.3.3.4 Key Developments
11.3.3.5 SWOT Analysis
11.3.4 Georgia-Pacific LLC
11.3.4.1 Company Overview
11.3.4.2 Product Overview
11.3.4.3 Key Developments
11.3.4.4 SWOT Analysis
11.3.5 WestRock Company
11.3.5.1 Company Overview
11.3.5.2 Product Overview
11.3.5.3 Key Financials
11.3.6 FFR Merchandising Company
11.3.6.1 Company Overview
11.3.6.2 Product Overview
11.3.7 U.S. Corrugated, Inc.
11.3.7.1 Company Overview
11.3.7.2 Product Overview
11.3.8 Marketing Alliance Group
11.3.8.1 Company Overview
11.3.8.2 Product Overview
11.3.9 Creative Displays Now
11.3.9.1 Company Overview
11.3.9.2 Product Overview
11.3.10 Pratt Industries Inc
11.3.10.1 Company Overview
11.3.10.2 Product Overview
Chapter 12 Research Methodology
Chapter 13 Disclaimer and Contact information
List of Tables
TABLE 1 Global Pallet display Market Value (US$ Mn), 2012-2017
TABLE 2 Global Pallet display Market Value (US$ Mn), 2018-2026
TABLE 3 Global Pallet display Market Value (US$ Mn) and Y-o-Y, 2017-2026
TABLE 4 Global Full Pallet Display Segment Value (US$ Mn), By Region 2012-2017
TABLE 5 Global Full Pallet Display Segment Value (US$ Mn), By Region 2018-2026
TABLE 6 Global Full Pallet Display Segment Market Share, By Region 2012-2017
TABLE 7 Global Full Pallet Display Segment Market Share, By Region 2018-2026
TABLE 8 Global Full Pallet Display Segment Y-o-Y, By Region 2017-2026
TABLE 9 Global Half Pallet Display Segment Value (US$ Mn), By Region 2012-2017
TABLE 10 Global Half Pallet Display Segment Value (US$ Mn), By Region 2018-2026
TABLE 11 Global Half Pallet Display Segment Market Share, By Region 2012-2017
TABLE 12 Global Half Pallet Display Segment Market Share, By Region 2018-2026
TABLE 13 Global Half Pallet Display Segment Y-o-Y, By Region 2017-2026
TABLE 14 Global Quarter Pallet Display Segment Value (US$ Mn), By Region 2012-2017
TABLE 15 Global Quarter Pallet Display Segment Value (US$ Mn), By Region 2018-2026
TABLE 16 Global Quarter Pallet Display Segment Market Share, By Region 2012-2017
TABLE 17 Global Quarter Pallet Display Segment Market Share, By Region 2018-2026
TABLE 18 Global Quarter Pallet Display Segment Y-o-Y, By Region 2017-2026
TABLE 19 Global Hyper Market Segment Value (US$ Mn), By Region 2012-2017
TABLE 20 Global Hyper Market Segment Value (US$ Mn), By Region 2018-2026
TABLE 21 Global Hyper Market Segment Market Share, By Region 2012-2017
TABLE 22 Global Hyper Market Segment Market Share, By Region 2018-2026
TABLE 23 Global Hyper Market Segment Y-o-Y, By Region 2017-2026
TABLE 24 Global Supermarket Segment Value (US$ Mn), By Region 2012-2017
TABLE 25 Global Supermarket Segment Value (US$ Mn), By Region 2018-2026
TABLE 26 Global Supermarket Segment Market Share, By Region 2012-2017
TABLE 27 Global Supermarket Segment Market Share, By Region 2018-2026
TABLE 28 Global Supermarket Segment Y-o-Y, By Region 2017-2026
TABLE 29 Global Departmental store Segment Value (US$ Mn), By Region 2012-2017
TABLE 30 Global Departmental store Segment Value (US$ Mn), By Region 2018-2026
TABLE 31 Global Departmental store Segment Market Share, By Region 2012-2017
TABLE 32 Global Departmental store Segment Market Share, By Region 2018-2026
TABLE 33 Global Departmental store Segment Y-o-Y, By Region 2017-2026
TABLE 34 Global Specialty Store Segment Value (US$ Mn), By Region 2012-2017
TABLE 35 Global Specialty Store Segment Value (US$ Mn), By Region 2018-2026
TABLE 36 Global Specialty Store Segment Market Share, By Region 2012-2017
TABLE 37 Global Specialty Store Segment Market Share, By Region 2018-2026
TABLE 38 Global Specialty Store Segment Y-o-Y, By Region 2017-2026
TABLE 39 Global Convenience Store Segment Value (US$ Mn), By Region 2012-2017
TABLE 40 Global Convenience Store Segment Value (US$ Mn), By Region 2018-2026
TABLE 41 Global Convenience Store Segment Market Share, By Region 2012-2017
TABLE 42 Global Convenience Store Segment Market Share, By Region 2018-2026
TABLE 43 Global Convenience Store Segment Y-o-Y, By Region 2017-2026
TABLE 44 Global Other Retail Formats Segment Value (US$ Mn), By Region 2012-2017
TABLE 45 Global Other Retail Formats Segment Value (US$ Mn), By Region 2018-2026
TABLE 46 Global Other Retail Formats Segment Market Share, By Region 2012-2017
TABLE 47 Global Other Retail Formats Segment Market Share, By Region 2018-2026
TABLE 48 Global Other Retail Formats Segment Y-o-Y, By Region 2017-2026
TABLE 49 Global Food & Beverages Segment Value (US$ Mn), By Region 2012-2017
TABLE 50 Global Food & Beverages Segment Value (US$ Mn), By Region 2018-2026
TABLE 51 Global Food & Beverages Segment Market Share, By Region 2012-2017
TABLE 52 Global Food & Beverages Segment Market Share, By Region 2018-2026
TABLE 53 Global Food & Beverages Segment Y-o-Y, By Region 2017-2026
TABLE 54 Global Cosmetics & Personal Care Segment Value (US$ Mn), By Region 2012-2017
TABLE 55 Global Cosmetics & Personal Care Segment Value (US$ Mn), By Region 2018-2026
TABLE 56 Global Cosmetics & Personal Care Segment Market Share, By Region 2012-2017
TABLE 57 Global Cosmetics & Personal Care Segment Market Share, By Region 2018-2026
TABLE 58 Global Cosmetics & Personal Care Segment Y-o-Y, By Region 2017-2026
TABLE 59 Global Pharmaceuticals Segment Value (US$ Mn), By Region 2012-2017
TABLE 60 Global Pharmaceuticals Segment Value (US$ Mn), By Region 2018-2026
TABLE 61 Global Pharmaceuticals Segment Market Share, By Region 2012-2017
TABLE 62 Global Pharmaceuticals Segment Market Share, By Region 2018-2026
TABLE 63 Global Pharmaceuticals Segment Y-o-Y, By Region 2017-2026
TABLE 64 Global Printing & Stationary Segment Value (US$ Mn), By Region 2012-2017
TABLE 65 Global Printing & Stationary Segment Value (US$ Mn), By Region 2018-2026
TABLE 66 Global Printing & Stationary Segment Market Share, By Region 2012-2017
TABLE 67 Global Printing & Stationary Segment Market Share, By Region 2018-2026
TABLE 68 Global Printing & Stationary Segment Y-o-Y, By Region 2017-2026
TABLE 69 Global Electronics Segment Value (US$ Mn), By Region 2012-2017
TABLE 70 Global Electronics Segment Value (US$ Mn), By Region 2018-2026
TABLE 71 Global Electronics Segment Market Share, By Region 2012-2017
TABLE 72 Global Electronics Segment Market Share, By Region 2018-2026
TABLE 73 Global Electronics Segment Y-o-Y, By Region 2017-2026
TABLE 74 Global Automotive Segment Value (US$ Mn), By Region 2012-2017
TABLE 75 Global Automotive Segment Value (US$ Mn), By Region 2018-2026
TABLE 76 Global Automotive Segment Market Share, By Region 2012-2017
TABLE 77 Global Automotive Segment Market Share, By Region 2018-2026
TABLE 78 Global Automotive Segment Y-o-Y, By Region 2017-2026
TABLE 79 Global Others Segment Value (US$ Mn), By Region 2012-2017
TABLE 80 Global Others Segment Value (US$ Mn), By Region 2018-2026
TABLE 81 Global Others Segment Market Share, By Region 2012-2017
TABLE 82 Global Others Segment Market Share, By Region 2018-2026
TABLE 83 Global Others Segment Y-o-Y, By Region 2017-2026
TABLE 84 Global Corrugated Board Segment Value (US$ Mn), By Region 2012-2017
TABLE 85 Global Corrugated Board Segment Value (US$ Mn), By Region 2018-2026
TABLE 86 Global Corrugated Board Segment Market Share, By Region 2012-2017
TABLE 87 Global Corrugated Board Segment Market Share, By Region 2018-2026
TABLE 88 Global Corrugated Board Segment Y-o-Y, By Region 2017-2026
TABLE 89 Global Foam Board Segment Value (US$ Mn), By Region 2012-2017
TABLE 90 Global Foam Board Segment Value (US$ Mn), By Region 2018-2026
TABLE 91 Global Foam Board Segment Market Share, By Region 2012-2017
TABLE 92 Global Foam Board Segment Market Share, By Region 2018-2026
TABLE 93 Global Foam Board Segment Y-o-Y, By Region 2017-2026
TABLE 94 Global Plastic Sheet Segment Value (US$ Mn), By Region 2012-2017
TABLE 95 Global Plastic Sheet Segment Value (US$ Mn), By Region 2018-2026
TABLE 96 Global Plastic Sheet Segment Market Share, By Region 2012-2017
TABLE 97 Global Plastic Sheet Segment Market Share, By Region 2018-2026
TABLE 98 Global Plastic Sheet Segment Y-o-Y, By Region 2017-2026
TABLE 99 Global Glass Segment Value (US$ Mn), By Region 2012-2017
TABLE 100 Global Glass Segment Value (US$ Mn), By Region 2018-2026
TABLE 101 Global Glass Segment Market Share, By Region 2012-2017
TABLE 102 Global Glass Segment Market Share, By Region 2018-2026
TABLE 103 Global Glass Segment Y-o-Y, By Region 2017-2026
TABLE 104 Global Metal Segment Value (US$ Mn), By Region 2012-2017
TABLE 105 Global Metal Segment Value (US$ Mn), By Region 2018-2026
TABLE 106 Global Metal Segment Market Share, By Region 2012-2017
TABLE 107 Global Metal Segment Market Share, By Region 2018-2026
TABLE 108 Global Metal Segment Y-o-Y, By Region 2017-2026
TABLE 109 North America Pallet display Market Value (US$ Mn), By Country 2012-2017
TABLE 110 North America Pallet display Market Value (US$ Mn), By Country 2018-2026
TABLE 111 North America Pallet display Market Value (US$ Mn), By Product Type 2012-2017
TABLE 112 North America Pallet display Market Value (US$ Mn), By Product Type 2018-2026
TABLE 113 North America Pallet display Market Value (US$ Mn), By End Use 2012-2017
TABLE 114 North America Pallet display Market Value (US$ Mn), By End Use 2018-2026
TABLE 115 North America Pallet display Market Value (US$ Mn), By Application 2012-2017
TABLE 116 North America Pallet display Market Value (US$ Mn), By Application 2018-2026
TABLE 117 North America Pallet display Market Value (US$ Mn), By Material Type 2012-2017
TABLE 118 North America Pallet display Market Value (US$ Mn), By Material Type 2018-2026
TABLE 119 Latin America Pallet display Market Value (US$ Mn), By Country 2012-2017
TABLE 120 Latin America Pallet display Market Value (US$ Mn), By Country 2018-2026
TABLE 121 Latin America Pallet display Market Value (US$ Mn), By Product Type 2012-2017
TABLE 122 Latin America Pallet display Market Value (US$ Mn), By Product Type 2018-2026
TABLE 123 Latin America Pallet display Market Value (US$ Mn), By End Use 2012-2017
TABLE 124 Latin America Pallet display Market Value (US$ Mn), By End Use 2018-2026
TABLE 125 Latin America Pallet display Market Value (US$ Mn), By Application 2012-2017
TABLE 126 Latin America Pallet display Market Value (US$ Mn), By Application 2018-2026
TABLE 127 Latin America Pallet display Market Value (US$ Mn), By Material Type 2012-2017
TABLE 128 Latin America Pallet display Market Value (US$ Mn), By Material Type 2018-2026
TABLE 129 Europe Pallet display Market Value (US$ Mn), By Country 2012-2017
TABLE 130 Europe Pallet display Market Value (US$ Mn), By Country 2018-2026
TABLE 131 Europe Pallet display Market Value (US$ Mn), By Product Type 2012-2017
TABLE 132 Europe Pallet display Market Value (US$ Mn), By Product Type 2018-2026
TABLE 133 Europe Pallet display Market Value (US$ Mn), By End Use 2012-2017
TABLE 134 Europe Pallet display Market Value (US$ Mn), By End Use 2018-2026
TABLE 135 Europe Pallet display Market Value (US$ Mn), By Application 2012-2017
TABLE 136 Europe Pallet display Market Value (US$ Mn), By Application 2018-2026
TABLE 137 Europe Pallet display Market Value (US$ Mn), By Material Type 2012-2017
TABLE 138 Europe Pallet display Market Value (US$ Mn), By Material Type 2018-2026
TABLE 139 Japan Pallet display Market Value (US$ Mn), By Country 2012-2017
TABLE 140 Japan Pallet display Market Value (US$ Mn), By Country 2018-2026
TABLE 141 Japan Pallet display Market Value (US$ Mn), By Product Type 2012-2017
TABLE 142 Japan Pallet display Market Value (US$ Mn), By Product Type 2018-2026
TABLE 143 Japan Pallet display Market Value (US$ Mn), By End Use 2012-2017
TABLE 144 Japan Pallet display Market Value (US$ Mn), By End Use 2018-2026
TABLE 145 Japan Pallet display Market Value (US$ Mn), By Application 2012-2017
TABLE 146 Japan Pallet display Market Value (US$ Mn), By Application 2018-2026
TABLE 147 Japan Pallet display Market Value (US$ Mn), By Material Type 2012-2017
TABLE 148 Japan Pallet display Market Value (US$ Mn), By Material Type 2018-2026
TABLE 149 APEJ Pallet display Market Value (US$ Mn), By Country 2012-2017
TABLE 150 APEJ Pallet display Market Value (US$ Mn), By Country 2018-2026
TABLE 151 APEJ Pallet display Market Value (US$ Mn), By Product Type 2012-2017
TABLE 152 APEJ Pallet display Market Value (US$ Mn), By Product Type 2018-2026
TABLE 153 APEJ Pallet display Market Value (US$ Mn), By End Use 2012-2017
TABLE 154 APEJ Pallet display Market Value (US$ Mn), By End Use 2018-2026
TABLE 155 APEJ Pallet display Market Value (US$ Mn), By Application 2012-2017
TABLE 156 APEJ Pallet display Market Value (US$ Mn), By Application 2018-2026
TABLE 157 APEJ Pallet display Market Value (US$ Mn), By Material Type 2012-2017
TABLE 158 APEJ Pallet display Market Value (US$ Mn), By Material Type 2018-2026
TABLE 159 MEA Pallet display Market Value (US$ Mn), By Country 2012-2017
TABLE 160 MEA Pallet display Market Value (US$ Mn), By Country 2018-2026
TABLE 161 MEA Pallet display Market Value (US$ Mn), By Product Type 2012-2017
TABLE 162 MEA Pallet display Market Value (US$ Mn), By Product Type 2018-2026
TABLE 163 MEA Pallet display Market Value (US$ Mn), By End Use 2012-2017
TABLE 164 MEA Pallet display Market Value (US$ Mn), By End Use 2018-2026
TABLE 165 MEA Pallet display Market Value (US$ Mn), By Application 2012-2017
TABLE 166 MEA Pallet display Market Value (US$ Mn), By Application 2018-2026
TABLE 167 MEA Pallet display Market Value (US$ Mn), By Material Type 2012-2017
TABLE 168 MEA Pallet display Market Value (US$ Mn), By Material Type 2018-2026
List of Figures
FIG. 1 Global Pallet display Market Value (US$ Mn), 2012-2017
FIG. 2 Global Pallet display Market Value (US$ Mn) Forecast, 2018-2026
FIG. 3 Global Pallet display Market Value (US$ Mn) and Y-o-Y, 2017-2026
FIG. 4 Global Full Pallet Display Segment Market Value (US$ Mn) By Region, 2012-2017
FIG. 5 Global Full Pallet Display Segment Market Value (US$ Mn) By Region, 2018-2026
FIG. 6 Global Full Pallet Display Segment Y-o-Y Growth Rate, By Region, 2017-2026
FIG. 7 Global Half Pallet Display Segment Market Value (US$ Mn) By Region, 2012-2017
FIG. 8 Global Half Pallet Display Segment Market Value (US$ Mn) By Region, 2018-2026
FIG. 9 Global Half Pallet Display Segment Y-o-Y Growth Rate, By Region, 2017-2026
FIG. 10 Global Quarter Pallet Display Segment Market Value (US$ Mn) By Region, 2012-2017
FIG. 11 Global Quarter Pallet Display Segment Market Value (US$ Mn) By Region, 2018-2026
FIG. 12 Global Quarter Pallet Display Segment Y-o-Y Growth Rate, By Region, 2017-2026
FIG. 13 Global Hyper Market Segment Market Value (US$ Mn) By Region, 2012-2017
FIG. 14 Global Hyper Market Segment Market Value (US$ Mn) By Region, 2018-2026
FIG. 15 Global Hyper Market Segment Y-o-Y Growth Rate, By Region, 2017-2026
FIG. 16 Global Supermarket Segment Market Value (US$ Mn) By Region, 2012-2017
FIG. 17 Global Supermarket Segment Market Value (US$ Mn) By Region, 2018-2026
FIG. 18 Global Supermarket Segment Y-o-Y Growth Rate, By Region, 2017-2026
FIG. 19 Global Departmental store Segment Market Value (US$ Mn) By Region, 2012-2017
FIG. 20 Global Departmental store Segment Market Value (US$ Mn) By Region, 2018-2026
FIG. 21 Global Departmental store Segment Y-o-Y Growth Rate, By Region, 2017-2026
FIG. 22 Global Specialty Store Segment Market Value (US$ Mn) By Region, 2012-2017
FIG. 23 Global Specialty Store Segment Market Value (US$ Mn) By Region, 2018-2026
FIG. 24 Global Specialty Store Segment Y-o-Y Growth Rate, By Region, 2017-2026
FIG. 25 Global Convenience Store Segment Market Value (US$ Mn) By Region, 2012-2017
FIG. 26 Global Convenience Store Segment Market Value (US$ Mn) By Region, 2018-2026
FIG. 27 Global Convenience Store Segment Y-o-Y Growth Rate, By Region, 2017-2026
FIG. 28 Global Other Retail Formats Segment Market Value (US$ Mn) By Region, 2012-2017
FIG. 29 Global Other Retail Formats Segment Market Value (US$ Mn) By Region, 2018-2026
FIG. 30 Global Other Retail Formats Segment Y-o-Y Growth Rate, By Region, 2017-2026
FIG. 31 Global Food & Beverages Segment Market Value (US$ Mn) By Region, 2012-2017
FIG. 32 Global Food & Beverages Segment Market Value (US$ Mn) By Region, 2018-2026
FIG. 33 Global Food & Beverages Segment Y-o-Y Growth Rate, By Region, 2017-2026
FIG. 34 Global Cosmetics & Personal Care Segment Market Value (US$ Mn) By Region, 2012-2017
FIG. 35 Global Cosmetics & Personal Care Segment Market Value (US$ Mn) By Region, 2018-2026
FIG. 36 Global Cosmetics & Personal Care Segment Y-o-Y Growth Rate, By Region, 2017-2026
FIG. 37 Global Pharmaceuticals Segment Market Value (US$ Mn) By Region, 2012-2017
FIG. 38 Global Pharmaceuticals Segment Market Value (US$ Mn) By Region, 2018-2026
FIG. 39 Global Pharmaceuticals Segment Y-o-Y Growth Rate, By Region, 2017-2026
FIG. 40 Global Printing & Stationary Segment Market Value (US$ Mn) By Region, 2012-2017
FIG. 41 Global Printing & Stationary Segment Market Value (US$ Mn) By Region, 2018-2026
FIG. 42 Global Printing & Stationary Segment Y-o-Y Growth Rate, By Region, 2017-2026
FIG. 43 Global Electronics Segment Market Value (US$ Mn) By Region, 2012-2017
FIG. 44 Global Electronics Segment Market Value (US$ Mn) By Region, 2018-2026
FIG. 45 Global Electronics Segment Y-o-Y Growth Rate, By Region, 2017-2026
FIG. 46 Global Automotive Segment Market Value (US$ Mn) By Region, 2012-2017
FIG. 47 Global Automotive Segment Market Value (US$ Mn) By Region, 2018-2026
FIG. 48 Global Automotive Segment Y-o-Y Growth Rate, By Region, 2017-2026
FIG. 49 Global Others Segment Market Value (US$ Mn) By Region, 2012-2017
FIG. 50 Global Others Segment Market Value (US$ Mn) By Region, 2018-2026
FIG. 51 Global Others Segment Y-o-Y Growth Rate, By Region, 2017-2026
FIG. 52 Global Corrugated Board Segment Market Value (US$ Mn) By Region, 2012-2017
FIG. 53 Global Corrugated Board Segment Market Value (US$ Mn) By Region, 2018-2026
FIG. 54 Global Corrugated Board Segment Y-o-Y Growth Rate, By Region, 2017-2026
FIG. 55 Global Foam Board Segment Market Value (US$ Mn) By Region, 2012-2017
FIG. 56 Global Foam Board Segment Market Value (US$ Mn) By Region, 2018-2026
FIG. 57 Global Foam Board Segment Y-o-Y Growth Rate, By Region, 2017-2026
FIG. 58 Global Plastic Sheet Segment Market Value (US$ Mn) By Region, 2012-2017
FIG. 59 Global Plastic Sheet Segment Market Value (US$ Mn) By Region, 2018-2026
FIG. 60 Global Plastic Sheet Segment Y-o-Y Growth Rate, By Region, 2017-2026
FIG. 61 Global Glass Segment Market Value (US$ Mn) By Region, 2012-2017
FIG. 62 Global Glass Segment Market Value (US$ Mn) By Region, 2018-2026
FIG. 63 Global Glass Segment Y-o-Y Growth Rate, By Region, 2017-2026
FIG. 64 Global Metal Segment Market Value (US$ Mn) By Region, 2012-2017
FIG. 65 Global Metal Segment Market Value (US$ Mn) By Region, 2018-2026
FIG. 66 Global Metal Segment Y-o-Y Growth Rate, By Region, 2017-2026
FIG. 67 North America Pallet display Market Value (US$ Mn), By Country 2012-2017
FIG. 68 North America Pallet display Market Value (US$ Mn), By Country 2018-2026
FIG. 69 North America Pallet display Market Value (US$ Mn), By Product Type 2012-2017
FIG. 70 North America Pallet display Market Value (US$ Mn), By Product Type 2018-2026
FIG. 71 North America Pallet display Market Value (US$ Mn), By End Use 2012-2017
FIG. 72 North America Pallet display Market Value (US$ Mn), By End Use 2018-2026
FIG. 73 North America Pallet display Market Value (US$ Mn), By Application 2012-2017
FIG. 74 North America Pallet display Market Value (US$ Mn), By Application 2018-2026
FIG. 75 North America Pallet display Market Value (US$ Mn), By Material Type 2012-2017
FIG. 76 North America Pallet display Market Value (US$ Mn), By Material Type 2018-2026
FIG. 77 Latin America Pallet display Market Value (US$ Mn), By Country 2012-2017
FIG. 78 Latin America Pallet display Market Value (US$ Mn), By Country 2018-2026
FIG. 79 Latin America Pallet display Market Value (US$ Mn), By Product Type 2012-2017
FIG. 80 Latin America Pallet display Market Value (US$ Mn), By Product Type 2018-2026
FIG. 81 Latin America Pallet display Market Value (US$ Mn), By End Use 2012-2017
FIG. 82 Latin America Pallet display Market Value (US$ Mn), By End Use 2018-2026
FIG. 83 Latin America Pallet display Market Value (US$ Mn), By Application 2012-2017
FIG. 84 Latin America Pallet display Market Value (US$ Mn), By Application 2018-2026
FIG. 85 Latin America Pallet display Market Value (US$ Mn), By Material Type 2012-2017
FIG. 86 Latin America Pallet display Market Value (US$ Mn), By Material Type 2018-2026
FIG. 87 Europe Pallet display Market Value (US$ Mn), By Country 2012-2017
FIG. 88 Europe Pallet display Market Value (US$ Mn), By Country 2018-2026
FIG. 89 Europe Pallet display Market Value (US$ Mn), By Product Type 2012-2017
FIG. 90 Europe Pallet display Market Value (US$ Mn), By Product Type 2018-2026
FIG. 91 Europe Pallet display Market Value (US$ Mn), By End Use 2012-2017
FIG. 92 Europe Pallet display Market Value (US$ Mn), By End Use 2018-2026
FIG. 93 Europe Pallet display Market Value (US$ Mn), By Application 2012-2017
FIG. 94 Europe Pallet display Market Value (US$ Mn), By Application 2018-2026
FIG. 95 Europe Pallet display Market Value (US$ Mn), By Material Type 2012-2017
FIG. 96 Europe Pallet display Market Value (US$ Mn), By Material Type 2018-2026
FIG. 97 Japan Pallet display Market Value (US$ Mn), By Country 2012-2017
FIG. 98 Japan Pallet display Market Value (US$ Mn), By Country 2018-2026
FIG. 99 Japan Pallet display Market Value (US$ Mn), By Product Type 2012-2017
FIG. 100 Japan Pallet display Market Value (US$ Mn), By Product Type 2018-2026
FIG. 101 Japan Pallet display Market Value (US$ Mn), By Application 2012-2017
FIG. 102 Japan Pallet display Market Value (US$ Mn), By End Use 2018-2026
FIG. 103 Japan Pallet display Market Value (US$ Mn), By Application 2012-2017
FIG. 104 Japan Pallet display Market Value (US$ Mn), By Application 2018-2026
FIG. 105 Japan Pallet display Market Value (US$ Mn), By Material Type 2012-2017
FIG. 106 Japan Pallet display Market Value (US$ Mn), By Material Type 2018-2026
FIG. 107 APEJ Pallet display Market Value (US$ Mn), By Country 2012-2017
FIG. 108 APEJ Pallet display Market Value (US$ Mn), By Country 2018-2026
FIG. 109 APEJ Pallet display Market Value (US$ Mn), By Product Type 2012-2017
FIG. 110 APEJ Pallet display Market Value (US$ Mn), By Product Type 2018-2026
FIG. 111 APEJ Pallet display Market Value (US$ Mn), By End Use 2012-2017
FIG. 112 APEJ Pallet display Market Value (US$ Mn), By End Use 2018-2026
FIG. 113 APEJ Pallet display Market Value (US$ Mn), By Application 2012-2017
FIG. 114 APEJ Pallet display Market Value (US$ Mn), By Application 2018-2026
FIG. 115 APEJ Pallet display Market Value (US$ Mn), By Material Type 2012-2017
FIG. 116 APEJ Pallet display Market Value (US$ Mn), By Material Type 2018-2026
FIG. 117 MEA Pallet display Market Value (US$ Mn), By Country 2012-2017
FIG. 118 MEA Pallet display Market Value (US$ Mn), By Country 2018-2026
FIG. 119 MEA Pallet display Market Value (US$ Mn), By Product Type 2012-2017
FIG. 120 MEA Pallet display Market Value (US$ Mn), By Product Type 2018-2026
FIG. 121 MEA Pallet display Market Value (US$ Mn), By End Use 2012-2017
FIG. 122 MEA Pallet display Market Value (US$ Mn), By End Use 2018-2026
FIG. 123 MEA Pallet display Market Value (US$ Mn), By Application 2012-2017
FIG. 124 MEA Pallet display Market Value (US$ Mn), By Application 2018-2026
FIG. 125 MEA Pallet display Market Value (US$ Mn), By Material Type 2012-2017
FIG. 126 MEA Pallet display Market Value (US$ Mn), By Material Type 2018-2026
Copyright © Transparency Market Research, Inc. All Rights reserved
Trust Online

Pallet Displays Market