
Reports
Reports
The high protein content of organic pea protein has instigated players in the pea protein market to increase its application in dietary supplements, meat substitutes, and confectionaries. Manufacturers in the organic pea protein market are also increasing their production capabilities of infant nutrition. Organic pea protein is used as a substitute for soy protein to offer hormonal balance in infants. As soy contains phytoestrogens that create hormonal imbalance in babies, manufacturers are resorting to plant-based pea protein to produce baby food. For instance, Nature’s One - a producer of organic food products for infants, announced the launch of Baby’s Only Organic® Pea Protein Formula - the first-of-its-kind infant food product made from plant-based pea protein.
Since soy has the tendency to absorb minerals and contaminants from the soil during its cultivation, manufacturers in the organic pea protein market are streamlining their production processes by introducing pea protein in baby food. This practice will help improve the quality of infant food products and largely benefit consumers.
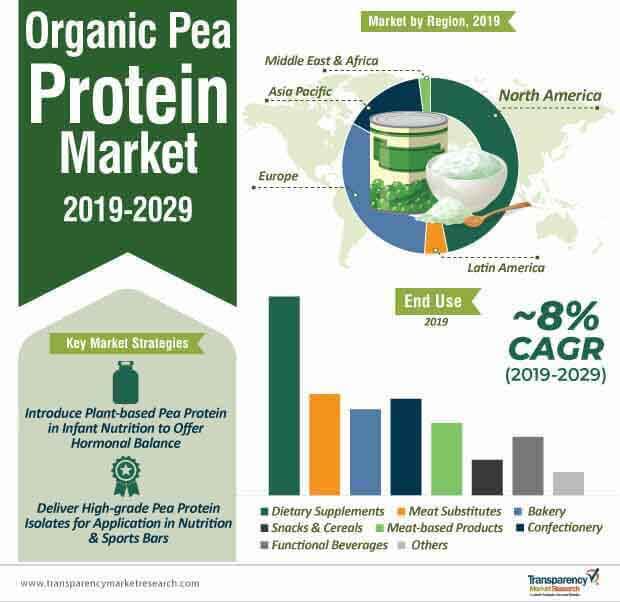
Manufacturers in the organic pea protein market are developing products that are more consumer-centric. They are also making conscious efforts to meet the needs of food and beverage (F&B) manufacturers. For instance, the dietary supplements sector accounted for the highest revenue in 2018, with a value of ~US$ 12 million in the organic pea protein market. This sector will continue to dominate the market throughout the forecast period.
Manufacturers are increasing their research capabilities to innovate in senior nutrition, sports nutrition, and gluten-free products. Weight management is one of the key drivers that has triggered the growth of the organic pea protein market. With increasing number of diet- and health-conscious consumers, manufacturers are increasing awareness about the 'non-GMO' labels for their products.
Consumers are increasingly demanding organic products that are sans artificial colors and additives. To address this trend, manufacturers are introducing organic pea protein isolates that replace a significant percentage of proteins in food products, without altering the color, taste, or texture of the ingredients. For instance, Ingredion - a leading ingredients solution company, announced the launch of VITESSENCE® Pulse 1803 organic pea protein isolate, which can be used in several food and beverage applications.
The desire for a healthier diet and concerns about climate change have also triggered the growth of the organic pea protein market. These aspects have catalyzed consumer interest in plant-based alternatives to manifest animal welfare, and farmers and society well-being. The proliferation of veganism has further created the scope for incremental opportunities in the coming years.
The production of pea protein is comparatively cost-effective as compared to wheat, corn, and soy. This is because the cultivation of peas requires less water; they are drought-tolerant and reduce the need for nitrogen fertilizers. However, insufficient supply of pea protein acts as a hurdle for manufacturers in the organic pea protein market. On other terms, stakeholders in the meat and dairy alternatives market could leeway out of this pain point to gain competitive advantage. Thus, manufacturers need to team up with existing market players to maximize the supply chain in the market.
Analysts’ Viewpoint on Organic Pea Protein Market
Manufacturers in the organic pea protein market are developing a 'bouncy' mouthfeel of animal meat through plant-based alternatives. They are trying to meet consumer demand for plant-based meat without compromising on clean-label and non-GMO standards. The introduction of novel organic pea protein isolates is gaining prominence in powdered and ready-to-drink beverages, baked foods, and baking mixes. Consumers with lactose intolerance are benefitting from these isolates, as these isolates replace allergens such as dairy and egg proteins. However, the side effects of pea protein such as digestion issues, diarrhea, and gout may adversely affect the demand for organic pea protein products. Thus, manufacturers should educate consumers on the judicious consumption of pea protein, and encourage them to seek consultation before the consumption of pea protein.
Organic Pea Protein Market: Overview
Organic Pea Protein Market: Frontrunners
Organic Pea Protein Market: Trends
Organic Pea Protein Market: Strategies
Target Regions for Organic Pea Protein Market
Organic Pea Protein Market: Players
1. Executive Summary
1.1. Market Overview
1.2. Market Analysis
1.3. TMR Analysis and Recommendations
1.4. Wheel of Fortune
2. Market Introduction
2.1. Market Taxonomy
2.2. Market Definition
2.3. Market Overview
3. Market View Point
3.1. Macro-economic Factors
3.2. Opportunity Analysis
3.3. Forecast factors
3.4. Forecast Assumptions
4. Global Organic Pea Protein Market Historical Analysis 2014–2018 and Forecast 2019–2029
4.1. Market Value (US$ Mn), Volume (MT) and Forecast
4.1.1. Market Value (US$ Mn), Volume (MT), and forecast
4.1.2. Absolute $ Opportunity
4.2. Pricing Analysis
4.3. Value Chain
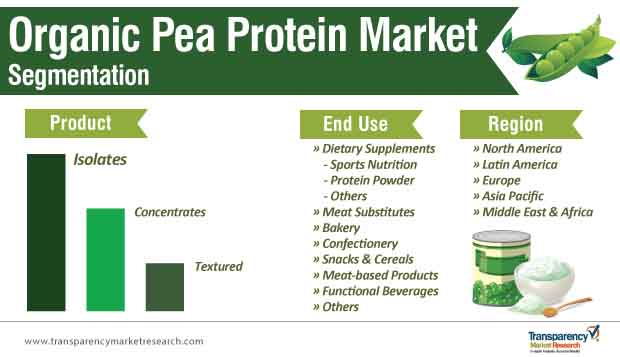
5. Global Organic Pea Protein Market Historical Analysis 2014–2018 and Forecast 2019–2029 , By Product Type
5.1. Introduction
5.2. Historical Market Value (US$ Mn) and Volume (MT) Analysis By Product Type (2014–2018)
5.2.1. Isolates
5.2.2. Concentrates
5.2.3. Textured
5.3. Market Value (US$ Mn) and Volume (MT) Forecast By Product Type (2019-2029)
5.3.1. Isolates
5.3.2. Concentrates
5.3.3. Textured
5.4. Market Attractiveness Analysis By Product Type
5.5. Key Trends
6. Global Organic Pea Protein Market Historical Analysis 2014–2018 and Forecast 2019–2029 , By End-Use
6.1. Introduction
6.2. Historical Market Value (US$ Mn) and Volume (MT) Analysis By End-Use (2014-2018)
6.2.1. Dietary Supplements
6.2.1.1. Sports Nutrition
6.2.1.2. Protein Powder
6.2.1.3. Others
6.2.2. Meat Substitutes
6.2.3. Bakery
6.2.4. Confectionery
6.2.5. Snacks & Cereals
6.2.6. Meat-based Products
6.2.7. Functional Beverages
6.2.8. Others
6.3. Market Value (US$ Mn) and Volume (MT) Forecast By End-Use (2019-2029)
6.3.1. Dietary Supplements
6.3.1.1. Sports Nutrition
6.3.1.2. Protein Powder
6.3.1.3. Others
6.3.2. Meat Substitutes
6.3.3. Bakery
6.3.4. Confectionery
6.3.5. Snacks & Cereals
6.3.6. Meat-based Products
6.3.7. Functional Beverages
6.3.8. Others
6.4. Market Attractiveness Analysis By End-Use
6.5. Key Trends
7. Global Organic Pea Protein Market Historical Analysis 2014–2018 and Forecast, By Region 2019–2029
7.1. Introduction/Key Findings
7.2. Historical Market Value (US$ Mn) and Volume (MT) Analysis By Region (2014–2018)
7.2.1. North America
7.2.2. Latin America
7.2.3. Europe
7.2.4. Asia Pacific
7.2.5. Middle East and Africa
7.3. Market Value (US$ Mn) and Volume (MT) Forecast By Region (2019-2029)
7.3.1. North America
7.3.2. Latin America
7.3.3. Europe
7.3.4. Asia Pacific
7.3.5. Middle East and Africa
7.4. Market Attractiveness Analysis By Region
8. North America Organic Pea Protein Market Analysis 2014–2018 and Forecast 2019–2029
8.1. Introduction
8.2. Pricing Analysis
8.3. Regional Market Dynamics
8.3.1. Drivers
8.3.2. Restraints
8.3.3. Trends
8.4. Historical Market Value (US$ Mn) and Volume (MT) Analysis By Country 2014–2018
8.4.1. U.S.
8.4.2. Canada
8.5. Market Value (US$ Mn) and Volume (MT) Forecast By Country 2019-2029
8.5.1. U.S.
8.5.2. Canada
8.6. Historical Market Value (US$ Mn) and Volume (MT) Analysis By Product Type (2014–2018)
8.6.1. Isolates
8.6.2. Concentrates
8.6.3. Textured
8.7. Market Value (US$ Mn) and Volume (MT) Forecast By Product Type (2019-2029)
8.7.1. Isolates
8.7.2. Concentrates
8.7.3. Textured
8.8. Historical Market Value (US$ Mn) and Volume (MT) Analysis By End-Use (2014-2018)
8.8.1. Dietary Supplements
8.8.1.1. Sports Nutrition
8.8.1.2. Protein Powder
8.8.1.3. Others
8.8.2. Meat Substitutes
8.8.3. Bakery
8.8.4. Confectionery
8.8.5. Snacks & Cereals
8.8.6. Meat-based Products
8.8.7. Functional Beverages
8.8.8. Others
8.9. Market Value (US$ Mn) and Volume (MT) Forecast By End-Use (2019-2029)
8.9.1. Dietary Supplements
8.9.1.1. Sports Nutrition
8.9.1.2. Protein Powder
8.9.1.3. Others
8.9.2. Meat Substitutes
8.9.3. Bakery
8.9.4. Confectionery
8.9.5. Snacks & Cereals
8.9.6. Meat-based Products
8.9.7. Functional Beverages
8.9.8. Others
8.10. Drivers and Restraints: Impact Analysis
8.11. Market Attractiveness Analysis
8.11.1. By Country
8.11.2. By Product Type
8.11.3. By End-use
8.12. Key Representative Market Participants
8.13. Market Presence of Regional Players (Intensity Map)
9. Latin America Organic Pea Protein Market Analysis 2014–2018 and Forecast 2019–2029
9.1. Introduction
9.2. Pricing Analysis
9.3. Regional Market Dynamics
9.3.1. Drivers
9.3.2. Restraints
9.3.3. Trends
9.4. Historical Market Value (US$ Mn) and Volume (MT) Analysis By Country 2014–2018
9.4.1. Brazil
9.4.2. Mexico
9.4.3. Rest of Latin America
9.5. Market Value (US$ Mn) and Volume (MT) Forecast By Country 2019-2029
9.5.1. Brazil
9.5.2. Mexico
9.5.3. Rest of Latin America
9.6. Historical Market Value (US$ Mn) and Volume (MT) Analysis By Product Type (2014–2018)
9.6.1. Isolates
9.6.2. Concentrates
9.6.3. Textured
9.7. Market Value (US$ Mn) and Volume (MT) Forecast By Product Type (2019-2029)
9.7.1. Isolates
9.7.2. Concentrates
9.7.3. Textured
9.8. Historical Market Value (US$ Mn) and Volume (MT) Analysis By End-Use (2014-2018)
9.8.1. Dietary Supplements
9.8.1.1. Sports Nutrition
9.8.1.2. Protein Powder
9.8.1.3. Others
9.8.2. Meat Substitutes
9.8.3. Bakery
9.8.4. Confectionery
9.8.5. Snacks & Cereals
9.8.6. Meat-based Products
9.8.7. Functional Beverages
9.8.8. Others
9.9. Market Value (US$ Mn) and Volume (MT) Forecast By End-Use (2019-2029)
9.9.1. Dietary Supplements
9.9.1.1. Sports Nutrition
9.9.1.2. Protein Powder
9.9.1.3. Others
9.9.2. Meat Substitutes
9.9.3. Bakery
9.9.4. Confectionery
9.9.5. Snacks & Cereals
9.9.6. Meat-based Products
9.9.7. Functional Beverages
9.9.8. Others
9.10. Drivers and Restraints: Impact Analysis
9.11. Market Attractiveness Analysis
9.11.1. By Country
9.11.2. By Product Type
9.11.3. By End-use
9.12. Key Representative Market Participants
9.13. Market Presence of Regional Players (Intensity Map)
10. Europe Organic Pea Protein Market Analysis 2014–2018 and Forecast 2019–2029
10.1. Introduction
10.2. Pricing Analysis
10.3. Regional Market Dynamics
10.3.1. Drivers
10.3.2. Restraints
10.3.3. Trends
10.4. PESTLE Analysis
10.5. Porter’s Five Forces Analysis
10.6. Historical Market Value (US$ Mn) and Volume (MT) Analysis By Country 2014–2018
10.6.1. Germany
10.6.2. France
10.6.3. U.K.
10.6.4. Spain
10.6.5. Italy
10.6.6. BENELUX
10.6.7. Nordic
10.6.8. Russia
10.6.9. Rest of Western Europe
10.7. Market Value (US$ Mn) and Volume (MT) Forecast By Country 2019-2029
10.7.1. Germany
10.7.2. France
10.7.3. U.K.
10.7.4. Spain
10.7.5. Italy
10.7.6. BENELUX
10.7.7. Nordic
10.7.8. Russia
10.7.9. Rest of Western Europe
10.8. Historical Market Value (US$ Mn) and Volume (MT) Analysis By Product Type (2014–2018)
10.8.1. Isolates
10.8.2. Concentrates
10.8.3. Textured
10.9. Market Value (US$ Mn) and Volume (MT) Forecast By Product Type (2019-2029)
10.9.1. Isolates
10.9.2. Concentrates
10.9.3. Textured
10.10. Historical Market Value (US$ Mn) and Volume (MT) Analysis By End-Use (2014-2018)
10.10.1. Dietary Supplements
10.10.1.1. Sports Nutrition
10.10.1.2. Protein Powder
10.10.1.3. Others
10.10.2. Meat Substitutes
10.10.3. Bakery
10.10.4. Confectionery
10.10.5. Snacks & Cereals
10.10.6. Meat-based Products
10.10.7. Functional Beverages
10.10.8. Others
10.11. Market Value (US$ Mn) and Volume (MT) Forecast By End-Use (2019-2029)
10.11.1. Dietary Supplements
10.11.1.1. Sports Nutrition
10.11.1.2. Protein Powder
10.11.1.3. Others
10.11.2. Meat Substitutes
10.11.3. Bakery
10.11.4. Confectionery
10.11.5. Snacks & Cereals
10.11.6. Meat-based Products
10.11.7. Functional Beverages
10.11.8. Others
10.12. Drivers and Restraints: Impact Analysis
10.13. Market Attractiveness Analysis
10.13.1. By Country
10.13.2. By Product Type
10.13.3. By End-use
10.14. Key Representative Market Participants
10.15. Market Presence of Regional Players (Intensity Map)
11. Asia Pacific Organic Pea Protein Market Analysis 2014–2018 and Forecast 2019–2029
11.1. Introduction
11.2. Pricing Analysis
11.3. Regional Market Dynamics
11.3.1. Drivers
11.3.2. Restraints
11.3.3. Trends
11.4. PESTLE Analysis
11.5. Porter’s Five Forces Analysis
11.6. Historical Market Value (US$ Mn) and Volume (MT) Analysis By Country 2014–2018
11.6.1. China
11.6.2. India
11.6.3. Japan
11.6.4. Australia and New Zealand
11.6.5. Rest of APEJ
11.7. Market Value (US$ Mn) and Volume (MT) Forecast By Country 2019-2029
11.7.1. China
11.7.2. India
11.7.3. Japan
11.7.4. Australia and New Zealand
11.7.5. Rest of APEJ
11.8. Historical Market Value (US$ Mn) and Volume (MT) Analysis By Product Type (2014–2018)
11.8.1. Isolates
11.8.2. Concentrates
11.8.3. Textured
11.9. Market Value (US$ Mn) and Volume (MT) Forecast By Product Type (2019-2029)
11.9.1. Isolates
11.9.2. Concentrates
11.9.3. Textured
11.10. Historical Market Value (US$ Mn) and Volume (MT) Analysis By End-Use (2014-2018)
11.10.1. Dietary Supplements
11.10.1.1. Sports Nutrition
11.10.1.2. Protein Powder
11.10.1.3. Others
11.10.2. Meat Substitutes
11.10.3. Bakery
11.10.4. Confectionery
11.10.5. Snacks & Cereals
11.10.6. Meat-based Products
11.10.7. Functional Beverages
11.10.8. Others
11.11. Market Value (US$ Mn) and Volume (MT) Forecast By End-Use (2019-2029)
11.11.1. Dietary Supplements
11.11.1.1. Sports Nutrition
11.11.1.2. Protein Powder
11.11.1.3. Others
11.11.2. Meat Substitutes
11.11.3. Bakery
11.11.4. Confectionery
11.11.5. Snacks & Cereals
11.11.6. Meat-based Products
11.11.7. Functional Beverages
11.11.8. Others
11.12. Drivers and Restraints: Impact Analysis
11.13. Market Attractiveness Analysis
11.13.1. By Country
11.13.2. By Product Type
11.13.3. By End-use
11.14. Key Representative Market Participants
11.15. Market Presence of Regional Players (Intensity Map)
12. Middle East and Africa Organic Pea Protein Market Analysis 2014–2018 and Forecast 2019–2029
12.1. Introduction
12.2. Pricing Analysis
12.3. Regional Market Dynamics
12.3.1. Drivers
12.3.2. Restraints
12.3.3. Trends
12.4. PESTLE Analysis
12.5. Porter’s Five Forces Analysis
12.6. Historical Market Value (US$ Mn) and Volume (MT) Analysis By Country (2014–2018)
12.6.1. GCC
12.6.2. South Africa
12.6.3. Rest of Middle East and Africa
12.7. Market Value (US$ Mn) and Volume (MT) Forecast By Country (2019-2029)
12.7.1. GCC
12.7.2. South Africa
12.7.3. Rest of Middle East and Africa
12.8. Historical Market Value (US$ Mn) and Volume (MT) Analysis By Product Type (2014–2018)
12.8.1. Isolates
12.8.2. Concentrates
12.8.3. Textured
12.9. Market Value (US$ Mn) and Volume (MT) Forecast By Product Type (2019-2029)
12.9.1. Isolates
12.9.2. Concentrates
12.9.3. Textured
12.10. Historical Market Value (US$ Mn) and Volume (MT) Analysis By End-Use (2014-2018)
12.10.1. Dietary Supplements
12.10.1.1. Sports Nutrition
12.10.1.2. Protein Powder
12.10.1.3. Others
12.10.2. Meat Substitutes
12.10.3. Bakery
12.10.4. Confectionery
12.10.5. Snacks & Cereals
12.10.6. Meat-based Products
12.10.7. Functional Beverages
12.10.8. Others
12.11. Market Value (US$ Mn) and Volume (MT) Forecast By End-Use (2019-2029)
12.11.1. Dietary Supplements
12.11.1.1. Sports Nutrition
12.11.1.2. Protein Powder
12.11.1.3. Others
12.11.2. Meat Substitutes
12.11.3. Bakery
12.11.4. Confectionery
12.11.5. Snacks & Cereals
12.11.6. Meat-based Products
12.11.7. Functional Beverages
12.11.8. Others
12.12. Drivers and Restraints: Impact Analysis
12.13. Market Attractiveness Analysis
12.13.1. By Country
12.13.2. By Product Type
12.13.3. By End-use
12.14. Key Representative Market Participants
12.15. Market Presence of Regional Players (Intensity Map)
13. Competition Landscape
13.1. Market Structure
13.2. Market Share Analysis
13.3. Competition Intensity Mapping By Market Taxonomy
13.4. Competition Dashboard
13.5. Company Profiles of Organic Pea Protein Companies - Tentative
(Details – Overview, Financials, Strategy, Recent Developments)
13.5.1. Farbest Brands
13.5.1.1. Overview
13.5.1.2. Financials
13.5.1.3. Strategy
13.5.1.4. Recent Developments
13.5.2. The Green Labs LLC
13.5.2.1. Overview
13.5.2.2. Financials
13.5.2.3. Strategy
13.5.2.4. Recent Developments
13.5.3. The Green Labs LLC
13.5.3.1. Overview
13.5.3.2. Financials
13.5.3.3. Strategy
13.5.3.4. Recent Developments
13.5.4. Greenway Organics (Tianjin) Co., Ltd
13.5.4.1. Overview
13.5.4.2. Financials
13.5.4.3. Strategy
13.5.4.4. Recent Developments
13.5.5. Vestkorn
13.5.5.1. Overview
13.5.5.2. Financials
13.5.5.3. Strategy
13.5.5.4. Recent Developments
13.5.6. YT (XI’AN) Biochem Co.
13.5.6.1. Overview
13.5.6.2. Financials
13.5.6.3. Strategy
13.5.6.4. Recent Developments
13.5.7. Axiom Foods, Inc.
13.5.7.1. Overview
13.5.7.2. Financials
13.5.7.3. Strategy
13.5.7.4. Recent Developments
13.5.8. Phyto-Therapy Pty Ltd.
13.5.8.1. Overview
13.5.8.2. Financials
13.5.8.3. Strategy
13.5.8.4. Recent Developments
13.5.9. Puris
13.5.9.1. Overview
13.5.9.2. Financials
13.5.9.3. Strategy
13.5.9.4. Recent Developments
13.5.10. MaxsunA Industries, Inc.
13.5.10.1. Overview
13.5.10.2. Financials
13.5.10.3. Strategy
13.5.10.4. Recent Developments
13.5.11. A&B Ingredients
13.5.11.1. Overview
13.5.11.2. Financials
13.5.11.3. Strategy
13.5.11.4. Recent Developments
13.5.12. Bioway (Xi'an) Organic Ingredients Co. Ltd.
13.5.12.1. Overview
13.5.12.2. Financials
13.5.12.3. Strategy
13.5.12.4. Recent Developments
13.5.13. Others
14. Research Methodology
TMR utilizes a robust methodology and approach to arrive at market size and related projections. The research methodology for this report is based on 3 dimensional model. We conducted about 45 - 60 minimum duration detailed interviews with Organic Pea Protein Product Type providers and end-users, along with other channel partners; apart from this we also collect market feedback from industry experts. To validate this data we interact with senior panel members having more than 10 years of experience in relevant field. The panel members help in validating the findings and fill the gaps if any. In addition, we leverage on our existing pool of information, paid database and other valid information sources available in public domain. Usually industry interactions extend to more than 50+ interviews from market participants across the value chain.
List of Tables:
Table 01: Global Organic Pea Protein Market Value (US$ Mn) Analysis and Forecast by Product Type, 2017-2026
Table 02: Global Organic Pea Protein Market Volume (MT) Analysis and Forecast by Product Type, 2017-2026
Table 03: Global Organic Pea Protein Market Value (US$ Mn) Analysis and Forecast by End Use, 2017-2026
Table 03: Global Organic Pea Protein Market Volume (MT) Analysis and Forecast by End Use, 2017-2026
Table 05: Global Organic Pea Protein Market Value (US$ Mn) Analysis and Forecast by Dietary Supplements Segment, 2017-2026
Table 06: Global Organic Pea Protein Market Volume (MT) Analysis and Forecast by Dietary Supplements, 2017-2026
Table 07: North America Organic Pea Protein Market Value (US$ Mn) Analysis and Forecast by Product Type, 2017-2026
Table 08: North America Organic Pea Protein Market Volume (MT) Analysis and Forecast by Product Type, 2017-2026
Table 09: North America Organic Pea Protein Market Value (US$ Mn) Analysis and Forecast by End Use, 2017-2026
Table 10: North America Organic Pea Protein Market Volume (MT) Analysis and Forecast by End Use, 2017-2026
Table 11: North America Organic Pea Protein Market Value (US$ Mn) Analysis and Forecast by Dietary Supplements Segment, 2017-2026
Table 12: North America Organic Pea Protein Market Volume (MT) Analysis and Forecast by Dietary Supplements, 2017-2026
Table 13: North America Organic Pea Protein Market Value (US$ Mn) Analysis and Forecast by Country, 2017-2026
Table 14: North America Organic Pea Protein Market Volume (MT) Analysis and Forecast by Country, 2017-2026
Table 15: Latin America Organic Pea Protein Market Value (US$ Mn) Analysis and Forecast by Product Type, 2017-2026
Table 16: Latin America Organic Pea Protein Market Volume (MT) Analysis and Forecast by Product Type, 2017-2026
Table 17: Latin America Organic Pea Protein Market Value (US$ Mn) Analysis and Forecast by End Use, 2017-2026
Table 18: Latin America Organic Pea Protein Market Volume (MT) Analysis and Forecast by End Use, 2017-2026
Table 19: Latin America Organic Pea Protein Market Value (US$ Mn) Analysis and Forecast by Dietary Supplements Segment, 2017-2026
Table 20: Latin America Organic Pea Protein Market Volume (MT) Analysis and Forecast by Dietary Supplements, 2017-2026
Table 21: Latin America Organic Pea Protein Market Value (US$ Mn) Analysis and Forecast by Country, 2017-2026
Table 22: Latin America Organic Pea Protein Market Volume (MT) Analysis and Forecast by Country, 2017-2026
Table 23: Europe Organic Pea Protein Market Value (US$ Mn) Analysis and Forecast by Product Type, 2017-2026
Table 24: Europe Organic Pea Protein Market Volume (MT) Analysis and Forecast by Product Type, 2017-2026
Table 25: Europe Organic Pea Protein Market Value (US$ Mn) Analysis and Forecast by End Use, 2017-2026
Table 26: Europe Organic Pea Protein Market Volume (MT) Analysis and Forecast by End Use, 2017-2026
Table 27: Europe Organic Pea Protein Market Value (US$ Mn) Analysis and Forecast by Dietary Supplements Segment, 2017-2026
Table 28: Europe Organic Pea Protein Market Volume (MT) Analysis and Forecast by Dietary Supplements, 2017-2026
Table 29: Europe Organic Pea Protein Market Value (US$ Mn) Analysis and Forecast by Country, 2017-2026
Table 30: Europe Organic Pea Protein Market Volume (MT) Analysis and Forecast by Country, 2017-2026
Table 31: Asia Pacific Organic Pea Protein Market Value (US$ Mn) Analysis and Forecast by Product Type, 2017-2026
Table 32: Asia Pacific Organic Pea Protein Market Volume (MT) Analysis and Forecast by Product Type, 2017-2026
Table 33: Asia Pacific Organic Pea Protein Market Value (US$ Mn) Analysis and Forecast by End Use, 2017-2026
Table 34: Asia Pacific Organic Pea Protein Market Volume (MT) Analysis and Forecast by End Use, 2017-2026
Table 35: Asia Pacific Organic Pea Protein Market Value (US$ Mn) Analysis and Forecast by Dietary Supplements Segment, 2017-2026
Table 36: Asia Pacific Organic Pea Protein Market Volume (MT) Analysis and Forecast by Dietary Supplements, 2017-2026
Table 37: Asia Pacific Organic Pea Protein Market Value (US$ Mn) Analysis and Forecast by Country, 2017-2026
Table 38: Asia Pacific Organic Pea Protein Market Volume (MT) Analysis and Forecast by Country, 2017-2026
Table 39: Middle East & Africa Organic Pea Protein Market Value (US$ Mn) Analysis and Forecast by Product Type, 2017-2026
Table 40: Middle East & Africa Organic Pea Protein Market Volume (MT) Analysis and Forecast by Product Type, 2017-2026
Table 41: Middle East & Africa Organic Pea Protein Market Value (US$ Mn) Analysis and Forecast by End Use, 2017-2026
Table 42: Middle East & Africa Organic Pea Protein Market Volume (MT) Analysis and Forecast by End Use, 2017-2026
Table 43: Middle East & Africa Organic Pea Protein Market Value (US$ Mn) Analysis and Forecast by Dietary Supplements Segment, 2017-2026
Table 44: Middle East & Africa Organic Pea Protein Market Volume (MT) Analysis and Forecast by Dietary Supplements, 2017-2026
Table 45: Middle East & Africa Organic Pea Protein Market Value (US$ Mn) Analysis and Forecast by Country, 2017-2026
Table 46: Middle East & Africa Organic Pea Protein Market Volume (MT) Analysis and Forecast by Country, 2017-2026
List of Figures:
Figure 01: Global Organic Pea Protein Market Value (US$ Mn) and Volume (MT) Forecast, 2017–2026
Figure 02: Global Pea Protein Market Absolute $ Opportunity (US$ Mn), 2018?2026
Figure 03: Global Organic Pea Protein Market Share (%) & BPS Analysis by Product Type, 2018 & 2026
Figure 04: Global Organic Pea Protein Market Y-o-Y Growth Rate (%) by Product Type, 2018-2026
Figure 05: Global Organic Pea Protein Market Value (US$ Mn) Analysis & Forecast by Product Type, 2018–2026
Figure 06: Global Organic Pea Protein Market Volume (MT) Analysis & Forecast by Product Type, 2018–2026
Figure 07: Global Organic Pea Protein Market Share (%) & BPS Analysis by End Use, 2018 & 2026
Figure 08: Global Organic Pea Protein Market Y-o-Y Growth Rate (%) by End Use, 2018-2026
Figure 09: Global Organic Pea Protein Market Value (US$ Mn) Analysis & Forecast by End Use, 2018 & 2026
Figure 10: Global Organic Pea Protein Market Volume (MT) Analysis & Forecast by End Use, 2018 & 2026
Figure 11: Global Organic Pea Protein Market Value (US$ Mn) Analysis & Forecast by Dietary Supplements Segment, 2018 & 2026
Figure 12: Global Organic Pea Protein Market Volume (MT) Analysis & Forecast by Dietary Supplements Segment, 2018 & 2026
Figure 13: Global Organic Pea Protein Market Attractiveness by Product Type
Figure 14: Global Organic Pea Protein Market Attractiveness by End Use
Figure 15: Global Organic Pea Protein Market Attractiveness by Region
Figure 16: North America Organic Pea Protein Market Value (US$ Mn) and Volume (MT) Forecast, 2017–2026
Figure 17: North America Pea Protein Market Absolute $ Opportunity (US$ Mn), 2018?2026
Figure 18: North America Organic Pea Protein Market Share (%) & BPS Analysis by Country, 2018 & 2026
Figure 19: North America Organic Pea Protein Market Y-o-Y Growth Rate (%) by Country, 2018-2026
Figure 20: North America Organic Pea Protein Market Value (US$ Mn) Analysis & Forecast by Country, 2018 & 2026
Figure 21: North America Organic Pea Protein Market Volume (MT) Analysis & Forecast by Country, 2018 & 2026
Figure 22: North America Organic Pea Protein Market Share (%) & BPS Analysis by Product Type, 2018 & 2026
Figure 23: North America Organic Pea Protein Market Y-o-Y Growth Rate (%) by Product Type, 2018-2026
Figure 24: North America Organic Pea Protein Market Value (US$ Mn) Analysis & Forecast by Product Type, 2018 & 2026
Figure 25: North America Organic Pea Protein Market Volume (MT) Analysis & Forecast by Product Type, 2018 & 2026
Figure 26: North America Organic Pea Protein Market Share (%) & BPS Analysis by End Use, 2018 & 2026
Figure 27: North America Organic Pea Protein Market Y-o-Y Growth Rate (%) by End Use, 2018-2026
Figure 28: North America Organic Pea Protein Market Value (US$ Mn) Analysis & Forecast by End Use, 2018 & 2026
Figure 29: North America Organic Pea Protein Market Volume (MT) Analysis & Forecast by End Use, 2018 & 2026
Figure 30: North America Organic Pea Protein Market Value (US$ Mn) Analysis & Forecast by Dietary Supplements Segment, 2018 & 2026
Figure 31: North America Organic Pea Protein Market Volume (MT) Analysis & Forecast by Dietary Supplements Segment, 2018 & 2026
Figure 32: North America Organic Pea Protein Market Attractiveness by Product Type
Figure 33: North America Organic Pea Protein Market Attractiveness by End Use
Figure 34: North America Organic Pea Protein Market Attractiveness by Country
Figure 35: Latin America Organic Pea Protein Market Value (US$ Mn) and Volume (MT) Forecast, 2017–2026
Figure 36: Latin America Pea Protein Market Absolute $ Opportunity (US$ Mn), 2018?2026
Figure 37: Latin America Organic Pea Protein Market Share (%) & BPS Analysis by Country, 2018 & 2026
Figure 38: Latin America Organic Pea Protein Market Y-o-Y Growth Rate (%) by Country, 2018-2026
Figure 39: Latin America Organic Pea Protein Market Value (US$ ‘000) Analysis & Forecast by Country, 2018 & 2026
Figure 40: Latin America Organic Pea Protein Market Volume (MT) Analysis & Forecast by Country, 2018 & 2026
Figure 41: Latin America Organic Pea Protein Market Share (%) & BPS Analysis by Product Type, 2018 & 2026
Figure 42: Latin America Organic Pea Protein Market Y-o-Y Growth Rate (%) by Product Type, 2018-2026
Figure 43: Latin America Organic Pea Protein Market Value (US$ ‘000) Analysis & Forecast by Product Type, 2018 & 2026
Figure 44: Latin America Organic Pea Protein Market Volume (MT) Analysis & Forecast by Product Type, 2018 & 2026
Figure 45: Latin America Organic Pea Protein Market Share (%) & BPS Analysis by End Use, 2018 & 2026
Figure 46: Latin America Organic Pea Protein Market Y-o-Y Growth Rate (%) by End Use, 2018-2026
Figure 47: Latin America Organic Pea Protein Market Value (US$ ‘000) Analysis & Forecast by End Use, 2018 & 2026
Figure 48: Latin America Organic Pea Protein Market Volume (MT) Analysis & Forecast by End Use, 2018 & 2026
Figure 49: Latin America Organic Pea Protein Market Value (US$ Mn) Analysis & Forecast by Dietary Supplements Segment, 2018 & 2026
Figure 50: Latin America Organic Pea Protein Market Volume (MT) Analysis & Forecast by Dietary Supplements Segment, 2018 & 2026
Figure 51: Latin America Organic Pea Protein Market Attractiveness by Product Type
Figure 52: Latin America Organic Pea Protein Market Attractiveness by End Use
Figure 53: Latin America Organic Pea Protein Market Attractiveness by Country
Figure 54: Europe Organic Pea Protein Market Value (US$ Mn) and Volume (MT) Forecast, 2017–2026
Figure 55: Europe Pea Protein Market Absolute $ Opportunity (US$ Mn), 2018?2026
Figure 56: Europe Organic Pea Protein Market Share (%) & BPS Analysis by Country, 2018 & 2026
Figure 57: Europe Organic Pea Protein Market Y-o-Y Growth Rate (%) by Country, 2018-2026
Figure 58: Europe Organic Pea Protein Market Value (US$ Mn) Analysis & Forecast by Country, 2018 & 2026
Figure 59: Europe Organic Pea Protein Market Volume (MT) Analysis & Forecast by Country, 2018 & 2026
Figure 60: Europe Organic Pea Protein Market Share (%) & BPS Analysis by Product Type, 2018 & 2026
Figure 61: Europe Organic Pea Protein Market Y-o-Y Growth Rate (%) by Product Type, 2018-2026
Figure 62: Europe Organic Pea Protein Market Value (US$ Mn) Analysis & Forecast by Product Type, 2018 & 2026
Figure 63: Europe Organic Pea Protein Market Volume (MT) Analysis & Forecast by Product Type, 2018 & 2026
Figure 64: Europe Organic Pea Protein Market Share (%) & BPS Analysis by End Use, 2018 & 2026
Figure 65: Europe Organic Pea Protein Market Y-o-Y Growth Rate (%) by End Use, 2018-2026
Figure 66: Europe Organic Pea Protein Market Value (US$ Mn) Analysis & Forecast by End Use, 2018 & 2026
Figure 67: Europe Organic Pea Protein Market Volume (MT) Analysis & Forecast by End Use, 2018 & 2026
Figure 68: Europe Organic Pea Protein Market Value (US$ Mn) Analysis & Forecast by Dietary Supplements Segment, 2018 & 2026
Figure 69: Europe Organic Pea Protein Market Volume (MT) Analysis & Forecast by Dietary Supplements Segment, 2018 & 2026
Figure 70: Europe Organic Pea Protein Market Attractiveness by Product Type
Figure 71: Europe Organic Pea Protein Market Attractiveness by End Use
Figure 72: Europe Organic Pea Protein Market Attractiveness by Country
Figure 73: North America Organic Pea Protein Market Value (US$ Mn) and Volume (MT) Forecast, 2017–2026
Figure 74: Asia Pacific Pea Protein Market Absolute $ Opportunity (US$ Mn), 2018?2026
Figure 75: Asia Pacific Organic Pea Protein Market Share (%) & BPS Analysis by Country, 2018 & 2026
Figure 76: Asia Pacific Organic Pea Protein Market Y-o-Y Growth Rate (%) by Country, 2018-2026
Figure 77: Asia Pacific Organic Pea Protein Market Value (US$ Mn) Analysis & Forecast by Country, 2018 & 2026
Figure 78: Asia Pacific Organic Pea Protein Market Volume (MT) Analysis & Forecast by Country, 2018 & 2026
Figure 79: Asia Pacific Organic Pea Protein Market Share (%) & BPS Analysis by Product Type, 2018 & 2026
Figure 80: Asia Pacific Organic Pea Protein Market Y-o-Y Growth Rate (%) by Product Type, 2018-2026
Figure 81: Asia Pacific Organic Pea Protein Market Value (US$ Mn) Analysis & Forecast by Product Type, 2018 & 2026
Figure 82: Asia Pacific Organic Pea Protein Market Volume (MT) Analysis & Forecast by Product Type, 2018 & 2026
Figure 83: Asia Pacific Organic Pea Protein Market Share (%) & BPS Analysis by End Use, 2018 & 2026
Figure 84: Asia Pacific Organic Pea Protein Market Y-o-Y Growth Rate (%) by End Use, 2018-2026
Figure 85: Asia Pacific Organic Pea Protein Market Value (US$ Mn) Analysis & Forecast by End Use, 2018 & 2026
Figure 86: Asia Pacific Organic Pea Protein Market Volume (MT) Analysis & Forecast by End Use, 2018 & 2026
Figure 87: Asia Pacific Organic Pea Protein Market Value (US$ Mn) Analysis & Forecast by Dietary Supplements Segment, 2018 & 2026
Figure 88: Asia Pacific Organic Pea Protein Market Volume (MT) Analysis & Forecast by Dietary Supplements Segment, 2018 & 2026
Figure 89: Asia Pacific Organic Pea Protein Market Attractiveness by Product Type
Figure 90: Asia Pacific Organic Pea Protein Market Attractiveness by End Use
Figure 91: Asia Pacific Organic Pea Protein Market Attractiveness by Country
Figure 92: MEA Organic Pea Protein Market Value (US$ Mn) and Volume (MT) Forecast, 2017–2026
Figure 93: MEA Pea Protein Market Absolute $ Opportunity (US$ Mn), 2018?2026
Figure 94: Middle East & Africa Organic Pea Protein Market Share (%) & BPS Analysis by Country, 2018 & 2026
Figure 95: Middle East & Africa Organic Pea Protein Market Y-o-Y Growth Rate (%) by Country, 2018-2026
Figure 96: Middle East & Africa Organic Pea Protein Market Value (US$ ‘000) Analysis & Forecast by Country, 2018 & 2026
Figure 97: Middle East & Africa Organic Pea Protein Market Volume (MT) Analysis & Forecast by Country, 2018 & 2026
Figure 98: Middle East & Africa Organic Pea Protein Market Share (%) & BPS Analysis by Product Type, 2018 & 2026
Figure 99: Middle East & Africa Organic Pea Protein Market Y-o-Y Growth Rate (%) by Product Type, 2018 & 2026
Figure 100: Middle East & Africa Organic Pea Protein Market Value (US$ ‘000) Analysis & Forecast by Product Type, 2018 & 2026
Figure 101: Middle East & Africa Organic Pea Protein Market Volume (MT) Analysis & Forecast by Product Type, 2018 & 2026
Figure 102: Middle East & Africa Organic Pea Protein Market Share (%) & BPS Analysis by End Use, 2018 & 2026
Figure 103: Middle East & Africa Organic Pea Protein Market Y-o-Y Growth Rate (%) by End Use, 2018-2026
Figure 104: Middle East & Africa Organic Pea Protein Market Value (US$ ‘000) Analysis & Forecast by End Use, 2018 & 2026
Figure 105: Middle East & Africa Organic Pea Protein Market Volume (MT) Analysis & Forecast by End Use, 2018 & 2026
Figure 106: Middle East & Africa Organic Pea Protein Market Value (US$ Mn) Analysis & Forecast by Dietary Supplements Segment, 2018 & 2026
Figure 107: Middle East & Africa Organic Pea Protein Market Volume (MT) Analysis & Forecast by Dietary Supplements Segment, 2018 & 2026
Figure 108: Asia Pacific Organic Pea Protein Market Attractiveness by Product Type
Figure 109: Asia Pacific Organic Pea Protein Market Attractiveness by End Use
Figure 110: Asia Pacific Organic Pea Protein Market Attractiveness by Country
Copyright © Transparency Market Research, Inc. All Rights reserved
Trust Online

Organic Pea Protein Market Trends, 2019-2029