Ophthalmology Diagnostics and Surgical Devices Market

Ophthalmology Diagnostics and Surgical Devices Market (Optical Coherence Tomography, Echography, Corneal Topographers, Specular Microscopes, Cataract, Refractive, Glaucoma and Vitreoretinal Surgery Devices) - Global Industry Analysis, Size, Share, Growth, Trends and Forecast, 2013 - 2019

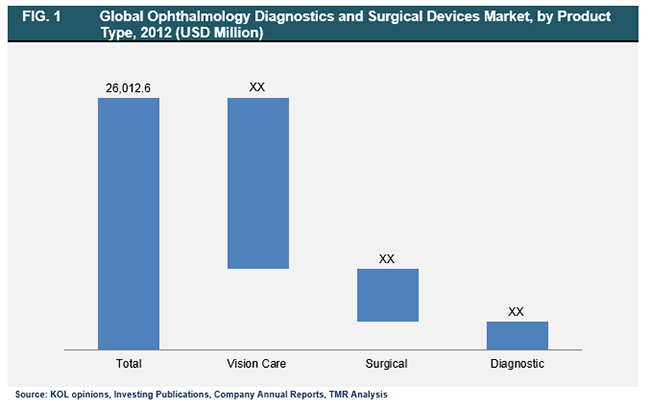
Ophthalmology industry is witnessing a rapid pace of technological advances in order to achieve efficient diagnosis and treatment platforms. Maintenance of normal vision is vital as eyes are one of the most crucial sensory organs. Defects in vision and other infections, inflammations may result in complete loss vision. Hence, various ophthalmological diagnostic and surgical treatment devices play an utmost important role so as to avoid vision loss and improve the quality of life of patients. The ophthalmic diagnostic platforms aid the ophthalmologist to have a detailed view of the internal eye structure and helps in examination of the microvasculature of the eye. Thus, providing appropriate diagnosis of the ophthalmic condition. Post diagnosis the patients are either prescribed vision care products in case of normal vision corrections (refractive errors) or surgeries are performed based on ophthalmic condition. The major factors attributing towards the growth and proliferation of ophthalmological devices market are its persistent product modifications and continuous rise in geriatric population. Furthermore, high demand for efficient diagnostic platforms, minimally invasive surgeries, and improved healthcare infrastructure is also propelling the growth of this market. On the contrary, high cost of the high end advanced diagnostic platforms, technologically advanced surgical procedures coupled with lack of professional expertise might restrain the growth of ophthalmology devices market. The global market for ophthalmology devices market was valued at USD 26,012.6 million in 2012 and is estimated to reach USD 40,381.6 million by 2019 growing at a CAGR of 6.6 % from 2013 to 2019.

Ophthalmology devices market can be analyzed by product type, applications and geography. The product type is further segmented into several diagnostic, surgery devices and vision care products. Vision care segment accounted for the largest market segment and was valued at USD 17,615.8 million in 2012 growing at CAGR of 7.1% throughout the forecast period from 2013 to 2019. This growth has been attributed towards the growth of large consumer base, rise in the number of advanced software applications along with increase in the incidence of ophthalmic refractive errors. As per the data published by World Health organization (WHO) in the year 2013, around 82% of the people aged 50 and above are currently living with blindness. Also, it had stated that uncorrected refractive errors have led to visual impairments especially in the low and middle income economies.

global ophthalmology diagnostics and surgical market by product devices 2012

Innovation and novelty in several diagnostic platforms such as the use of mobile smart phone applications for eye visualization and hand held instruments has boosted the growth and uptake of several diagnostic platforms. Also with the extensive use of lasers such as femtosecond, excimer and YAG (yttrium aluminum garnet) lasers, ophthalmology surgery devices market is now exhibiting a tremendous growth potential. Moreover, with the use of LASIK (Laser-Assisted in Situ Keratomileusis) surgery techniques, Vitreoretinal techniques, Intra ocular lenses (IOLs) and retinal implants are anticipated to push the growth of surgical equipment market. The applications market of ophthalmology devices represents the diagnosis, surgery and vision care. The diagnostic and surgical applications are interdependent to a certain extent. Post diagnosis of the ophthalmological condition, the mode of treatment is decided.

Regional analysis of ophthalmology devices market covers four major geographic regions namely North America, Europe, Asia-Pacific and Rest of the World (RoW). North America and Europe dominated the global ophthalmology devices market and accounted for largest percentage share accounting for around more than 55% of the total market. This has been justified through the presence and ready acceptance of technological sophistication, improved healthcare policies and well trained ophthalmology professionals in these regions as compared to other developing regions. In addition, growing awareness in patient population has further augmented the growth and development of ophthalmology devices market in these regions. Asia-Pacific region is anticipated to record high growth rate owing to increased efforts of the respective governments of the nations in this region. In addition, improvement in the overall healthcare sector and huge untapped customer base in this region has triggered the market growth. The rapidly flourishing middle class families and increased preference of patient population to avail technologically advanced medical solutions would further support the growth of ophthalmology devices market in the Asia-Pacific region. However, high cost of the diagnostic devices along with minimal standardization along with unstructured reimbursement policies may limit the growth prospects for the development of effective diagnostic and surgical devices.

The overall ophthalmology devices market is highly fragmented with the presence of both well established as well as emerging companies in this field which includes Alcon Laboratories (Novartis), Topcon Corporation, Bausch & Lomb, Inc. and Carl Zeiss Meditec AG, Nidek Corporation, Cooper Vision, Ciba Vision and others. 

    Table of Content
     
    Chapter 1 Introduction
    1.1 Report Description
    1.2 Research Methodology
          1.2.1 Sources
                   1.2.1.1 Secondary Research
                   1.2.1.2 Primary Research
                   1.2.1.3 Models
                   1.2.1.4 Assumptions
    1.3 Market Segmentation
    1.4 List of Abbreviations
     
    Chapter 2 Executive Summary
    2.1 Comparative Analysis: Global Ophthalmology Devices Market, By Geography, 2012 & 2019 (Value %)
     
    Chapter 3 Market Overview
    3.1 Introduction
          3.1.1 Market potential of ophthalmology Devices
          3.1.2 Future technological enhancements of ophthalmology devices market
    3.2 Market Dynamics
          3.2.1 Market Drivers
                  3.2.1.1 Constant rise in geriatric population
                  3.2.1.2 Increasing prevalence of ocular disorders
                  3.2.1.3 Advent of new technologies
          3.2.2 Market Restraints
                   3.2.2.1 High pricing of hi-tech ophthalmology devices
          3.2.3 Market Opportunity
                  3.2.3.1 Lucrative growth opportunities in emerging economies
    3.3 Porter’s Five Force Analysis
          3.3.1 Bargaining Power of Suppliers
          3.3.2 Bargaining Power of Buyers
          3.3.3 Threat of Substitutes
          3.3.4 Threat of New Entrants
          3.3.5 Competitive rivalry
    3.4 Market Attractiveness Analysis
    3.5 Competitive Landscape
          3.5.1 Market Share by Key Players, 2012 (Value %)
     
    Chapter 4 Global ophthalmology Devices Market, by Product Type
    4.1 Overview
          4.1.1 Global Ophthalmology Diagnostics and Surgical Devices Market, by Product Type, 2011 – 2019 (USD Million)
    4.2 Ophthalmology Diagnostic Devices
          4.2.1 Global Ophthalmology Diagnostic Devices Market, by Product Type, 2011 – 2019 (USD Million)
          4.2.2 Autorefractometers
                  4.2.2.1 Global Autorefractors Market Revenue, 2011-2019 (USD million)
          4.2.3 Slit Lamps
                  4.2.3.1 Global Slit Lamps Market Revenue, 2011-2019 (USD million)
          4.2.4 Tonometer
                  4.2.4.1 Global Tonometers Market Revenue, 2011-2019 (USD million)
          4.2.5 Ophthalmoscopes
                  4.2.5.1 Global Tonometers Market Revenue, 2011-2019 (USD million)
          4.2.6 Fundus Cameras
                  4.2.6.1 Global Fundus Cameras Market Revenue, 2011-2019 (USD million)
          4.2.7 Fluorescein Angiography
                  4.2.7.1 Global Fluorescein Angiography Market Revenue, 2011-2019 (USD million)
          4.2.8 Optical Coherence Tomography(OCT) Systems
                   4.2.8.1 Global Optical Coherence Tomography Systems Market Revenue, 2011-2019 (USD million)
          4.2.9 Ophthalmic Echography
                  4.2.9.1 Global Ophthalmic Echography Market Revenue, 2011-2019 (USD million)
          4.2.10 Keratometers
                    4.2.10.1 Global Keratometers Market Revenue, 2011-2019 (USD million)
          4.2.11 Gonioscopes
                    4.2.11.1 Global Gonioscopes Market Revenue, 2011-2019 (USD million)
          4.2.12 Pachymeters
                    4.2.12.1 Global Pachymeters Market Revenue, 2011-2019 (USD million)
          4.2.13 Perimeters
                    4.2.13.1 Global Perimeters Market Revenue, 2011-2019 (USD million)
          4.2.14 Corneal Topographers
                    4.2.14.1 Global Corneal Topographers Market Revenue, 2011-2019 (USD million)
          4.2.15 Specular Microscopes
                    4.2.15.1 Global Specular Microscopes Market Revenue, 2011-2019 (USD million)
          4.2.16 Others
                    4.2.16.1 Global Specular Microscopes Market Revenue, 2011-2019 (USD million)
    4.3 Global Ophthalmic Surgery Devices
          4.3.1 Global Ophthalmic Surgery Devices Market Revenue, 2011-2019 (USD million)
          4.3.2 Vitroeretinal Surgery Devices
                  4.3.2.1 Global Vitreoretinal Surgery Devices Market Revenue, 2011-2019 (USD million)
          4.3.3 Cataract Surgery Devices
                  4.3.3.1 Global Cataract Surgery Devices Market Revenue, 2011-2019 (USD million)
          4.3.4 Glaucoma Surgery Devices
                  4.3.4.1 Global Glaucoma Surgery Devices Market Revenue, 2011-2019 (USD million)
          4.3.5 Refractive Surgery Devices
                  4.3.5.1 Global Refractive Surgery Devices Market Revenue, 2011-2019 (USD million)
    4.4 Vision Care
          4.4.1 Global Vision Care Market Revenue, 2011-2019 (USD million)
          4.4.2 Contact Lenses
                  4.4.2.1 Global Contact Lenses Market Revenue, 2011-2019 (USD million)
          4.4.3 Spectacle Lenses
                  4.4.3.1 Global Spectacle Lenses Market Revenue, 2011-2019 (USD million)
     
    Chapter 5 Global Ophthalmology diagnostics and Surgical Devices Market, by Application
    5.1 Overview
          5.1.1 Global Ophthalmology Diagnostics and Surgical Devices Market Revenue, by Application, 2011-2019 (USD million)
    5.2 Diagnostics
          5.2.1 Global Ophthalmology Diagnostics Application Market Revenue, by Application, 2011-2019 (USD million)
    5.3 Surgical
          5.3.1 Global Ophthalmology Surgical Application Market Revenue, by Application, 2011-2019 (USD million)
    5.4 Vision Care
          5.4.1 Global Ophthalmology Vision Care Application Market Revenue, by Application, 2011-2019 (USD million)
     
    Chapter 6 Global Ophthalmology Diagnostics and Surgical Devices Market, by Geography
    6.1 Overview
          6.1.1 Global Ophthalmology Diagnostics and Surgical Devices Market, by Geography 2011 – 2019 (USD Million)
    6.2 North America
          6.2.1 North America Ophthalmology Diagnostics and Surgical Devices Market Revenue, by Application, 2011-2019 (USD million)
    6.3 Europe
          6.3.1 Europe Ophthalmology Diagnostics and Surgical Devices Market Revenue, by Application, 2011-2019 (USD million)
    6.4 Asia-Pacific
          6.4.1 Asia-Pacific Ophthalmology Diagnostics and Surgical Devices Market Revenue, by Application, 2011-2019 (USD million)
    6.5 Rest of the World (RoW)
          6.5.1 RoW Ophthalmology Diagnostics and Surgical Devices Market Revenue, by Application, 2011-2019 (USD million)
     
    Chapter 7 Recommendations
    7.1 Investing in Emerging Markets
    7.2 Focus on provision of pre and post-purchase services to hospitals, diagnostic labs and private practitioners
    7.3 Mergers and acquisitions to enter and strengthen market presence
    7.4 Enhancing Distribution Networks
     
    Chapter 8 Company Profiles
    8.1 Abbott Medical Optics, Inc.
          8.1.1 Company Overview
          8.1.2 Financial Overview
          8.1.3 Product Portfolio
          8.1.4 Business Strategies
          8.1.5 Recent Developments
    8.2 Alcon Laboratories, Inc.
          8.2.1 Company Overview
          8.2.2 Financial Overview
          8.2.3 Product Portfolio
          8.2.4 Business Strategies
          8.2.5 Recent Developments
    8.3 Bausch & Lomb, Inc. (Valeant Pharmaceuticals)
          8.3.1 Company Overview
          8.3.2 Financial Overview
          8.3.3 Product Portfolio
          8.3.4 Business Strategies
          8.3.5 Recent Developments
    8.4 Carl Zeiss Meditec AG
          8.4.1 Company Overview
          8.4.2 Financial Overview
          8.4.3 Product Portfolio
          8.4.4 Business Strategies
          8.4.5 Recent Developments
    8.5 CooperVision
          8.5.1 Company Overview
          8.5.2 Financial Overview
          8.5.3 Product Portfolio
          8.5.4 Business Strategies
          8.5.5 Recent Developments
    8.6 Essilor International
          8.6.1 Company Overview
          8.6.2 Financial Overview
          8.6.3 Product Portfolio
          8.6.4 Business Strategies
          8.6.5 Recent Developments
    8.7 Hoya Corporation
          8.7.1 Company Overview
          8.7.2 Financial Overview
          8.7.3 Product Portfolio
          8.7.4 Business Strategies
          8.7.5 Recent Developments
    8.8 Johnson & Johnson
          8.8.1 Company Overview
          8.8.2 Financial Overview
          8.8.3 Product Portfolio
          8.8.4 Business Strategies
          8.8.5 Recent Developments
    8.9 STAAR Surgical Company
          8.9.1 Company Overview
          8.9.2 Financial Overview
          8.9.3 Product Portfolio
          8.9.4 Business Strategies
          8.9.5 Recent Developments
    8.10 SynergEyes, Inc.
          8.10.1 Company Overview
          8.10.2 Financial Overview
          8.10.3 Product Portfolio
          8.10.4 Business Strategies
          8.10.5 Recent Developments
    List of Tables
     
    List of Abbreviations
    TABLE 1 Market Snapshot: Global Ophthalmology Diagnostic and Surgical Devices Market
    TABLE 1 Impact Analysis of Market Drivers
    TABLE 2 Impact Analysis of Market Restraints
    TABLE 3 Global Ophthalmology Diagnostics and Surgical Devices Market, by Product Type, 2011 – 2019 (USD Million)
    TABLE 4 Global Ophthalmology Diagnostic Devices Market, by Product Type, 2011 – 2019 (USD Million)
    TABLE 5 Global Ophthalmic Surgery Devices Market Revenue, by Product Type, 2011 – 2019 (USD Million)
    TABLE 6 Global Ophthalmic Vision Care Market Revenue, by Product Type, 2011 – 2019 (USD Million)
    TABLE 7 Global Ophthalmology Diagnostics and Surgical Devices Market Revenue, by Application, 2011 – 2019 (USD Million)
    TABLE 8 Global Ophthalmology Diagnostics and Surgical Devices Market Revenue, by Application, 2011 – 2019 (USD Million)

    List of Figures


    FIG. 1 Ophthalmology Diagnostics and Surgical Devices Market Segmentation

    FIG. 2 Global Ophthalmology Diagnostics and Surgical Devices Market, by Product Type, 2012 (USD Million)

    FIG. 3 Comparative Analysis: Global Ophthalmology Diagnostics and Surgical Devices Market, by Geography, 2012 & 2019 (Value %)

    FIG. 4 Global Rate of Aging Population

    FIG. 5 Porter’s Five Forces Analysis: Global Ophthalmology Devices Market

    FIG. 6 Market Attractiveness Analysis: Global Ophthalmology Diagnostics and Surgical  Devices Market, by Geography

    FIG. 7 Market Share Analysis: Ophthalmology Diagnostics and Surgical Devices Market, 2012 (Value %)

    FIG. 8 Global Autorefractometers Market Revenue, 2011– 2019 (USD Million)

    FIG. 9 Global Slit lamps Market Revenue, 2011– 2019 (USD Million)

    FIG. 10 Global Tonometers Market Revenue, 2011– 2019 (USD Million)

    FIG. 11 Global Ophthalmoscopes Market Revenue, 2011– 2019 (USD Million)

    FIG. 12 Global Fundus Cameras Market Revenue, 2011– 2019 (USD Million)

    FIG. 13 Global Fluorescein Angiography Market Revenue, 2011– 2019 (USD Million)

    FIG. 14 Global Optical Coherence Tomography Systems Market Revenue, 2011– 2019 (USD Million)

    FIG. 15 Global Ophthalmic Echography Market Revenue, 2011– 2019 (USD Million)

    FIG. 16 Global Keratometers Market Revenue, 2011– 2019 (USD Million)

    FIG. 17 Global Gonioscopes Market Revenue, 2011– 2019 (USD Million)

    FIG. 18 Global Pachymeters Market Revenue, 2011– 2019 (USD Million)

    FIG. 19 Global Perimeters Market Revenue, 2011– 2019 (USD Million)

    FIG. 20 Global Corneal Topographers Market Revenue, 2011– 2019 (USD Million)

    FIG. 21 Global Specular Microscopes Market Revenue, 2011– 2019 (USD Million)

    FIG. 22 Global Others Market Revenue, 2011– 2019 (USD Million)

    FIG. 23 Global Vitreoretinal Surgery Devices Market Revenue, 2011– 2019 (USD Million)

    FIG. 24 Global Cataract Surgery Devices Market Revenue, 2011– 2019 (USD Million)

    FIG. 25 Global Glaucoma Surgery Devices Market Revenue, 2011– 2019 (USD Million)

    FIG. 26 Global Refractive Surgery Devices Market Revenue, 2011– 2019 (USD Million)

    FIG. 27 Global Contact Lenses Market Revenue, 2011– 2019 (USD Million)

    FIG. 28 Global Spectacle Lenses Market Revenue, 2011– 2019 (USD Million)

    FIG. 29 Global Ophthalmology Diagnostics Application Market Revenue, 2011– 2019 (USD Million)

    FIG. 30 Global Surgical Application Market Revenue, 2011– 2019 (USD Million)

    FIG. 31 Global Vision Care Application Market Revenue, 2011– 2019 (USD Million)

    FIG. 32 North America Ophthalmology Diagnostics and Surgical Devices Market Revenue, 2011– 2019 (USD Million)

    FIG. 33 Europe Ophthalmology Diagnostics and Surgical Devices Market Revenue, 2011– 2019 (USD Million)

    FIG. 34 Asia-Pacific Ophthalmology Diagnostics and Surgical Devices Market Revenue, 2011– 2019 (USD Million)

    FIG. 35 RoW Ophthalmology Diagnostics and Surgical Devices Market Revenue, 2011– 2019 (USD Million)

    FIG. 36 Alcon Laboratories, Inc., Annual Revenue: 2010 – 2012 (USD Billion)

    FIG. 37 Carl Zeiss Meditec AG, Annual Revenue: 2010 – 2012 (USD Million)

    FIG. 38 CooperVision, Annual Sales: 2010 – 2012 (USD Million)

    FIG. 39 Essilor International, Annual Sales: 2010 – 2012 (USD Million)

    FIG. 40 Hoya Corporation, Annual Sales: 2011 – 2013 (USD Million)

    FIG. 41 Johnson & Johnson, Inc., Annual Revenue: 2010–2012 (USD Million)

    FIG. 42 STAAR Surgical Company, Annual Revenue: 2010 – 2012 (USD Million) 

Copyright © Transparency Market Research, Inc. All Rights reserved