
Reports
Reports
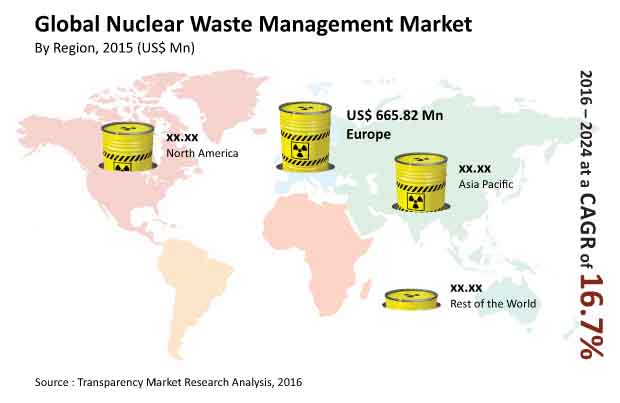
The rising awareness about the importance of hazard management in the energy sector is estimated to work as a growth accelerator for the nuclear waste management market. The expanding focus of many countries on the proper disposal of nuclear waste is fueling the market growth. Furthermore, the increasing use of nuclear energy in varied operations such as medicine, scientific research defense, and others are creating lucrative opportunities in the nuclear waste management market. According to the studies conducted by TMR, the nuclear waste management market is projected to witness a massive growth trajectory and expand at a CAGR of 16.7% during the forecast period of 2016-2024. Further, the global nuclear waste management market is also expected to rise to valuation of US$5.627.5 mn by the end of the forecast period of 2016-2024.
The stringent norms and regulations regarding emissions have created the need of using and disposing of nuclear waste through proper management. This aspect has given rise to various decommissioning projects for nuclear waste management. Furthermore, the initiatives taken by various government and regulatory bodies to reduce the carbon footprints have augmented the growth of the nuclear waste management market. The market vendors in the global nuclear waste management market are focusing on promoting awareness about the proper disposal of nuclear waste. All these factors have increased the revenue index of the vendors substantially.
The chemical processes involved during various operations in industries such as medicine, defense, and others generate a large amount of radioactive nuclear waste in the world. Further, the waste remains radioactive for a long time. Based on the nature of radioactive waste, they are classified as exempt, low, intermediate, and high-level waste. Although the energy sector is largely regulated, the issue of waste disposal persists. High-level waste is difficult to dispose of as it remains active for a longer time and is highly hazardous. Hence, to manage the waste disposal mechanism effectively, the strategies are targeted at disposal of high-level waste. As per TMR studies, the high-level waste acquired the major chunk of 35.9% of market share in the global nuclear waste management market Following these aforementioned factors, demand for nuclear waste management services is on the rise and bode well for the growth of the nuclear waste management market.
Based on regions, Europe, Asia Pacific and North America have paved their way through the nuclear waste management market. In the current scenario, Europe and Asia Pacific together have a large number of nuclear reactors which result in a large amount of nuclear waste formed due to the various processes involved. This aspect has created lucrative opportunities for the nuclear waste management market. The nuclear waste management market has gained momentum due to the rise in investments made by the key players in nuclear power projects. The Asia Pacific market is projected to witness substantial growth owing to the major investments made by countries such as China to double their nuclear capacity by the end of the forecast period of 2016-2024. However, North America is expected to exhibit a moderate growth curve.
The players in the nuclear waste management market are increasing their R&D activities to improve the quality of their services. Furthermore, companies are also focusing on the development of novel strategies that assist them in boosting their revenues. The adoption of advanced technologies and techniques is possible through these activities, which increase the convenience quotient and help in managing large quantities of nuclear waste efficiently. These factors are helping in the growth rate of the nuclear waste management market.
Mergers, acquisitions, joint ventures, and partnerships are key strategies used by companies in the nuclear waste management market. These activities are helping enterprises to expand their businesses. Therefore, these aspects are contributing to the growth structure of the nuclear waste management market. The global nuclear waste management market is operational by leading companies such as Veolia Environment Services, Bechtel Corporation, Areva SA, US Ecology, Inc., and others.
Nuclear Waste Management Market is expected to reach US$5,627.5 mn by 2024
Nuclear Waste Management Market is estimated to rise at a CAGR of 16.7% during forecast period
Increasing use of nuclear energy in varied operations such as medicine, scientific research defense, and others is expected to drive the Nuclear Waste Management Market
Europe and Asia Pacific is more attractive for vendors in the Nuclear Waste Management Market
Key players of Nuclear Waste Management Market are Veolia Environment Services, Bechtel Corporation, Areva SA, US Ecology, Inc., and others
Table of Content
(*Note: Similar segmentation will be provided for each companies mentioned below)
List of Tables
Table 1. Global Nuclear waste management Market: Snapshot
Table 2. U.S. Nuclear Waste Management, By Waste Type, By Revenue (US$ Mn) 2014–2024
Table 3. U.S. Nuclear Waste Management, By Nuclear Reactor Type, By Revenue (US$ Mn) 2014–2024
Table 4. Canada, Nuclear Waste Management, By Waste Type, By Revenue (US$ Mn) , 2014–2024
Table 5. Canada, Nuclear Waste Management, By Nuclear Reactor Type, By Revenue (US$ Mn) , 2014–2024
Table 6. Mexico, Nuclear Waste Management, By Waste Type, By Revenue (US$ Mn) , 2014–2024
Table 7. Mexico, Nuclear Waste Management, By Nuclear Reactor Type, By Revenue (US$ Mn) , 2014–2024
Table 8. France, Nuclear Waste Management, By Waste Type, By Revenue (US$ Mn) , 2014–2024
Table 9. France, Nuclear Waste Management, By Nuclear Reactor Type, By Revenue (US$ Mn) , 2014–2024
Table 10. Russia, Nuclear Waste Management, By Waste Type, By Revenue (US$ Mn) , 2014–2024
Table 11. Russia, Nuclear Waste Management, By Nuclear Reactor Type, By Revenue (US$ Mn) , 2014–2024
Table 12. Rest of Europe, Nuclear Waste Management, By Waste Type, By Revenue(US$ Mn) , 2014–2024
Table 13. Rest of Europe, Nuclear Waste Management, By Nuclear Reactor Type, By Revenue(US$ Mn) , 2014–2024
Table 14. China, Nuclear Waste Management, By Waste Type, By Revenue(US$ Mn) , 2014–2024
Table 15. China, Nuclear Waste Management, By Nuclear Reactor Type, By Revenue(US$ Mn) , 2014–2024
Table 16. Japan, Nuclear Waste Management, By Waste Type, By Revenue(US$ Mn) , 2014–2024
Table 17. Japan, Nuclear Waste Management, By Nuclear Reactor Type, By Revenue(US$ Mn) , 2014–2024
Table 18. Rest of Asia Pacific, Nuclear Waste Management, By Waste Type, By Revenue(US$ Mn) , 2014–2024
Table 19. Rest of Asia Pacific, Nuclear Waste Management, By Nuclear Reactor Type, By Revenue (US$ Mn) , 2014–2024
Table 20. Argentina, Nuclear Waste Management, By Waste Type, By Revenue (US$ Mn) , 2014–2024
Table 21. Argentina, Nuclear Waste Management, By Nuclear Reactor Type, By Revenue (US$ Mn) , 2014–2024
Table 22. South Africa, Nuclear Waste Management, By Waste Type, By Revenue (US$ Mn) , 2014–2024
Table 23. South Africa, Nuclear Waste Management, By Nuclear Reactor Type, By Revenue (US$ Mn) , 2014–2024
Table 24. Others, Nuclear Waste Management, By Waste Type, By Revenue (US$ Mn) , 2014–2024
Table 25. Others, Nuclear Waste Management, By Nuclear Reactor Type, By Revenue (US$ Mn) , 2014–2024
List of Figures
Figure 1. Global Nuclear Waste Management Market Segmentation
Figure 2. Global Nuclear Waste Management Market, Estimates and Forecast, By Revenue, 2014–2024 (US$ Mn)
Figure 3. Global Nuclear Waste Management Market, % Market Revenue, By Region, 2015
Figure 4. Global Nuclear waste management Market, Value Chain Analysis
Figure 5. Global Nuclear waste management Market, Global Energy Usage, % Share, By Fuel Type, 2014
Figure 6. Global Nuclear waste management Market, Global Carbon Emissions, By Sector, 2014
Figure 7. Market Attractiveness Analysis of Nuclear waste management Market, By Region, 2014
Figure 8. Global Nuclear waste management Market, Company Market Share (%) (2014)
Figure 9. Global Nuclear waste management Market, By Waste Type, 2015 and 2024
Figure 10. Global Nuclear Waste Management Market, Waste Type Segment, By Revenue (US$ Mn), 2014-2024
Figure 11. Global Nuclear waste management Market, Estimates and Forecast, By Low Level Waste, 2014–2024, By Revenue (US$ Mn)
Figure 12. Global Nuclear waste management Market, Estimates and Forecast, By Intermediate Level Waste, 2014–2024 , By Revenue (US$ Mn)
Figure 13. Global Nuclear waste management Market, Estimates and Forecast, By High Level Waste, 2014–2024, By Revenue (US$ Mn)
Figure 14. Global Nuclear waste management Market, By Nuclear Reactor Type, 2015 and 2024
Figure 15. Global Nuclear Waste Management Market, Nuclear Reactor Type Segment, By Revenue (US$ Mn), 2014-2024
Figure 16. Global Nuclear waste management Market, Estimates and Forecast, By Boiling Water Reactors, 2014–2024, By Revenue (US$ Mn)
Figure 17. Global Nuclear waste management Market, Estimates and Forecast, By Gas Cooled Reactors, 2014–2024, By Revenue (US$ Mn)
Figure 18. Global Nuclear waste management Market, Estimates and Forecast, By Pressurized Water Reactors, 2014–2024, By Revenue (US$ Mn)
Figure 19. Global Nuclear waste management Market, Estimates and Forecast, By Pressurized Heavy Water Reactors, 2014–2024, By Revenue (US$ Mn)
Figure 20. Global Nuclear waste management Market, Estimates and Forecast, By Others, 2014–2024, By Revenue (US$ Mn)
Figure 21. Global Nuclear waste management Market Share, by Region, 2015 and 2024
Figure 22. North America Nuclear waste management Market Share, by Country, 2015 and 2024
Figure 23. North America Nuclear Waste Management, By Waste Type, By Revenue (US$ Mn), 2014-2024
Figure 24. North America Nuclear Waste Management, By Nuclear Reactor Type, By Revenue (US$ Mn), 2014-2024
Figure 25. Europe Nuclear waste management Market Share, by Country, 2015 and 2024
Figure 26. Europe Nuclear Waste Management, By Waste Type, By Revenue (US$ Mn), 2014-2024
Figure 27. Europe Nuclear Waste Management, By Nuclear Reactor Type, By Revenue (US$ Mn), 2014-2024
Figure 28. Asia Pacific Nuclear waste management Share, by Country, 2015 and 2024
Figure 29. Asia Pacific Nuclear Waste Management, By Waste Type, By Revenue (US$ Mn), 2014-2024
Figure 30. Asia Pacific Nuclear Waste Management, By Nuclear Reactor Type, By Revenue (US$ Mn), 2014-2024
Figure 31. Rest of the World Nuclear waste management Share, by Country, 2015 and 2024
Figure 32. Rest of the World Nuclear waste management, By Waste Type, By Revenue (US$ Mn), 2014-2024
Figure 33. Rest of the World Nuclear Waste Management, By Nuclear Reactor Type, By Revenue (US$ Mn), 2014-2024
Figure 34. Areva SA, Revenue By Business Segment, 2012-2014
Figure 35. Areva SA, Revenue by Region, 2014
Figure 36. Augean PLC, Revenue By Business Segment, 2014
Figure 37. Bechtel Corporation, By Revenue, 2012-2014
Figure 38. Perma-Fix Environmental Services, Inc., Revenue By Business Segment, 2014
Figure 39. US Ecology, Inc., Revenue By Business Segment, 2014
Figure 40. US Ecology, Inc., Sales By Treatment and Disposal, 2012-2014
Figure 41. Veolia Environmental Services, Revenue By Business Segment, 2014
Figure 42. Veolia Environmental Services, Revenue By Region, 2014
Copyright © Transparency Market Research, Inc. All Rights reserved
Trust Online

Nuclear Waste Management Market Trends, 2016-2024