
Reports
Reports
Natural polymers are the polymeric derivatives of plants and animals sources. They include copolymers which contain synthetic compounds, namely starch and fermentation products, cellulose ethers, vegetable gums, protein based polymers, and marine polymers. The demand for natural polymers in the U.S. has been increasing at a healthy CAGR due to increased consumption expenditure, construction activity, and nondurable goods shipments. The increase in demand for natural polymers in the medical industry has been driven by growing applications in osteoarthritis and pharmaceuticals treatments. Natural polymers outperform their synthetic counterpart in terms of environmental footprints. However, they significantly lack behind them in terms of cost, availability of raw materials, product inconsistence and supply uncertainties.
The U.S. natural polymer market has been mainly driven by the increase in demand for non petroleum based and eco-friendly products. Natural polymers have been gaining popularity due to their growing demand in pharmaceutical applications such as excipients, binders and fillers in directly compressed drugs, wound dressing, treatment of arthritic-afflicted joints, etc. The demand for natural polymers in the U.S. has been increasing at a healthy CAGR due to increased consumption expenditure, construction activity and shipments of nondurable goods. The increase in demand for natural polymers in the medical industry has been driven by growing applications in osteoarthritis and pharmaceutical treatments. Natural polymers outperform their synthetic counterpart in terms of environmental footprints. However, they significantly lag behind them in terms of cost, availability of raw materials, product inconsistence and supply uncertainties.
With over 37% share of the total natural polymer consumption in the U.S. in 2012, cellulose ether was the most widely consumed natural polymer in the U.S. market due to high demand from the pharmaceutical, toiletries, cosmetics, construction, and food and beverage industries. Methyl cellulose led the cellulose ether polymers segment, while starch and fermentation products accounted for the second largest market segment in 2012. Further, this segment is expected to exhibit the fastest growth in terms of both volume and revenue due to rapidly growing demand from the packaging industry.
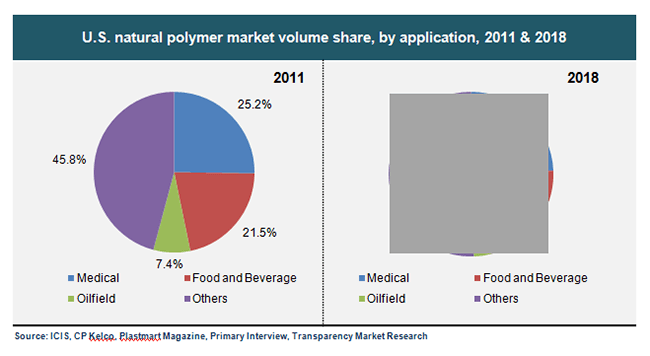
The U.S. natural polymer market revenue was USD 4,646.0 million in 2011 and growth at a CAGR of 6.2% is expected from 2012 to 2018. Medical, oilfield, food & beverages and others including packaging, cosmetics and toiletries, adhesives, construction, paint and inks, and textiles and leather tanning are the major applications of natural polymers. In 2011, medical accounted for 25.3% of the total natural polymer application in U.S. The spur in the demand is due to the rise in the pharmaceutical application and osteoarthritis treatments. Food & beverage is the second largest segment which accounted for 21.5% of the total natural polymer application market share and it is expected to decrease to 18.2% based on mature applications.
However, stringent environmental regulations imposed by governments, and growing awareness about deforestation and protection of animals are acting as barriers in the growth of the natural polymer industry. Moreover, easy availability of substitute products like synthetic polymer is also anticipated to arrest the growth of this market.
The market for natural polymer is fragmented as the top four companies contribute less than fifty percent of the total market share. The market is significantly integrated through raw material, polymer manufacturing and application development of these polymers. The market is highly price sensitive and experience frequent price wars in order to gain competitive advantage. Key market participants include Ashland Inc., Dow Chemical, Economy Polymers & Chemicals, JM Huber, Novamont, Archer-Daniels-Midland (ADM), Plantic Technologies, Cargill Inc. an others.
1. Preface
1.1. Report description
1.2. Research scope
1.3. Research methodology
2. Executive Summary
2.1. U.S. natural polymer market, 2010-2018 (Kilo Tons) (USD Million)
2.2. U.S. natural polymer market snapshot
3. Market Overview
3.1. Introduction
3.2. Value chain analysis
3.2.1. Value chain analysis of U.S. natural polymer market
3.3. Market Drivers
3.4. 3.3.1.Rising demand for non durable foods and shipments
3.4.1.1. U.S. non durable foods and shipments, 2010-2018 (USD Million)
3.4.2. Rising food and beverage shipment revenue
3.4.2.1. U.S. food and beverage shipment market, 2010-2018 (USD Million)
3.4.3. Rising U.S. pharmaceutical shipments revenue
3.4.3.1. U.S. pharmaceutical shipment market, 2010-2018 (USD Million)
3.4.4. Rising U.S. construction expenditure revenue
3.4.4.1. U.S. construction market, 2010-2018 (USD Million)
3.5. Restraints
3.5.1. Regulatory and Environmental issues
3.5.2. Price Instability
3.6. Opportunities
3.6.1. Development of technology and product
3.6.2. Growth in U.S. market
3.6.3. Rising demand of natural polymers in medical market
3.7. Porter’s five forces analysis
3.7.1. Bargaining power of suppliers
3.7.2. Bargaining power of buyers
3.7.3. Threat of new entrants
3.7.4. Threat of Substitutes
3.7.5. Degree of competition
3.8. Market attractiveness analysis
3.8.1. U.S. natural polymer market attractiveness, by type, 2011
3.9. Company market share analysis
3.9.1. U.S. natural polymermarket share, by company, 2012
4. Natural Polymer Market by Type
4.1. U.S. natural polymer market overview: by type
4.1.1. U.S. natural polymer market volumes share, by type, 2011 & 2018
4.2. Cellulose Ether
4.2.1. Natural polymer market for cellulose ether, volumes and revenues, 2010-2018 (Kilo Tons) (USD Million)
4.3. Starch and Fermentation Products
4.3.1. Natural Polymer market for starch and fermentation products, volumes and revenues, 2010-2018 (Kilo Tons) (USD Million)
4.4. Protein Based Polymer
4.4.1. Natural Polymer market for protein based polymers, volumes and revenues, 2010-2018 (Kilo Tons) (USD Million)
4.5. Other Polymer Products
4.5.1. Natural Polymer market for other natural polymer products, volumes and revenues, 2010-2018 (Kilo Tons) (USD Million)
5. Natural Polymer Market by Application
5.1. U.S. natural polymer market overview: by application
5.1.1. U.S. natural polymer market volumes share, by application, 2011 & 2018
5.2. Medical Segment
5.2.1. Natural polymer market for medical application, volumes and revenues, 2010-2018 (Kilo Tons) (USD Million)
5.3. Food and Beverage
5.3.1. Natural polymer market for food and beverage, volumes and revenues, 2010-2018 (Kilo Tons) (USD Million)
5.4. Oilfields
5.4.1. Natural polymer market for oilfields, volumes and revenues, 2010-2018 (Kilo Tons) (USD Million)
5.5. Other Markets
5.5.1. Natural polymer market for other markets, volumes and revenues, 2010-2018 (Kilo Tons) (USD Million)
6. Company Profiles
6.1. Cargill
6.1.1. Company overview
6.1.2. Financial overview
6.1.3. Business strategies
6.1.4. SWOT analysis
6.1.5. Recent developments
6.2. FMC Corporation
6.2.1. Company overview
6.2.2. Business strategies
6.2.3. SWOT analysis
6.3. Danisco
6.3.1. Company overview
6.3.2. Financial overview
6.3.3. Business strategies
6.3.4. SWOT analysis
6.3.5. Recent developments
6.4. CP Kelco
6.4.1. Company overview
6.4.2. Financial overview
6.4.3. Business strategies
6.4.4. SWOT analysis
6.4.5. Recent developments
6.5. Cereplast
6.5.1. Company overview
6.5.2. Financial overview
6.5.3. SWOT analysis
6.5.4. Business strategies
6.5.5. Recent developments
6.6. Allergan
6.6.1. Company overview
6.6.2. Financial overview
6.6.3. SWOT analysis
6.6.4. Business strategies
6.6.5. Recent developments
6.7. BASF SE
6.7.1. Company overview
6.7.2. Financial overview
6.7.3. SWOT analysis
6.7.4. Business strategy
6.7.5. Recent developments
6.8. Croda International Plc
6.8.1. Company overview
6.8.2. Financial overview
6.8.3. Business strategies
6.8.4. SWOT analysis
6.8.5. Recent developments
6.9. AkzoNobel
6.9.1. Company overview
6.9.2. Financial overview
6.9.3. Business strategies
6.9.4. SWOT Analysis
6.9.5. Recent developments
6.10. Dow Chemical Company
6.10.1. Company overview
6.10.2. Business strategies
6.10.3. SWOT Analysis
6.10.4. Recent Developments
6.11. Ashland
6.11.1. Company overview
6.11.2. Financial overview
6.11.3. SWOT analysis
6.11.4. Business strategies
6.11.5. Recent developments
List of Tables
TABLE 1: U.S. market snapshot
TABLE 2: Major Applications: Natural Polymer Market
TABLE 3: Drivers for natural polymer market: Impact analysis
TABLE 4: Restraints of natural polymer market: Impact analysis
List of Figures
FIG. 1: U.S. natural polymer market, 2010-2018 (Kilo Tons) (USD Million)
FIG. 2: Value chain analysis of U.S. natural polymer market
FIG. 3: US Nondurable Goods Shipments Revenue, 2010-2018 (USD Million)
FIG. 4: US Food and Beverages Shipment Revenues, 2010-2018 (USD Million)
FIG. 5: US Pharmaceutical Shipments Revenue, 2010-2018(USD Million)
FIG. 6: US Construction Expenditure Revenue, 2010-2018 (USD Million)
FIG. 7: Natural Polymer price trend estimate and forecast, 2009-2018 (USD/KG
FIG. 8: Porter’s five forces analysis
FIG. 9: Natural Polymer: market attractiveness analysis, by type, 2011
FIG. 10: U.S. natural polymer market share, by company, 2012
FIG. 11: U.S. natural polymer market volumes share, by Application, 2011 & 2018
FIG. 12: U.S. natural polymer market for medical application, 2010-2018 (Kilo Tons) (USD Million
FIG. 13: UnitedStatesnatural polymer market for food and beverage, 2010-2018 (Kilo Tons) (USD Million)
FIG. 14: UnitedStates natural polymer market for oilfields, 2010-2018 (Kilo Tons) (USD Million)
FIG. 15: UnitedStates natural polymer market for other segment, 2010-2018 (Kilo Tons) (USD Million)
FIG. 16: U.S. natural polymer market volumes share, by type, 2011 & 2018
FIG. 17: U.S. natural polymer market for cellulose ether, 2010-2018 (Kilo Tons) (USD Million)
FIG. 18: U.S. natural polymer market for starch and fermentation products, 2010-2018 (Kilo Tons) (USD Million)
FIG. 19: U.S. natural polymer market for protein based polymers, 2010-2018 (Kilo Tons) (USD Million)
FIG. 20: U.S. natural polymer market for other natural polymer products, 2010-2018 (Kilo Tons) (USD Million)
Copyright © Transparency Market Research, Inc. All Rights reserved
Trust Online

Natural Polymers Market