
Reports
Reports
Global Mobile Mapping Market: Snapshot
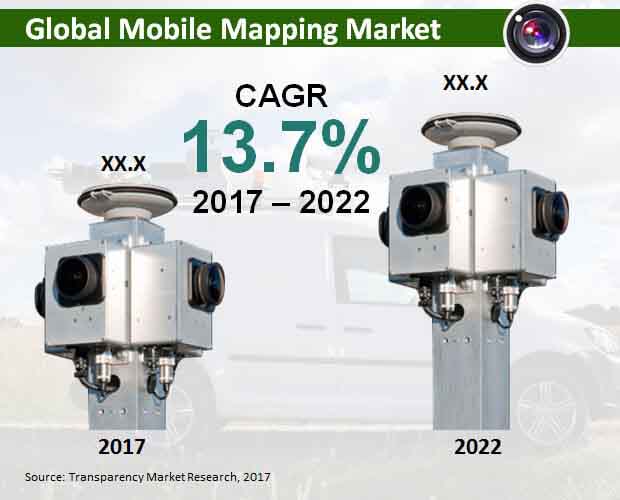
The global mobile mapping market has exhibited steady growth in the last few years on the back of steady development of numerous end user industries. Rapid development of satellite mapping technology and its smooth integration into mobile phone design has also aided growth of the global mobile mapping market significantly. The global mobile mapping market is expected to exhibit a strong 13.7% CAGR over the 2017-2022 forecast period, according to Transparency Market Research. The mobile mapping market’s strong growth prospects are backed by rising use of advanced smartphones across the world and rising use of mobile mapping capabilities by app developers to enable app users to make the most of the app’s functionality. The global mobile mapping market is thus likely to exhibit a steady growth trajectory over the 2017-2022 forecast period.
According to Transparency Market Research, the global mobile mapping market is likely to reach a valuation of US$12.9 bn by the end of 2017 and further rise to US$24.4 bn by the end of 2022.
Location based Services to Dominate Global Mobile Mapping Market
The global mobile mapping market is segmented by solution into location based services, indoor mapping, 3D mapping, support services, and other solutions. Of these, location based services are likely to dominate the global mobile mapping market over the 2017-2022 forecast period, exhibiting a strong 16.2% CAGR therein. The market for location based services has grown rapidly over recent years due to rapid development of mobile mapping applications in smartphones and is likely to remain the dominant contributor to the global mobile mapping market over the coming years. The location based services segment accounted for 37.2% of the global mobile mapping market in 2017, with a valuation of US$4.8 bn. By the end of the 2017-2022 forecast period, location based services are likely to account for 41.5% of the global mobile mapping market, with a valuation of US$10.1 bn.
North America to Remain Most Attractive Regional Market for Mobile Mapping
Geographically, North America is likely to remain the dominant market for mobile mapping in the coming years due to a number of factors. Widespread use of advanced smartphones and rapid uptake of mobile mapping technology by app developers in the region has helped drive the mobile mapping market in North America and is likely to remain a crucial driver for the market in the coming years. The North America mobile mapping market accounted for a valuation of US$3.6 bn in 2017 and is expected to rise to a valuation of US$7.9 bn by the end of 2022.
Japan Likely to Account for More in Global Mobile Mapping Market than APEJ
The Japan mobile mapping market is likely to remain a crucial contributor for global mobile mapping market players in the coming years, as the region is expected to account for a solid 16.4% revenue share in the global mobile mapping market by the end of 2022. The Japan mobile mapping market is expected to gain 46 BPS over the 2017-2022 forecast period, in stark contrast to the Asia Pacific except Japan market, which is likely drop 20 BPS over the forecast period to end up with a revenue share of 14.5% in the global mobile mapping market.
Global Mobile Mapping Market: Competitive Dynamics
The report profiles leading companies in the global mobile mapping market to shed light on the dynamics of the market. Key companies in the global mobile mapping market include Google Inc., Apple Inc., Microsoft Corporation, Tomtom NV, Mitsubishi Electric Corporation, Garmin International, Telefonaktiebolaget LM Ericsson, OSI Geospatial Inc., Qualcomm Inc., and Leica Geosystems Inc.
Location-based Services Act as Key Consumer Proposition for Driving Sales in Mobile Mapping Market
Mobile mapping are viewed as a geospatial technology with a transformative potential in helping users understand their ambient environments. 3D mobile mapping in particular are used in visualising, recording, and measuring environments, notably those that were hard to do before such as underground environments. Advent of a slew of mobile transportation platforms have bolstered the use cases of mobile mapping, thereby, boosting the prospects in the mobile mapping market. The growing demand for mobile mapping in conjunction with other surveillance systems to monitor power infrastructure and plants is one of the key application areas. Engineers and research fraternity are keen on developing high-end software to support next-gen visualization platforms based on 3D mobile mapping features. Rise in utilization of mobile mapping in oil and gas industry is expected to expand the application areas in the market. Of the various key application areas, location-based services are likely to accumulate high revenues for players in mobile mapping market in the next few years. Currently, mobile GIS based applications are commonly used in the traffic management and fleet tracking. There is a growing interest for developing mobile mapping applications for improving healthcare services in parts of the developing world, such as in Asia Pacific.
The COVID-19 pandemic is not just a health pandemic but has been emerging as macroeconomic jolt of unimaginable scale. The pandemic spurred investments in digital technologies and several businesses across industries made swift adoption. Mobile mapping technologies for location-based services saw a new avenue in their use in improving access to critical care services in the wake of surge in demand for emergency services. Growing business prospect of mobile mapping technologies for smart devices to boost food service industry outcomes is a key trend. On the other hand, manufacturers and vendors in the mobile mapping market are recently toying with the idea of multiple price points for different geographies.
1. Global Mobile Mapping Market - Executive Summary
2. Global Mobile Mapping Market Overview
2.1. Introduction
2.1.1. Global Mobile Mapping Market Taxonomy
2.1.2. Global Mobile Mapping Market Definition
2.2. Global Mobile Mapping Market Size (US$ Mn) and Forecast, 2012-2022
2.2.1. Global Mobile Mapping Market Y-o-Y Growth
2.3. Global Mobile Mapping Market Dynamics
2.4. Value Chain
2.5. Key Contracts
2.6. Regional Trends
2.7. Software providers List
2.8. Competitive landscape
2.9. Key Participants Market Presence (Intensity Map) By Region
3. Global Mobile Mapping Market Analysis and Forecast By Solution
3.1. Global Mobile Mapping Market Size and Forecast By Solution, 2012-2022
3.1.1. Location based Service Market Size and Forecast, 2012-2022
3.1.1.1. Revenue (US$ Mn) Comparison, By Region
3.1.1.2. Market Share Comparison, By Region
3.1.1.3. Y-o-Y growth Comparison, By Region
3.1.2. Indoor mapping Market Size and Forecast, 2012-2022
3.1.2.1. Revenue (US$ Mn) Comparison, By Region
3.1.2.2. Market Share Comparison, By Region
3.1.2.3. Y-o-Y growth Comparison, By Region
3.1.3. 3D Mapping Market Size and Forecast, 2012-2022
3.1.3.1. Revenue (US$ Mn) Comparison, By Region
3.1.3.2. Market Share Comparison, By Region
3.1.3.3. Y-o-Y growth Comparison, By Region
3.1.4. Support Services Market Size and Forecast, 2012-2022
3.1.4.1. Revenue (US$ Mn) Comparison, By Region
3.1.4.2. Market Share Comparison, By Region
3.1.4.3. Y-o-Y growth Comparison, By Region
3.1.5. Other solution Market Size and Forecast, 2012-2022
3.1.5.1. Revenue (US$ Mn) Comparison, By Region
3.1.5.2. Market Share Comparison, By Region
3.1.5.3. Y-o-Y growth Comparison, By Region
4. Global Mobile Mapping Market Analysis and Forecast By End-User
4.1. Global Mobile Mapping Market Size and Forecast By End-User, 2012-2022
4.1.1. Commercial Market Size and Forecast, 2012-2022
4.1.1.1. Revenue (US$ Mn) Comparison, By Region
4.1.1.2. Market Share Comparison, By Region
4.1.1.3. Y-o-Y growth Comparison, By Region
4.1.2. Individual Market Size and Forecast, 2012-2022
4.1.2.1. Revenue (US$ Mn) Comparison, By Region
4.1.2.2. Market Share Comparison, By Region
4.1.2.3. Y-o-Y growth Comparison, By Region
5. Global Mobile Mapping Market Analysis and Forecast By Industry
5.1. Global Mobile Mapping Market Size and Forecast By Industry, 2012-2022
5.1.1. BFSI Market Size and Forecast, 2012-2022
5.1.1.1. Revenue (US$ Mn) Comparison, By Region
5.1.1.2. Market Share Comparison, By Region
5.1.1.3. Y-o-Y growth Comparison, By Region
5.1.2. Travel & Hospitality Market Size and Forecast, 2012-2022
5.1.2.1. Revenue (US$ Mn) Comparison, By Region
5.1.2.2. Market Share Comparison, By Region
5.1.2.3. Y-o-Y growth Comparison, By Region
5.1.3. Energy & Utility Market Size and Forecast, 2012-2022
5.1.3.1. Revenue (US$ Mn) Comparison, By Region
5.1.3.2. Market Share Comparison, By Region
5.1.3.3. Y-o-Y growth Comparison, By Region
5.1.4. Oil & Gas Market Size and Forecast, 2012-2022
5.1.4.1. Revenue (US$ Mn) Comparison, By Region
5.1.4.2. Market Share Comparison, By Region
5.1.4.3. Y-o-Y growth Comparison, By Region
5.1.5. Healthcare Market Size and Forecast, 2012-2022
5.1.5.1. Revenue (US$ Mn) Comparison, By Region
5.1.5.2. Market Share Comparison, By Region
5.1.5.3. Y-o-Y growth Comparison, By Region
5.1.6. Telecommunication Market Size and Forecast, 2012-2022
5.1.6.1. Revenue (US$ Mn) Comparison, By Region
5.1.6.2. Market Share Comparison, By Region
5.1.6.3. Y-o-Y growth Comparison, By Region
5.1.7. Government Market Size and Forecast, 2012-2022
5.1.7.1. Revenue (US$ Mn) Comparison, By Region
5.1.7.2. Market Share Comparison, By Region
5.1.7.3. Y-o-Y growth Comparison, By Region
5.1.8. Others Market Size and Forecast, 2012-2022
5.1.8.1. Revenue (US$ Mn) Comparison, By Region
5.1.8.2. Market Share Comparison, By Region
5.1.8.3. Y-o-Y growth Comparison, By Region
6. Global Mobile Mapping Market Analysis and Forecast By Region
6.1. Global Mobile Mapping Market Size and Forecast, 2012-2022
6.1.1. North America Mobile Mapping Market Size and Forecast, 2012-2022
6.1.1.1. Revenue (US$ Mn) Comparison, By Solution
6.1.1.2. Revenue (US$ Mn) Comparison, By End-User
6.1.1.3. Revenue (US$ Mn) Comparison, By Industry
6.1.2. Latin America Mobile Mapping Market Size and Forecast, 2012-2022
6.1.2.1. Revenue (US$ Mn) Comparison, By Solution
6.1.2.2. Revenue (US$ Mn) Comparison, By End-User
6.1.2.3. Revenue (US$ Mn) Comparison, By Industry
6.1.3. Europe Mobile Mapping Market Size and Forecast, 2012-2022
6.1.3.1. Revenue (US$ Mn) Comparison, By Solution
6.1.3.2. Revenue (US$ Mn) Comparison, By End-User
6.1.3.3. Revenue (US$ Mn) Comparison, By Industry
6.1.4. Japan Mobile Mapping Market Size and Forecast, 2012-2022
6.1.4.1. Revenue (US$ Mn) Comparison, By Solution
6.1.4.2. Revenue (US$ Mn) Comparison, By End-User
6.1.4.3. Revenue (US$ Mn) Comparison, By Industry
6.1.5. APEJ Mobile Mapping Market Size and Forecast, 2012-2022
6.1.5.1. Revenue (US$ Mn) Comparison, By Solution
6.1.5.2. Revenue (US$ Mn) Comparison, By End-User
6.1.5.3. Revenue (US$ Mn) Comparison, By Industry
6.1.6. MEA Mobile Mapping Market Size and Forecast, 2012-2022
6.1.6.1. Revenue (US$ Mn) Comparison, By Solution
6.1.6.2. Revenue (US$ Mn) Comparison, By End-User
6.1.6.3. Revenue (US$ Mn) Comparison, By Industry
7. North America Mobile Mapping Market Analysis and Forecast, By Country, 2012-2022
7.1. US Mobile Mapping Market Size and Forecast, 2012-2022
7.1.1. Revenue (US$ Mn) Comparison, By Solution
7.1.2. Revenue (US$ Mn) Comparison, By End-User
7.1.3. Revenue (US$ Mn) Comparison, By Industry
7.2. Canada Mobile Mapping Market Size and Forecast, 2012-2022
7.2.1. Revenue (US$ Mn) Comparison, By Solution
7.2.2. Revenue (US$ Mn) Comparison, By End-User
7.2.3. Revenue (US$ Mn) Comparison, By Industry
8. Latin America Mobile Mapping Market Analysis and Forecast, By Country, 2012-2022
8.1. Brazil Mobile Mapping Market Size and Forecast, 2012-2022
8.1.1. Revenue (US$ Mn) Comparison, By Solution
8.1.2. Revenue (US$ Mn) Comparison, By End-User
8.1.3. Revenue (US$ Mn) Comparison, By Industry
8.2. Mexico Mobile Mapping Market Size and Forecast, 2012-2022
8.2.1. Revenue (US$ Mn) Comparison, By Solution
8.2.2. Revenue (US$ Mn) Comparison, By End-User
8.2.3. Revenue (US$ Mn) Comparison, By Industry
8.3. Argentina Mobile Mapping Market Size and Forecast, 2012-2022
8.3.1. Revenue (US$ Mn) Comparison, By Solution
8.3.2. Revenue (US$ Mn) Comparison, By End-User
8.3.3. Revenue (US$ Mn) Comparison, By Industry
9. Europe Mobile Mapping Market Analysis and Forecast, By Country, 2012-2022
9.1. Germany Mobile Mapping Market Size and Forecast, 2012-2022
9.1.1. Revenue (US$ Mn) Comparison, By Solution
9.1.2. Revenue (US$ Mn) Comparison, By End-User
9.1.3. Revenue (US$ Mn) Comparison, By Industry
9.2. UK Mobile Mapping Market Size and Forecast, 2012-2022
9.2.1. Revenue (US$ Mn) Comparison, By Solution
9.2.2. Revenue (US$ Mn) Comparison, By End-User
9.2.3. Revenue (US$ Mn) Comparison, By Industry
9.3. France Mobile Mapping Market Size and Forecast, 2012-2022
9.3.1. Revenue (US$ Mn) Comparison, By Solution
9.3.2. Revenue (US$ Mn) Comparison, By End-User
9.3.3. Revenue (US$ Mn) Comparison, By Industry
9.4. Spain Mobile Mapping Market Size and Forecast, 2012-2022
9.4.1. Revenue (US$ Mn) Comparison, By Solution
9.4.2. Revenue (US$ Mn) Comparison, By End-User
9.4.3. Revenue (US$ Mn) Comparison, By Industry
9.5. Italy Mobile Mapping Market Size and Forecast, 2012-2022
9.5.1. Revenue (US$ Mn) Comparison, By Solution
9.5.2. Revenue (US$ Mn) Comparison, By End-User
9.5.3. Revenue (US$ Mn) Comparison, By Industry
9.6. Nordic Mobile Mapping Market Size and Forecast, 2012-2022
9.6.1. Revenue (US$ Mn) Comparison, By Solution
9.6.2. Revenue (US$ Mn) Comparison, By End-User
9.6.3. Revenue (US$ Mn) Comparison, By Industry
10. Japan Mobile Mapping Market Analysis and Forecast, By Country, 2012-2022
10.1. Japan Mobile Mapping Market Size and Forecast, 2012-2022
10.1.1. Revenue (US$ Mn) Comparison, By Solution
10.1.2. Revenue (US$ Mn) Comparison, By End-User
10.1.3. Revenue (US$ Mn) Comparison, By Industry
11. APEJ Mobile Mapping Market Analysis and Forecast, By Country, 2012-2022
11.1. China Mobile Mapping Market Size and Forecast, 2012-2022
11.1.1. Revenue (US$ Mn) Comparison, By Solution
11.1.2. Revenue (US$ Mn) Comparison, By End-User
11.1.3. Revenue (US$ Mn) Comparison, By Industry
11.2. India Mobile Mapping Market Size and Forecast, 2012-2022
11.2.1. Revenue (US$ Mn) Comparison, By Solution
11.2.2. Revenue (US$ Mn) Comparison, By End-User
11.2.3. Revenue (US$ Mn) Comparison, By Industry
11.3. Malaysia Mobile Mapping Market Size and Forecast, 2012-2022
11.3.1. Revenue (US$ Mn) Comparison, By Solution
11.3.2. Revenue (US$ Mn) Comparison, By End-User
11.3.3. Revenue (US$ Mn) Comparison, By Industry
11.4. Thailand Mobile Mapping Market Size and Forecast, 2012-2022
11.4.1. Revenue (US$ Mn) Comparison, By Solution
11.4.2. Revenue (US$ Mn) Comparison, By End-User
11.4.3. Revenue (US$ Mn) Comparison, By Industry
11.5. Singapore Mobile Mapping Market Size and Forecast, 2012-2022
11.5.1. Revenue (US$ Mn) Comparison, By Solution
11.5.2. Revenue (US$ Mn) Comparison, By End-User
11.5.3. Revenue (US$ Mn) Comparison, By Industry
11.6. Australia Mobile Mapping Market Size and Forecast, 2012-2022
11.6.1. Revenue (US$ Mn) Comparison, By Solution
11.6.2. Revenue (US$ Mn) Comparison, By End-User
11.6.3. Revenue (US$ Mn) Comparison, By Industry
12. MEA Mobile Mapping Market Analysis and Forecast, By Country, 2012-2022
12.1. GCC Countries Mobile Mapping Market Size and Forecast, 2012-2022
12.1.1. Revenue (US$ Mn) Comparison, By Solution
12.1.2. Revenue (US$ Mn) Comparison, By End-User
12.1.3. Revenue (US$ Mn) Comparison, By Industry
12.2. South Africa Mobile Mapping Market Size and Forecast, 2012-2022
12.2.1. Revenue (US$ Mn) Comparison, By Solution
12.2.2. Revenue (US$ Mn) Comparison, By End-User
12.2.3. Revenue (US$ Mn) Comparison, By Industry
12.3. Nigeria Mobile Mapping Market Size and Forecast, 2012-2022
12.3.1. Revenue (US$ Mn) Comparison, By Solution
12.3.2. Revenue (US$ Mn) Comparison, By End-User
12.3.3. Revenue (US$ Mn) Comparison, By Industry
12.4. Israel Mobile Mapping Market Size and Forecast, 2012-2022
12.4.1. Revenue (US$ Mn) Comparison, By Solution
12.4.2. Revenue (US$ Mn) Comparison, By End-User
12.4.3. Revenue (US$ Mn) Comparison, By Industry
13. Global Mobile Mapping Market Company Share, Competition Landscape and Company Profiles
13.1. Company Share Analysis
13.2. Competition Landscape
13.3. Company Profiles
13.3.1. Google, Inc.
13.3.2. Apple, Inc.
13.3.3. Microsoft Corporation
13.3.4. Tomtom NV
13.3.5. Mitsubishi Electric Corporation
13.3.6. Garmin International
13.3.7. Telefonaktiebolaget LM Ericsson (publ)
13.3.8. OSI Geospatial Inc.
13.3.9. Qualcomm Inc.
13.3.10. Leica Geosystems, Inc.
14. Research Methodology
15. Secondary and Primary Sources
16. Assumptions and Acronyms
17. Disclaimer
List of Tables
TABLE 1 Global Mobile Mapping Market Value (US$ Mn), 2012-2016
TABLE 2 Global Mobile Mapping Market Value (US$ Mn), 2017-2022
TABLE 3 Global Mobile Mapping Market Value (US$ Mn) and Y-o-Y, 2015-2022
TABLE 4 Global Location based Service Segment Value (US$ Mn), By Region 2012-2016
TABLE 5 Global Location based Service Segment Value (US$ Mn), By Region 2017-2022
TABLE 6 Global Location based Service Segment Market Share, By Region 2012-2016
TABLE 7 Global Location based Service Segment Market Share, By Region 2017-2022
TABLE 8 Global Location based Service Segment Y-o-Y, By Region 2015-2022
TABLE 9 Global Indoor mapping Segment Value (US$ Mn), By Region 2012-2016
TABLE 10 Global Indoor mapping Segment Value (US$ Mn), By Region 2017-2022
TABLE 11 Global Indoor mapping Segment Market Share, By Region 2012-2016
TABLE 12 Global Indoor mapping Segment Market Share, By Region 2017-2022
TABLE 13 Global Indoor mapping Segment Y-o-Y, By Region 2015-2022
TABLE 14 Global 3D Mapping Segment Value (US$ Mn), By Region 2012-2016
TABLE 15 Global 3D Mapping Segment Value (US$ Mn), By Region 2017-2022
TABLE 16 Global 3D Mapping Segment Market Share, By Region 2012-2016
TABLE 17 Global 3D Mapping Segment Market Share, By Region 2017-2022
TABLE 18 Global 3D Mapping Segment Y-o-Y, By Region 2015-2022
TABLE 19 Global Support Services Segment Value (US$ Mn), By Region 2012-2016
TABLE 20 Global Support Services Segment Value (US$ Mn), By Region 2017-2022
TABLE 21 Global Support Services Segment Market Share, By Region 2012-2016
TABLE 22 Global Support Services Segment Market Share, By Region 2017-2022
TABLE 23 Global Support Services Segment Y-o-Y, By Region 2015-2022
TABLE 24 Global Other solution Segment Value (US$ Mn), By Region 2012-2016
TABLE 25 Global Other solution Segment Value (US$ Mn), By Region 2017-2022
TABLE 26 Global Other solution Segment Market Share, By Region 2012-2016
TABLE 27 Global Other solution Segment Market Share, By Region 2017-2022
TABLE 28 Global Other solution Segment Y-o-Y, By Region 2015-2022
TABLE 29 Global Commercial Segment Value (US$ Mn), By Region 2012-2016
TABLE 30 Global Commercial Segment Value (US$ Mn), By Region 2017-2022
TABLE 31 Global Commercial Segment Market Share, By Region 2012-2016
TABLE 32 Global Commercial Segment Market Share, By Region 2017-2022
TABLE 33 Global Commercial Segment Y-o-Y, By Region 2015-2022
TABLE 34 Global Individual Segment Value (US$ Mn), By Region 2012-2016
TABLE 35 Global Individual Segment Value (US$ Mn), By Region 2017-2022
TABLE 36 Global Individual Segment Market Share, By Region 2012-2016
TABLE 37 Global Individual Segment Market Share, By Region 2017-2022
TABLE 38 Global Individual Segment Y-o-Y, By Region 2015-2022
TABLE 39 Global BFSI Segment Value (US$ Mn), By Region 2012-2016
TABLE 40 Global BFSI Segment Value (US$ Mn), By Region 2017-2022
TABLE 41 Global BFSI Segment Market Share, By Region 2012-2016
TABLE 42 Global BFSI Segment Market Share, By Region 2017-2022
TABLE 43 Global BFSI Segment Y-o-Y, By Region 2015-2022
TABLE 44 Global Travel & Hospitality Segment Value (US$ Mn), By Region 2012-2016
TABLE 45 Global Travel & Hospitality Segment Value (US$ Mn), By Region 2017-2022
TABLE 46 Global Travel & Hospitality Segment Market Share, By Region 2012-2016
TABLE 47 Global Travel & Hospitality Segment Market Share, By Region 2017-2022
TABLE 48 Global Travel & Hospitality Segment Y-o-Y, By Region 2015-2022
TABLE 49 Global Energy & Utility Segment Value (US$ Mn), By Region 2012-2016
TABLE 50 Global Energy & Utility Segment Value (US$ Mn), By Region 2017-2022
TABLE 51 Global Energy & Utility Segment Market Share, By Region 2012-2016
TABLE 52 Global Energy & Utility Segment Market Share, By Region 2017-2022
TABLE 53 Global Energy & Utility Segment Y-o-Y, By Region 2015-2022
TABLE 54 Global Oil & Gas Segment Value (US$ Mn), By Region 2012-2016
TABLE 55 Global Oil & Gas Segment Value (US$ Mn), By Region 2017-2022
TABLE 56 Global Oil & Gas Segment Market Share, By Region 2012-2016
TABLE 57 Global Oil & Gas Segment Market Share, By Region 2017-2022
TABLE 58 Global Oil & Gas Segment Y-o-Y, By Region 2015-2022
TABLE 59 Global Healthcare Segment Value (US$ Mn), By Region 2012-2016
TABLE 60 Global Healthcare Segment Value (US$ Mn), By Region 2017-2022
TABLE 61 Global Healthcare Segment Market Share, By Region 2012-2016
TABLE 62 Global Healthcare Segment Market Share, By Region 2017-2022
TABLE 63 Global Healthcare Segment Y-o-Y, By Region 2015-2022
TABLE 64 Global Telecommunication Segment Value (US$ Mn), By Region 2012-2016
TABLE 65 Global Telecommunication Segment Value (US$ Mn), By Region 2017-2022
TABLE 66 Global Telecommunication Segment Market Share, By Region 2012-2016
TABLE 67 Global Telecommunication Segment Market Share, By Region 2017-2022
TABLE 68 Global Telecommunication Segment Y-o-Y, By Region 2015-2022
TABLE 69 Global Government Segment Value (US$ Mn), By Region 2012-2016
TABLE 70 Global Government Segment Value (US$ Mn), By Region 2017-2022
TABLE 71 Global Government Segment Market Share, By Region 2012-2016
TABLE 72 Global Government Segment Market Share, By Region 2017-2022
TABLE 73 Global Government Segment Y-o-Y, By Region 2015-2022
TABLE 74 Global Others Segment Value (US$ Mn), By Region 2012-2016
TABLE 75 Global Others Segment Value (US$ Mn), By Region 2017-2022
TABLE 76 Global Others Segment Market Share, By Region 2012-2016
TABLE 77 Global Others Segment Market Share, By Region 2017-2022
TABLE 78 Global Others Segment Y-o-Y, By Region 2015-2022
TABLE 79 North America Mobile Mapping Market Value (US$ Mn), By Solution 2012-2016
TABLE 80 North America Mobile Mapping Market Value (US$ Mn), By Solution 2017-2022
TABLE 81 North America Mobile Mapping Market Value (US$ Mn), By End-User2012-2016
TABLE 82 North America Mobile Mapping Market Value (US$ Mn), By End-User2017-2022
TABLE 83 North America Mobile Mapping Market Value (US$ Mn), By Industry2012-2016
TABLE 84 North America Mobile Mapping Market Value (US$ Mn), By Industry2017-2022
TABLE 85 Latin America Mobile Mapping Market Value (US$ Mn), By Solution 2012-2016
TABLE 86 Latin America Mobile Mapping Market Value (US$ Mn), By Solution 2017-2022
TABLE 87 Latin America Mobile Mapping Market Value (US$ Mn), By End-User2012-2016
TABLE 88 Latin America Mobile Mapping Market Value (US$ Mn), By End-User2017-2022
TABLE 89 Latin America Mobile Mapping Market Value (US$ Mn), By Industry2012-2016
TABLE 90 Latin America Mobile Mapping Market Value (US$ Mn), By Industry2017-2022
TABLE 91 Europe Mobile Mapping Market Value (US$ Mn), By Solution 2012-2016
TABLE 92 Europe Mobile Mapping Market Value (US$ Mn), By Solution 2017-2022
TABLE 93 Europe Mobile Mapping Market Value (US$ Mn), By End-User2012-2016
TABLE 94 Europe Mobile Mapping Market Value (US$ Mn), By End-User2017-2022
TABLE 95 Europe Mobile Mapping Market Value (US$ Mn), By Industry2012-2016
TABLE 96 Europe Mobile Mapping Market Value (US$ Mn), By Industry2017-2022
TABLE 97 Japan Mobile Mapping Market Value (US$ Mn), By Solution 2012-2016
TABLE 98 Japan Mobile Mapping Market Value (US$ Mn), By Solution 2017-2022
TABLE 99 Japan Mobile Mapping Market Value (US$ Mn), By End-User2012-2016
TABLE 100 Japan Mobile Mapping Market Value (US$ Mn), By End-User2017-2022
TABLE 101 Japan Mobile Mapping Market Value (US$ Mn), By Industry2012-2016
TABLE 102 Japan Mobile Mapping Market Value (US$ Mn), By Industry2017-2022
TABLE 103 APEJ Mobile Mapping Market Value (US$ Mn), By Solution 2012-2016
TABLE 104 APEJ Mobile Mapping Market Value (US$ Mn), By Solution 2017-2022
TABLE 105 APEJ Mobile Mapping Market Value (US$ Mn), By End-User2012-2016
TABLE 106 APEJ Mobile Mapping Market Value (US$ Mn), By End-User2017-2022
TABLE 107 APEJ Mobile Mapping Market Value (US$ Mn), By Industry2012-2016
TABLE 108 APEJ Mobile Mapping Market Value (US$ Mn), By Industry2017-2022
TABLE 109 MEA Mobile Mapping Market Value (US$ Mn), By Solution 2012-2016
TABLE 110 MEA Mobile Mapping Market Value (US$ Mn), By Solution 2017-2022
TABLE 111 MEA Mobile Mapping Market Value (US$ Mn), By End-User2012-2016
TABLE 112 MEA Mobile Mapping Market Value (US$ Mn), By End-User2017-2022
TABLE 113 MEA Mobile Mapping Market Value (US$ Mn), By Industry2012-2016
TABLE 114 MEA Mobile Mapping Market Value (US$ Mn), By Industry2017-2022
TABLE 115 US Mobile Mapping Market Value (US$ Mn), By Solution 2012-2016
TABLE 116 US Mobile Mapping Market Value (US$ Mn), By Solution 2017-2022
TABLE 117 US Mobile Mapping Market Value (US$ Mn), By End-User2012-2016
TABLE 118 US Mobile Mapping Market Value (US$ Mn), By End-User2017-2022
TABLE 119 US Mobile Mapping Market Value (US$ Mn), By Industry2012-2016
TABLE 120 US Mobile Mapping Market Value (US$ Mn), By Industry2017-2022
TABLE 121 Canada Mobile Mapping Market Value (US$ Mn), By Solution 2012-2016
TABLE 122 Canada Mobile Mapping Market Value (US$ Mn), By Solution 2017-2022
TABLE 123 Canada Mobile Mapping Market Value (US$ Mn), By End-User2012-2016
TABLE 124 Canada Mobile Mapping Market Value (US$ Mn), By End-User2017-2022
TABLE 125 Canada Mobile Mapping Market Value (US$ Mn), By Industry2012-2016
TABLE 126 Canada Mobile Mapping Market Value (US$ Mn), By Industry2017-2022
TABLE 127 Brazil Mobile Mapping Market Value (US$ Mn), By Solution 2012-2016
TABLE 128 Brazil Mobile Mapping Market Value (US$ Mn), By Solution 2017-2022
TABLE 129 Brazil Mobile Mapping Market Value (US$ Mn), By End-User2012-2016
TABLE 130 Brazil Mobile Mapping Market Value (US$ Mn), By End-User2017-2022
TABLE 131 Brazil Mobile Mapping Market Value (US$ Mn), By Industry2012-2016
TABLE 132 Brazil Mobile Mapping Market Value (US$ Mn), By Industry2017-2022
TABLE 133 Mexico Mobile Mapping Market Value (US$ Mn), By Solution 2012-2016
TABLE 134 Mexico Mobile Mapping Market Value (US$ Mn), By Solution 2017-2022
TABLE 135 Mexico Mobile Mapping Market Value (US$ Mn), By End-User2012-2016
TABLE 136 Mexico Mobile Mapping Market Value (US$ Mn), By End-User2017-2022
TABLE 137 Mexico Mobile Mapping Market Value (US$ Mn), By Industry2012-2016
TABLE 138 Mexico Mobile Mapping Market Value (US$ Mn), By Industry2017-2022
TABLE 139 Argentina Mobile Mapping Market Value (US$ Mn), By Solution 2012-2016
TABLE 140 Argentina Mobile Mapping Market Value (US$ Mn), By Solution 2017-2022
TABLE 141 Argentina Mobile Mapping Market Value (US$ Mn), By End-User2012-2016
TABLE 142 Argentina Mobile Mapping Market Value (US$ Mn), By End-User2017-2022
TABLE 143 Argentina Mobile Mapping Market Value (US$ Mn), By Industry2012-2016
TABLE 144 Argentina Mobile Mapping Market Value (US$ Mn), By Industry2017-2022
TABLE 145 Germany Mobile Mapping Market Value (US$ Mn), By Solution 2012-2016
TABLE 146 Germany Mobile Mapping Market Value (US$ Mn), By Solution 2017-2022
TABLE 147 Germany Mobile Mapping Market Value (US$ Mn), By End-User2012-2016
TABLE 148 Germany Mobile Mapping Market Value (US$ Mn), By End-User2017-2022
TABLE 149 Germany Mobile Mapping Market Value (US$ Mn), By Industry2012-2016
TABLE 150 Germany Mobile Mapping Market Value (US$ Mn), By Industry2017-2022
TABLE 151 UK Mobile Mapping Market Value (US$ Mn), By Solution 2012-2016
TABLE 152 UK Mobile Mapping Market Value (US$ Mn), By Solution 2017-2022
TABLE 153 UK Mobile Mapping Market Value (US$ Mn), By End-User2012-2016
TABLE 154 UK Mobile Mapping Market Value (US$ Mn), By End-User2017-2022
TABLE 155 UK Mobile Mapping Market Value (US$ Mn), By Industry2012-2016
TABLE 156 UK Mobile Mapping Market Value (US$ Mn), By Industry2017-2022
TABLE 157 France Mobile Mapping Market Value (US$ Mn), By Solution 2012-2016
TABLE 158 France Mobile Mapping Market Value (US$ Mn), By Solution 2017-2022
TABLE 159 France Mobile Mapping Market Value (US$ Mn), By End-User2012-2016
TABLE 160 France Mobile Mapping Market Value (US$ Mn), By End-User2017-2022
TABLE 161 France Mobile Mapping Market Value (US$ Mn), By Industry2012-2016
TABLE 162 France Mobile Mapping Market Value (US$ Mn), By Industry2017-2022
TABLE 163 Spain Mobile Mapping Market Value (US$ Mn), By Solution 2012-2016
TABLE 164 Spain Mobile Mapping Market Value (US$ Mn), By Solution 2017-2022
TABLE 165 Spain Mobile Mapping Market Value (US$ Mn), By End-User2012-2016
TABLE 166 Spain Mobile Mapping Market Value (US$ Mn), By End-User2017-2022
TABLE 167 Spain Mobile Mapping Market Value (US$ Mn), By Industry2012-2016
TABLE 168 Spain Mobile Mapping Market Value (US$ Mn), By Industry2017-2022
TABLE 169 Italy Mobile Mapping Market Value (US$ Mn), By Solution 2012-2016
TABLE 170 Italy Mobile Mapping Market Value (US$ Mn), By Solution 2017-2022
TABLE 171 Italy Mobile Mapping Market Value (US$ Mn), By End-User2012-2016
TABLE 172 Italy Mobile Mapping Market Value (US$ Mn), By End-User2017-2022
TABLE 173 Italy Mobile Mapping Market Value (US$ Mn), By Industry2012-2016
TABLE 174 Italy Mobile Mapping Market Value (US$ Mn), By Industry2017-2022
TABLE 175 Nordic Mobile Mapping Market Value (US$ Mn), By Solution 2012-2016
TABLE 176 Nordic Mobile Mapping Market Value (US$ Mn), By Solution 2017-2022
TABLE 177 Nordic Mobile Mapping Market Value (US$ Mn), By End-User2012-2016
TABLE 178 Nordic Mobile Mapping Market Value (US$ Mn), By End-User2017-2022
TABLE 179 Nordic Mobile Mapping Market Value (US$ Mn), By Industry2012-2016
TABLE 180 Nordic Mobile Mapping Market Value (US$ Mn), By Industry2017-2022
TABLE 181 Japan Mobile Mapping Market Value (US$ Mn), By Solution 2012-2016
TABLE 182 Japan Mobile Mapping Market Value (US$ Mn), By Solution 2017-2022
TABLE 183 Japan Mobile Mapping Market Value (US$ Mn), By End-User2012-2016
TABLE 184 Japan Mobile Mapping Market Value (US$ Mn), By End-User2017-2022
TABLE 185 Japan Mobile Mapping Market Value (US$ Mn), By Industry2012-2016
TABLE 186 Japan Mobile Mapping Market Value (US$ Mn), By Industry2017-2022
TABLE 187 China Mobile Mapping Market Value (US$ Mn), By Solution 2012-2016
TABLE 188 China Mobile Mapping Market Value (US$ Mn), By Solution 2017-2022
TABLE 189 China Mobile Mapping Market Value (US$ Mn), By End-User2012-2016
TABLE 190 China Mobile Mapping Market Value (US$ Mn), By End-User2017-2022
TABLE 191 China Mobile Mapping Market Value (US$ Mn), By Industry2012-2016
TABLE 192 China Mobile Mapping Market Value (US$ Mn), By Industry2017-2022
TABLE 193 India Mobile Mapping Market Value (US$ Mn), By Solution 2012-2016
TABLE 194 India Mobile Mapping Market Value (US$ Mn), By Solution 2017-2022
TABLE 195 India Mobile Mapping Market Value (US$ Mn), By End-User2012-2016
TABLE 196 India Mobile Mapping Market Value (US$ Mn), By End-User2017-2022
TABLE 197 India Mobile Mapping Market Value (US$ Mn), By Industry2012-2016
TABLE 198 India Mobile Mapping Market Value (US$ Mn), By Industry2017-2022
TABLE 199 Malaysia Mobile Mapping Market Value (US$ Mn), By Solution 2012-2016
TABLE 200 Malaysia Mobile Mapping Market Value (US$ Mn), By Solution 2017-2022
TABLE 201 Malaysia Mobile Mapping Market Value (US$ Mn), By End-User2012-2016
TABLE 202 Malaysia Mobile Mapping Market Value (US$ Mn), By End-User2017-2022
TABLE 203 Malaysia Mobile Mapping Market Value (US$ Mn), By Industry2012-2016
TABLE 204 Malaysia Mobile Mapping Market Value (US$ Mn), By Industry2017-2022
TABLE 205 Thailand Mobile Mapping Market Value (US$ Mn), By Solution 2012-2016
TABLE 206 Thailand Mobile Mapping Market Value (US$ Mn), By Solution 2017-2022
TABLE 207 Thailand Mobile Mapping Market Value (US$ Mn), By End-User2012-2016
TABLE 208 Thailand Mobile Mapping Market Value (US$ Mn), By End-User2017-2022
TABLE 209 Thailand Mobile Mapping Market Value (US$ Mn), By Industry2012-2016
TABLE 210 Thailand Mobile Mapping Market Value (US$ Mn), By Industry2017-2022
TABLE 211 Singapore Mobile Mapping Market Value (US$ Mn), By Solution 2012-2016
TABLE 212 Singapore Mobile Mapping Market Value (US$ Mn), By Solution 2017-2022
TABLE 213 Singapore Mobile Mapping Market Value (US$ Mn), By End-User2012-2016
TABLE 214 Singapore Mobile Mapping Market Value (US$ Mn), By End-User2017-2022
TABLE 215 Singapore Mobile Mapping Market Value (US$ Mn), By Industry 2012-2016
TABLE 216 Singapore Mobile Mapping Market Value (US$ Mn), By Industry 2017-2022
TABLE 217 Australia Mobile Mapping Market Value (US$ Mn), By Solution 2012-2016
TABLE 218 Australia Mobile Mapping Market Value (US$ Mn), By Solution 2017-2022
TABLE 219 Australia Mobile Mapping Market Value (US$ Mn), By End-User 2012-2016
TABLE 220 Australia Mobile Mapping Market Value (US$ Mn), By End-User 2017-2022
TABLE 221 Australia Mobile Mapping Market Value (US$ Mn), By Industry 2012-2016
TABLE 222 Australia Mobile Mapping Market Value (US$ Mn), By Industry 2017-2022
TABLE 223 GCC Countries Mobile Mapping Market Value (US$ Mn), By Solution 2012-2016
TABLE 224 GCC Countries Mobile Mapping Market Value (US$ Mn), By Solution 2017-2022
TABLE 225 GCC Countries Mobile Mapping Market Value (US$ Mn), By End-User 2012-2016
TABLE 226 GCC Countries Mobile Mapping Market Value (US$ Mn), By End-User 2017-2022
TABLE 227 GCC Countries Mobile Mapping Market Value (US$ Mn), By Industry 2012-2016
TABLE 228 GCC Countries Mobile Mapping Market Value (US$ Mn), By Industry 2017-2022
TABLE 229 South Africa Mobile Mapping Market Value (US$ Mn), By Solution 2012-2016
TABLE 230 South Africa Mobile Mapping Market Value (US$ Mn), By Solution 2017-2022
TABLE 231 South Africa Mobile Mapping Market Value (US$ Mn), By End-User 2012-2016
TABLE 232 South Africa Mobile Mapping Market Value (US$ Mn), By End-User 2017-2022
TABLE 233 South Africa Mobile Mapping Market Value (US$ Mn), By Industry 2012-2016
TABLE 234 South Africa Mobile Mapping Market Value (US$ Mn), By Industry 2017-2022
TABLE 235 Nigeria Mobile Mapping Market Value (US$ Mn), By Solution 2012-2016
TABLE 236 Nigeria Mobile Mapping Market Value (US$ Mn), By Solution 2017-2022
TABLE 237 Nigeria Mobile Mapping Market Value (US$ Mn), By End-User 2012-2016
TABLE 238 Nigeria Mobile Mapping Market Value (US$ Mn), By End-User 2017-2022
TABLE 239 Nigeria Mobile Mapping Market Value (US$ Mn), By Industry 2012-2016
TABLE 240 Nigeria Mobile Mapping Market Value (US$ Mn), By Industry 2017-2022
TABLE 241 Israel Mobile Mapping Market Value (US$ Mn), By Solution 2012-2016
TABLE 242 Israel Mobile Mapping Market Value (US$ Mn), By Solution 2017-2022
TABLE 243 Israel Mobile Mapping Market Value (US$ Mn), By End-User 2012-2016
TABLE 244 Israel Mobile Mapping Market Value (US$ Mn), By End-User 2017-2022
TABLE 245 Israel Mobile Mapping Market Value (US$ Mn), By Industry 2012-2016
TABLE 246 Israel Mobile Mapping Market Value (US$ Mn), By Industry 2017-2022
List of Figures
FIG. 1 Global Mobile Mapping Market Value (US$ Mn), 2012-2016
FIG. 2 Global Mobile Mapping Market Value (US$ Mn) Forecast, 2017-2022
FIG. 3 Global Mobile Mapping Market Value (US$ Mn) and Y-o-Y, 2015-2022
FIG. 4 Global Location based Service Segment Market Value (US$ Mn) By Region, 2012-2016
FIG. 5 Global Location based Service Segment Market Value (US$ Mn) By Region, 2017-2022
FIG. 6 Global Location based Service Segment Y-o-Y Growth Rate, By Region, 2015-2022
FIG. 7 Global Indoor mapping Segment Market Value (US$ Mn) By Region, 2012-2016
FIG. 8 Global Indoor mapping Segment Market Value (US$ Mn) By Region, 2017-2022
FIG. 9 Global Indoor mapping Segment Y-o-Y Growth Rate, By Region, 2015-2022
FIG. 10 Global 3D Mapping Segment Market Value (US$ Mn) By Region, 2012-2016
FIG. 11 Global 3D Mapping Segment Market Value (US$ Mn) By Region, 2017-2022
FIG. 12 Global 3D Mapping Segment Y-o-Y Growth Rate, By Region, 2015-2022
FIG. 13 Global Support Services Segment Market Value (US$ Mn) By Region, 2012-2016
FIG. 14 Global Support Services Segment Market Value (US$ Mn) By Region, 2017-2022
FIG. 15 Global Support Services Segment Y-o-Y Growth Rate, By Region, 2015-2022
FIG. 16 Global Other solution Segment Market Value (US$ Mn) By Region, 2012-2016
FIG. 17 Global Other solution Segment Market Value (US$ Mn) By Region, 2017-2022
FIG. 18 Global Other solution Segment Y-o-Y Growth Rate, By Region, 2015-2022
FIG. 19 Global Commercial Segment Market Value (US$ Mn) By Region, 2012-2016
FIG. 20 Global Commercial Segment Market Value (US$ Mn) By Region, 2017-2022
FIG. 21 Global Commercial Segment Y-o-Y Growth Rate, By Region, 2015-2022
FIG. 22 Global Individual Segment Market Value (US$ Mn) By Region, 2012-2016
FIG. 23 Global Individual Segment Market Value (US$ Mn) By Region, 2017-2022
FIG. 24 Global Individual Segment Y-o-Y Growth Rate, By Region, 2015-2022
FIG. 25 Global BFSI Segment Market Value (US$ Mn) By Region, 2012-2016
FIG. 26 Global BFSI Segment Market Value (US$ Mn) By Region, 2017-2022
FIG. 27 Global BFSI Segment Y-o-Y Growth Rate, By Region, 2015-2022
FIG. 28 Global Travel & Hospitality Segment Market Value (US$ Mn) By Region, 2012-2016
FIG. 29 Global Travel & Hospitality Segment Market Value (US$ Mn) By Region, 2017-2022
FIG. 30 Global Travel & Hospitality Segment Y-o-Y Growth Rate, By Region, 2015-2022
FIG. 31 Global Energy & Utility Segment Market Value (US$ Mn) By Region, 2012-2016
FIG. 32 Global Energy & Utility Segment Market Value (US$ Mn) By Region, 2017-2022
FIG. 33 Global Energy & Utility Segment Y-o-Y Growth Rate, By Region, 2015-2022
FIG. 34 Global Oil & Gas Segment Market Value (US$ Mn) By Region, 2012-2016
FIG. 35 Global Oil & Gas Segment Market Value (US$ Mn) By Region, 2017-2022
FIG. 36 Global Oil & Gas Segment Y-o-Y Growth Rate, By Region, 2015-2022
FIG. 37 Global Healthcare Segment Market Value (US$ Mn) By Region, 2012-2016
FIG. 38 Global Healthcare Segment Market Value (US$ Mn) By Region, 2017-2022
FIG. 39 Global Healthcare Segment Y-o-Y Growth Rate, By Region, 2015-2022
FIG. 40 Global Telecommunication Segment Market Value (US$ Mn) By Region, 2012-2016
FIG. 41 Global Telecommunication Segment Market Value (US$ Mn) By Region, 2017-2022
FIG. 42 Global Telecommunication Segment Y-o-Y Growth Rate, By Region, 2015-2022
FIG. 43 Global Government Segment Market Value (US$ Mn) By Region, 2012-2016
FIG. 44 Global Government Segment Market Value (US$ Mn) By Region, 2017-2022
FIG. 45 Global Government Segment Y-o-Y Growth Rate, By Region, 2015-2022
FIG. 46 Global Others Segment Market Value (US$ Mn) By Region, 2012-2016
FIG. 47 Global Others Segment Market Value (US$ Mn) By Region, 2017-2022
FIG. 48 Global Others Segment Y-o-Y Growth Rate, By Region, 2015-2022
FIG. 49 North America Mobile Mapping Market Value (US$ Mn), By Solution 2012-2016
FIG. 50 North America Mobile Mapping Market Value (US$ Mn), By Solution 2017-2022
FIG. 51 North America Mobile Mapping Market Value (US$ Mn), By End-User2012-2016
FIG. 52 North America Mobile Mapping Market Value (US$ Mn), By End-User2017-2022
FIG. 53 North America Mobile Mapping Market Value (US$ Mn), By Industry2012-2016
FIG. 54 North America Mobile Mapping Market Value (US$ Mn), By Industry2017-2022
FIG. 55 Latin America Mobile Mapping Market Value (US$ Mn), By Solution 2012-2016
FIG. 56 Latin America Mobile Mapping Market Value (US$ Mn), By Solution 2017-2022
FIG. 57 Latin America Mobile Mapping Market Value (US$ Mn), By End-User2012-2016
FIG. 58 Latin America Mobile Mapping Market Value (US$ Mn), By End-User2017-2022
FIG. 59 Latin America Mobile Mapping Market Value (US$ Mn), By Industry2012-2016
FIG. 60 Latin America Mobile Mapping Market Value (US$ Mn), By Industry2017-2022
FIG. 61 Europe Mobile Mapping Market Value (US$ Mn), By Solution 2012-2016
FIG. 62 Europe Mobile Mapping Market Value (US$ Mn), By Solution 2017-2022
FIG. 63 Europe Mobile Mapping Market Value (US$ Mn), By End-User2012-2016
FIG. 64 Europe Mobile Mapping Market Value (US$ Mn), By End-User2017-2022
FIG. 65 Europe Mobile Mapping Market Value (US$ Mn), By Industry2012-2016
FIG. 66 Europe Mobile Mapping Market Value (US$ Mn), By Industry2017-2022
FIG. 67 Japan Mobile Mapping Market Value (US$ Mn), By Solution 2012-2016
FIG. 68 Japan Mobile Mapping Market Value (US$ Mn), By Solution 2017-2022
FIG. 69 Japan Mobile Mapping Market Value (US$ Mn), By End-User2012-2016
FIG. 70 Japan Mobile Mapping Market Value (US$ Mn), By End-User2017-2022
FIG. 71 Japan Mobile Mapping Market Value (US$ Mn), By Industry2012-2016
FIG. 72 Japan Mobile Mapping Market Value (US$ Mn), By Industry2017-2022
FIG. 73 APEJ Mobile Mapping Market Value (US$ Mn), By Solution 2012-2016
FIG. 74 APEJ Mobile Mapping Market Value (US$ Mn), By Solution 2017-2022
FIG. 75 APEJ Mobile Mapping Market Value (US$ Mn), By End-User2012-2016
FIG. 76 APEJ Mobile Mapping Market Value (US$ Mn), By End-User2017-2022
FIG. 77 APEJ Mobile Mapping Market Value (US$ Mn), By Industry2012-2016
FIG. 78 APEJ Mobile Mapping Market Value (US$ Mn), By Industry2017-2022
FIG. 79 MEA Mobile Mapping Market Value (US$ Mn), By Solution 2012-2016
FIG. 80 MEA Mobile Mapping Market Value (US$ Mn), By Solution 2017-2022
FIG. 81 MEA Mobile Mapping Market Value (US$ Mn), By End-User2012-2016
FIG. 82 MEA Mobile Mapping Market Value (US$ Mn), By End-User2017-2022
FIG. 83 MEA Mobile Mapping Market Value (US$ Mn), By Industry2012-2016
FIG. 84 MEA Mobile Mapping Market Value (US$ Mn), By Industry2017-2022
Copyright © Transparency Market Research, Inc. All Rights reserved
Trust Online

Mobile Mapping Market