
Reports
Reports
Global Microfluidics Market – Snapshot
Set to grow at a double digit growth rate, compounded annually, the global microfluidics market will be a hotbed of growth opportunities for market players between 2017 and 2025. And, as per experts, the growth propellers over the period include high incidence of chronic diseases, easy to carry and use device, growing need for point of care testing and a faster timeline for analysis completion.
Besides, rising geriatric population will help the global microfluidics market onto a higher trajectory over the forecast period. This demographic – aged 60 and over – will see an increase in numbers from 900 million to 2 billion from 2015 to 2050.
The global microfluidics market has a large number of players in the vendor landscape, making it a fragmented landscape. Also, the presence of a large number of players makes the competition intense. Companies that hold a substantial share in the global microfluidics market include Danaher Corporation, PerkinElmer Inc., Agilent Technologies Inc., Bio-Rad Laboratories Inc., and Thermo Fisher Scientific Inc.
Most players are try to gain a larger market share by making use of technology. And, it is not surprising considering that product innovation would be at the heart of growth in the market landscape over the forecast period. Additionally, innovation at affordable prices will be key to growth.
In-vitro Diagnostics to Dominate the Application Segment in the Global Microfluidics Market Report, over the Forecast Period
Basis application, the global microfluidics market report is sub-divided into biotech and pharmaceutical research, drug delivery, peripheral vascular diseases, in-vitro diagnostics, and wound care management. Here, in-vitro will lead the segment owing to rising demand for pregnancy kits and associated devices and instruments.
The report is further segmented by end users, materials, and products. By end-users, it is sub-segmented into diagnostic labs, academic research, home care settings, and hospitals. And, by materials, the segmentation is as follows – polymer-based and glass based.
On the basis of product, the sub segments are reagents and cartridges, instrument, and chips. Cartridges and Reagents will dominate the segment over the forecast period growing acceptance for industries and laboratories for associated products.
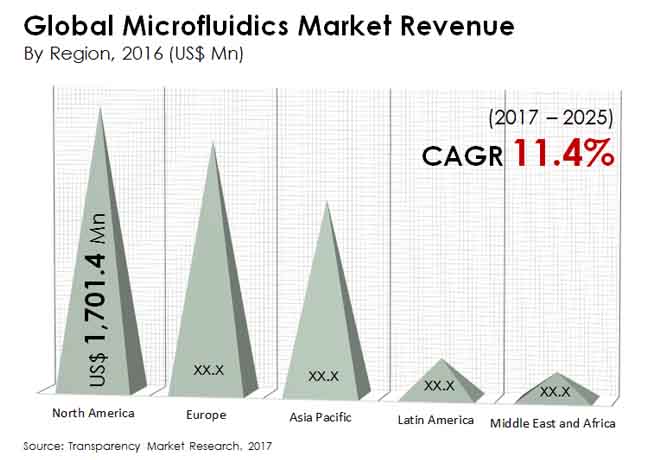
North America to Hold Prominent Place in the Regional Segmentation of Global Microfluidics Market
The global microfluidics market reports, prepared by Transparency Market Research (TMR), is segmented region wise as follows – Europe, North America, Latin America, Asia Pacific (APAC), and Middle East and Africa.
A well-established health care system is at the core of North America’s regional highlights. Combine it with a robust framework for reimbursement and one witnesses a dominant region emerging as far as microfluidics is concerned. Some credit in making North America a dominant region in the microfluidics market over the forecast period also goes to higher adoption of new therapeutics. Additionally, the region is seeing early greying in terms of age with one in every four people set to be aged 65 and above by 2050. The same ratio of geriatrics to the rest of the population would be followed by Europe.
It is also worth noting here that in the United States of America, focus on Research and Development (R&D) is sharp and point of care diagnostics and molecular diagnostics are widespread. And, this bodes well for the region in the years to come.
1. Preface
1.1. Report Scope
1.2. Market Segmentation
1.3. Research Highlights
2. Assumptions and Research Methodology
2.1. Assumptions
2.2. Acronyms Used
2.3. Research Methodology
3. Executive Summary
4. Market Overview
4.1. Microfluidics Market Overview
4.2. Key Industry Events
4.3. Microfluidics Market Opportunity Map
5. Market Dynamics
5.1.Microfluidics Market Drivers and Restraints Snapshot Analysis
5.2. Drivers
5.3. Restraints
5.4. Opportunity Analysis
5.5. Opportunities
5.6. Trends
5.7. Porter’s Five Forces Analysis
6. Global Microfluidics Market Analysis, By Product
6.1. Key Findings
6.2. Introduction
6.3. Global Microfluidics Market Value Share Analysis, By Product Type
6.4. Global Microfluidics Market Size (US$ Mn) Forecast, by Product Type, 2015–2025
6.5. Global Microfluidics Instrument Market Revenue, US$ Mn, 2016–2025
6.6. Global Microfluidics Chip Market Revenue, US$ Mn, 2016–2025
6.7. Global Microfluidics Cartridges & Reagents Market Revenue, US$ Mn, 2016–2025
6.8. Global Microfluidics Others Market Revenue, US$ Mn, 2016–2025
6.9. Global Microfluidics Market Attractiveness Analysis, by product type
6.10. Key Trends
7. Global Microfluidics Market Analysis, by Applications
7.1. Key Findings
7.2. Introduction
7.3. Global Microfluidics Market Value Share Analysis, By Application 2016 and 2025
7.4. Global Microfluidics Market Size (US$ Mn) Forecast, by Application, 2016–2025
7.5. Global Peripheral Vascular Diseases Market Revenue, US$ Mn, 2016–2025
7.6. Global Wound Care Management Market Revenue, US$ Mn, 2016–2025
7.7. Global Pharmaceutical & Biotech Research Market Revenue, US$ Mn, 2016–2025
7.8. Global In vitro Diagnostics (IVD) Market Revenue, US$ Mn, 2016–2025
7.9. Global Drug Delivery Market Revenue, US$ Mn, 2016–2025
7.10. Global Microfluidics Market Attractiveness Analysis, by Application
7.11. Key Trends
8. Global Microfluidics Market Analysis, by Material
8.1 Global Microfluidics Market Value Share Analysis, By Material 2016 and 2025
8.2. Global Microfluidics Market Size (US$ Mn) Forecast, by Material, 2015–2025
8.3. Global Polymer based Market Revenue, US$ Mn, 2016–2025
8.4. Global Glass Based Market Revenue, US$ Mn, 2016–2025
8.5. Global Others Market Revenue, US$ Mn, 2016–2025
8.6. Global Microfluidics Market Attractiveness Analysis, by material
8.7. Key Trends
9. Global Microfluidics Market Analysis, by End Users
9.1. Global Microfluidics Market Value Share Analysis, by End-user
9.2. Global Microfluidics Market Size (US$ Mn) Forecast, by End-user, 2015–2025
9.3. Global Hospital Market Revenue, US$ Mn, 2016–2025
9.4. Global Academic & Research Market Revenue, US$ Mn, 2016–2025
9.5. Global Diagnostic Labs Market Revenue, US$ Mn, 2016–2025
9.6. Global Home care settings Market Revenue, US$ Mn, 2016–2025
9.7. Global Others Market Revenue, US$ Mn, 2016–2025
9.8. Global Microfluidics Market Attractiveness Analysis, by End-user
9.9. Key Trends
10. Global Microfluidics Market Analysis By Region
10.1. Global Regulatory Scenario
10.2. Global Microfluidics Market Value Share Analysis, by Region, 2017 and 2025
10.3. Global Microfluidics Market Size (US$ Mn) and Volume (Units) Forecast, by Region, 2015–2025
10.4. Global Microfluidics Market Attractiveness Analysis, by Region
11. North America Microfluidics Market
11.1. North America Microfluidics Market Key Findings
11.2. North America Microfluidics Market Size (US$ Mn) Forecast, 2015–2025
11.3. North America Microfluidics Market Attractiveness Analysis, by Country
11.4. North America Microfluidics Market Value Share Analysis, by Product Type, 2017 and 2025
11.5. North America Microfluidics Market Size (US$ Mn) Forecast, by product type, 2015–2025
11.6. North America Microfluidics Market Value Share Analysis, by Application, 2017 and 2025
11.7. North America Microfluidics Market Size (US$ Mn) Forecast, by Application 2015–2025
11.8. North America Microfluidics Market Value Share Analysis, by Material, 2017 and 2025
11.9. North America Microfluidics Market Size (US$ Mn) Forecast, by Material 2015–2025
11.10. North America Microfluidics Market Value Share Analysis, by end user, 2017 and 2025
11.11. North America Microfluidics Market Size (US$ Mn) Forecast, by end user 2015–2025
11.12. North America Microfluidics Market Value Share Analysis, by Country
11.13. North America Microfluidics Market Size (US$ Mn) Forecast, by Country, 2015–2025
11.14. North America Microfluidics Market Attractiveness Analysis, by Product Type
11.15. North America Microfluidics Market Attractiveness Analysis, by Application
11.16. North America Microfluidics Market Attractiveness Analysis, by Material
11.17. North America Microfluidics Market Attractiveness Analysis, by End-user
11.18. North America Microfluidics Market Trends
12. Europe Microfluidics Market
12.1. Europe Microfluidics Market Key Findings
12.2. Europe Microfluidics Market Size (US$ Mn) Forecast, 2015–2025
12.3. Europe Microfluidics Market Attractiveness Analysis, by Country
12.4. Europe Microfluidics Market Value Share Analysis, by Product Type, 2017 and 2025
12.5. Europe Microfluidics Market Size (US$ Mn) Forecast, by product type, 2015–2025
12.6. Europe Microfluidics Market Value Share Analysis, by Application, 2017 and 2025
12.7. Europe Microfluidics Market Size (US$ Mn) Forecast, by Application 2015–2025
12.8. Europe Microfluidics Market Value Share Analysis, by Material, 2017 and 2025
12.9. Europe Microfluidics Market Size (US$ Mn) Forecast, by Material 2015–2025
12.10. Europe Microfluidics Market Value Share Analysis, by end user, 2017 and 2025
12.11. Europe Microfluidics Market Size (US$ Mn) Forecast, by end user 2015–2025
12.12. Europe Microfluidics Market Value Share Analysis, by Country
12.13. Europe Microfluidics Market Size (US$ Mn) Forecast, by Country, 2015–2025
12.14. Europe Microfluidics Market Attractiveness Analysis, by Product Type
12.15. Europe Microfluidics Market Attractiveness Analysis, by Application
12.16. Europe Microfluidics Market Attractiveness Analysis, by Material
12.17. Europe Microfluidics Market Attractiveness Analysis, by End-user
12.18. Europe Microfluidics Market Attractiveness Analysis, by material
12.19. Europe Microfluidics Market Trends
13. Asia Pacific Microfluidics Market
13.1. Asia Pacific Microfluidics Market Key Findings
13.2. Asia Pacific Microfluidics Market Size (US$ Mn) Forecast, 2015–2025
13.3. Asia Pacific Microfluidics Market Attractiveness Analysis, by Country
13.4. Asia Pacific Microfluidics Market Value Share Analysis, by Product Type, 2017 and 2025
13.5. Asia Pacific Microfluidics Market Size (US$ Mn) Forecast, by product type, 2015–2025
13.6. Asia Pacific Microfluidics Market Value Share Analysis, by Application, 2017 and 2025
13.7. Asia Pacific Microfluidics Market Size (US$ Mn) Forecast, by Application 2015–2025
13.8. Asia Pacific Microfluidics Market Value Share Analysis, by Material, 2017 and 2025
13.9. Asia Pacific Microfluidics Market Size (US$ Mn) Forecast, by Material 2015–2025
13.10. Asia Pacific Microfluidics Market Value Share Analysis, by end user, 2017 and 2025
13.11. Asia Pacific Microfluidics Market Size (US$ Mn) Forecast, by end user, 2015–2025
13.12. Asia Pacific Microfluidics Market Value Share Analysis, by Country
13.13. Asia Pacific Microfluidics Market Size (US$ Mn) Forecast, by Country, 2015–2025
13.14. Asia Pacific Microfluidics Market Attractiveness Analysis, by Product Type
13.15. Asia Pacific Microfluidics Market Attractiveness Analysis, by Application
13.16. Asia Pacific Microfluidics Market Attractiveness Analysis, by Material
13.17. Asia Pacific Microfluidics Market Attractiveness Analysis, by End-user
13.18. Asia Pacific Microfluidics Market Attractiveness Analysis, by material
13.19. Asia Pacific Microfluidics Market Trends
14. Latin America Microfluidics Market
14.1. Latin America Microfluidics Market Key Findings
14.2. Latin America Microfluidics Market Size (US$ Mn) Forecast, 2015–2025
14.3. Latin America Microfluidics Market Attractiveness Analysis, by Country
14.4. Latin America Microfluidics Market Value Share Analysis, by Product Type, 2017 and 2025
14.5. Latin America Microfluidics Market Size (US$ Mn) Forecast, by product type, 2015–2025
14.6. Latin America Microfluidics Market Value Share Analysis, by Application, 2017 and 2025
14.7. Latin America Microfluidics Market Size (US$ Mn) Forecast, by Application 2015–2025
14.8. Latin America Microfluidics Market Value Share Analysis, by Material, 2017 and 2025
14.9. Latin America Microfluidics Market Size (US$ Mn) Forecast, by Material 2015–2025
14.10. Latin America Microfluidics Market Value Share Analysis, by end user, 2017 and 2025
14.11. Latin America Microfluidics Market Size (US$ Mn) Forecast, by end user, 2015–2025
14.12. Latin America Microfluidics Market Value Share Analysis, by Country
14.13. Latin America Microfluidics Market Size (US$ Mn) Forecast, by Country, 2015–2025
14.14. Latin America Microfluidics Market Attractiveness Analysis, by Product Type
14.15. Latin America Microfluidics Market Attractiveness Analysis, by Application
14.16. Latin America Microfluidics Market Attractiveness Analysis, by Material
14.17. Latin America Microfluidics Market Attractiveness Analysis, by End-user
14.18. Latin America Microfluidics Market Attractiveness Analysis, by material
14.19. Latin America Microfluidics Market Trends
15. Middle East & Africa (MEA) Microfluidics Market
15.1. Middle East & Africa (MEA) Microfluidics Market Key Findings
15.2. MEA Microfluidics Market Size (US$ Mn) Forecast, 2015–2025
15.3. MEA Microfluidics Market Attractiveness Analysis, by Country
15.4. MEA Microfluidics Market Value Share Analysis, by Product Type, 2017 and 2025
15.5. MEA Microfluidics Market Size (US$ Mn) Forecast, by product type, 2015–2025
15.6. MEA Microfluidics Market Value Share Analysis, by Application, 2017 and 2025
15.7. MEA Microfluidics Market Size (US$ Mn) Forecast, by Application 2015–2025
15.8. MEA Microfluidics Market Value Share Analysis, by Material, 2017 and 2025
15.9. MEA Microfluidics Market Size (US$ Mn) Forecast, by Material 2015–2025
15.10. MEA Microfluidics Market Value Share Analysis, by end user, 2017 and 2025
15.11. MEA Microfluidics Market Size (US$ Mn) Forecast, by end user, 2015–2025
15.12. MEA Microfluidics Market Value Share Analysis, by Country
15.13. MEA Microfluidics Market Size (US$ Mn) Forecast, by Country, 2015–2025
15.14. MEA Microfluidics Market Attractiveness Analysis, by Product Type
15.15. MEA Microfluidics Market Attractiveness Analysis, by Application
15.16. MEA Microfluidics Market Attractiveness Analysis, by Material
15.17. MEA Microfluidics Market Attractiveness Analysis, by End-user
15.18. MEA Microfluidics Market Attractiveness Analysis, by material
15.19. MEA Microfluidics Market Trends
16. Competition Landscape
16.1. Global Microfluidics Market Share Analysis, By Company, (2016)
16.2. Competition Matrix
17. Company Profiles
17.1 Becton, Dickinson and Company
17.1.1. Company Overview
17.1.2. Business Overview
17.1.3. Financial Overview
17.1.4. SWOT Analysis
17.1.5. Strategic Overview
17.2. Agilent Technologies, Inc.
17.2.1. Company Overview
17.2.2. Business Overview
17.2.3. Financial Overview
17.2.4. SWOT Analysis
17.3.5. Strategic Overview
17.3. PerkinElmer, Inc.
17.3.1. Company Overview
17.3.2. Business Overview
17.3.3. Financial Overview
17.3.4. SWOT Analysis
17.3.5. Strategic Overview
17.4. Danaher Corporation
17.4.1. Company Overview
17.4.2. Business Overview
17.4.3. Financial Overview
17.4.4. SWOT Analysis
17.4.5. Strategic Overview
17.5. Bio-Rad Laboratories
17.5.1. Company Overview
17.5.2. Business Overview
17.5.3. Financial Overview
17.5.4. SWOT Analysis
17.5.5 Strategic Overview
17.6. Thermo Fisher Scientific
17.6.1. Company Overview
17.6.2. Business Overview
17.6.3. Financial Overview
17.6.4. SWOT Analysis
17.6.5. Strategic Overview
17.7. F. Hoffmann-La Roche AG
17.7.1. Company Overview
17.7.2. Business Overview
17.7.3. Financial Overview
17.7.4. SWOT Analysis
17.7.5. Strategic Overview
17.8. Abbott Laboratories
17.8.1. Company Overview
17.8.2. Business Overview
17.8.3. Financial Overview
17.8.4. SWOT Analysis
17.8.5 Strategic Overview
17.9. IDEX Corporation
17.9.1. Company Overview
17.9.2. Business Overview
17.9.3. Financial Overview
17.9.4 SWOT Analysis
17.9.5. Strategic Overview
17.10. RainDance Technologies, Inc.
17.10.1 Company Overview
17.10.2 Business Overview
17.10.3 Financial Overview
17.10.4 SWOT Analysis
17.10.5. Strategic Overview
List of Tables
Table 01: Global Microfluidics Market Size (US$ Mn) Forecast, by Product Type, 2015–2025
Table 02: Global Microfluidics Market Size (US$ Mn) Forecast, by Application, 2015–2025
Table 03: Global Microfluidics Market Size (US$ Mn) Forecast, by Material, 2015–2025
Table 04: Global Microfluidics Market Size (US$ Mn) Forecast, by End-user, 2015–2025
Table 05: North America Microfluidics Market Size (US$ Mn) Forecast, by Product Type, 2015–2025
Table 06: North America Microfluidics Market Size (US$ Mn) Forecast, by Application, 2015–2025
Table 07: North America Microfluidics Market Size (US$ Mn) Forecast, by Material, 2015–2025
Table 08: North America Microfluidics Market Size (US$ Mn) Forecast, by End-user, 2015–2025
Table 09: North America Microfluidics Market Size (US$ Mn Forecast, by Country, 2015–2025
Table 10: Europe Microfluidics Market Size (US$ Mn) Forecast, by Product Type, 2015–2025
Table 11: Europe Microfluidics Market Size (US$ Mn) Forecast, by Application, 2015–2025
Table 12: Europe Microfluidics Market Size (US$ Mn) Forecast, by Material 2015–2025
Table 13: Europe Microfluidics Market Size (US$ Mn) Forecast, by End-user, 2015–2025
Table 14: Europe Microfluidics Market Size (US$ Mn) Forecast, by Country, 2015–2025
Table 15: Asia Pacific Microfluidics Market Size (US$ Mn), by Product Type, 2015–2025
Table 16: Asia Pacific Microfluidics Market Size (US$ Mn) Forecast, by Application, 2015–2025
Table 17: Asia Pacific Microfluidics Market Size (US$ Mn) Forecast, by Material, 2015–2025
Table 18: Asia Pacific Microfluidics Market Size (US$ Mn) Forecast, by End-user, 2015–2025
Table 19: Asia Pacific Microfluidics Market Size (US$ Mn), by Country, 2015–2025
Table 20: Latin America Microfluidics Market Size (US$ Mn) Forecast, by Product Type, 2015–2025
Table 21: Latin America Microfluidics Market Size (US$ Mn), by Application, 2015–2025
Table 22: Latin America Microfluidics Market Size (US$ Mn) Forecast, by Material, 2015–2025
Table 23: Latin America Microfluidics Market Size (US$ Mn) Forecast, by End-user, 2015–2025
Table 24: Latin America Microfluidics Market Size (US$ Mn), by Country, 2015–2025
Table 25: Middle East & Africa Microfluidics Market Size (US$ Mn) Forecast, by Product Type, 2015–2025
Table 26: Middle East & Africa Microfluidics Market Size (US$ Mn) Forecast, by Application, 2015–2025
Table 27: Middle East & Africa Microfluidics Market Size (US$ Mn) Forecast, by Material, 2015–2025
Table 28: Middle East & Africa Microfluidics Market Size (US$ Mn) Forecast, by End-user, 2015–2025
Table 29: Middle East & Africa Microfluidics Market Size (US$ Mn), by Country, 2015–2025
List of Figures
Figure 01: Global Microfluidics Market Value Share Analysis, by Product Type, 2017 and 2025
Figure 02: Global Microfluidics Market Size (US$ Mn) and Y-o-Y Growth (%) Forecast, by Product Type, 2016–2025
Figure 03: Global Microfluidics Market Size (US$ Mn) and Y-o-Y Growth (%) Forecast, By Product Type, 2016–2025
Figure 04: Global Microfluidics Market Size (US$ Mn) and Y-o-Y Growth (%) Forecast, by Product Type, 2016–2025
Figure 05: Global Microfluidics Market Size (US$ Mn) and Y-o-Y Growth (%) Forecast, by Product Type, 2016–2025
Figure 06: Microfluidics Market Attractiveness Analysis, by Product Type
Figure 07: Global Microfluidics Market Value Share Analysis, by Application, 2017 and 2025
Figure 08: Global Microfluidics Market Size (US$ Mn) and Y-o-Y Growth (%) Forecast, by Application, 2016–2025
Figure 09: Global Microfluidics Market Size (US$ Mn) and Y-o-Y Growth (%) Forecast, by Application, 2016–2025
Figure 10: Global Microfluidics Market Size (US$ Mn) and Y-o-Y Growth (%) Forecast, by Application, 2016–2025
Figure 11: Global Microfluidics Market Size (US$ Mn) and Y-o-Y Growth (%) Forecast, by Application, 2016–2025
Figure 12: Global Microfluidics Market Size (US$ Mn) and Y-o-Y Growth (%) Forecast, by Application, 2016–2025
Figure 13: Global Microfluidics Market Size (US$ Mn) and Y-o-Y Growth (%) Forecast, by Application, 2016–2025
Figure 14: Microfluidics Market Attractiveness Analysis, by Application
Figure 15: Global Microfluidics Market Value Share Analysis, by Material, 2017 and 2025
Figure 16: Global Microfluidics Market Size (US$ Mn) and Y-o-Y Growth (%) Forecast, by Material, 2016–2025
Figure 17: Global Microfluidics Market Size (US$ Mn) and Y-o-Y Growth (%) Forecast, by Material, 2016–2025
Figure 18: Global Microfluidics Market Size (US$ Mn) and Y-o-Y Growth (%) Forecast, by Material, 2016–2025
Figure 19: Global Microfluidics Market Attractiveness Analysis, by Material
Figure 20: Global Microfluidics Market Value Share Analysis, by End-user, 2017 and 2025
Figure 21: Global Microfluidics Market Size (US$ Mn) Forecast and Y-o-Y Growth (%), by Hospitals, 2016–2025
Figure 22: Global Microfluidics Market Size (US$ Mn) Forecast and Y-o-Y Growth (%), by Academic & Research Institutes, 2016–2025
Figure 23: Global Microfluidics Market Size (US$ Mn) Forecast and Y-o-Y Growth (%), by Diagnostic Labs, 2016–2025
Figure 24: Global Microfluidics Market Size (US$ Mn) Forecast and Y-o-Y Growth (%), by Homecare Settings, 2016–2025
Figure 25: Global Microfluidics Market Size (US$ Mn) Forecast and Y-o-Y Growth (%), by Others, 2016–2025
Figure 26: Global Microfluidics Market Attractiveness Analysis, by End-user
Figure 27: North America Microfluidics Market Size (US$ Mn) Forecast and Y-o-Y Growth (%), 2015–2025
Figure 28: North America Microfluidics Market Attractiveness Analysis, by Country
Figure 29: North America Microfluidics Market Value Share Analysis, by Product Type, 2017 and 2025
Figure 30: North America Microfluidics Market Value Share Analysis, by Application, 2017 and 2025
Figure 31: North America Microfluidics Market Value Share Analysis, by Material, 2017 and 2025
Figure 32: North America Microfluidics Market Value Share Analysis, by End-user, 2017 and 2025
Figure 33: North America Microfluidics Market Value Share Analysis, by Country, 2017 and 2025
Figure 34: North America Microfluidics Market Attractiveness By Product Type
Figure 35: North America Microfluidics Market Attractiveness Analysis, By Application
Figure 36: North America Microfluidics Market Attractiveness By Material
Figure 37: North America Microfluidics Market Attractiveness Analysis, By End Users
Figure 38: Europe Microfluidics Market Size (US$ Mn) Forecast and Y-o-Y Growth (%), 2015–2025
Figure 39: Europe Microfluidics Market Attractiveness Analysis, by Country
Figure 40: Europe Microfluidics Market Value Share Analysis, by Product Type, 2017 and 2025
Figure 41: Europe Microfluidics Market Value Share Analysis, by Application, 2017 and 2025
Figure 42: Europe Microfluidics Market Value Share Analysis, by Material, 2017 and 2025
Figure 43: Europe Microfluidics Market Value Share Analysis, by End-user, 2017 and 2025
Figure 44: Europe Microfluidics Market Value Share Analysis, by Country, 2017 and 2025
Figure 45: Europe Microfluidics Market Attractiveness By Product Type
Figure 46: Europe Microfluidics Market Attractiveness By Application
Figure 47: Europe Microfluidics Market Attractiveness By Material
Figure 48: Europe Microfluidics Market Attractiveness By End-user
Figure 49: Asia Pacific Microfluidics Market Size (US$ Mn) Forecast and Y-o-Y Growth (%), 2015–2025
Figure 50: Asia Pacific Microfluidics Market Attractiveness Analysis, by Country
Figure 51: Asia Pacific Microfluidics Market Value Share Analysis, by Product Type, 2017 and 2025
Figure 52: Asia Pacific Microfluidics Market Value Share Analysis, by Application, 2017 and 2025
Figure 53: Asia Pacific Microfluidics Market Value Share Analysis, by Material, 2017 and 2025
Figure 54: Asia Pacific Microfluidics Market Value Share Analysis, by End-user, 2017 and 2025
Figure 55 Asia Pacific Microfluidics Market Value Share Analysis, by Country, 2017 and 2025
Figure 56: Asia Pacific Microfluidics Market Attractiveness Analysis, By Product Type
Figure 57: Asia Pacific Microfluidics Market Attractiveness By Application
Figure 58: Asia Pacific Microfluidics Market Attractiveness By Material
Figure 59: Asia Pacific Microfluidics Market Attractiveness By End Users
Figure 60: Latin America Microfluidics Market Size (US$ Mn) Forecast and Y-o-Y Growth (%), 2015–2025
Figure 61: Latin America Microfluidics Market Attractiveness Analysis, by Country
Figure 62: Latin America Microfluidics Market Value Share Analysis, by Product Type, 2017 and 2025
Figure 63: Latin America Microfluidics Market Value Share Analysis, by Application, 2017 and 2025
Figure 64: Latin America Microfluidics Market Value Share Analysis, by Material, 2017 and 2025
Figure 65: Latin America Microfluidics Market Value Share Analysis, by End-user, 2017 and 2025
Figure 66: Latin America Microfluidics Market Value Share Analysis, by Country, 2017 and 2025
Figure 67: Latin America Microfluidics Market Attractiveness Analysis, By Product Type
Figure 68: Latin America Microfluidics Market Attractiveness Analysis, By Application Type
Figure 69: Latin America Microfluidics Market Attractiveness Analysis, By Material
Figure 70: Latin America Microfluidics Market Attractiveness Analysis, By End-user
Figure 71: MEA Microfluidics Market Size (US$ Mn) Forecast and Y-o-Y Growth (%), 2015–2025
Figure 72: MEA Microfluidics Market Attractiveness Analysis, by Country
Figure 73: Middle East & Africa Market Value Share Analysis, by Product Type, 2017 and 2025
Figure 74: Middle East & Africa Microfluidics Market Value Share Analysis, by Application, 2017 and 2025
Figure 75: Middle East & Africa Microfluidics Market Value Share Analysis, by Material, 2017 and 2025
Figure 76: Middle East & Africa Microfluidics Market Value Share Analysis, by End-user, 2017 and 2025
Figure 77: Middle East & Africa Microfluidics Market Value Share Analysis By Country, 2017 and 2025
Figure 78: Middle East and Africa Microfluidics Market Attractiveness Analysis, By Product Type
Figure 79: Middle East and Africa Microfluidics Market Attractiveness Analysis By Application
Figure 80: Middle East and Africa Microfluidics Market Attractiveness Analysis, By Material
Figure 81: Middle East and Africa Microfluidics Market Attractiveness Analysis, By End-user
Figure 82: Global Microfluidics Market Share Analysis By Company (2016)
Copyright © Transparency Market Research, Inc. All Rights reserved
Trust Online

Microfluidics Market