
Reports
Reports
Global M-Commerce Payments Market: Snapshot
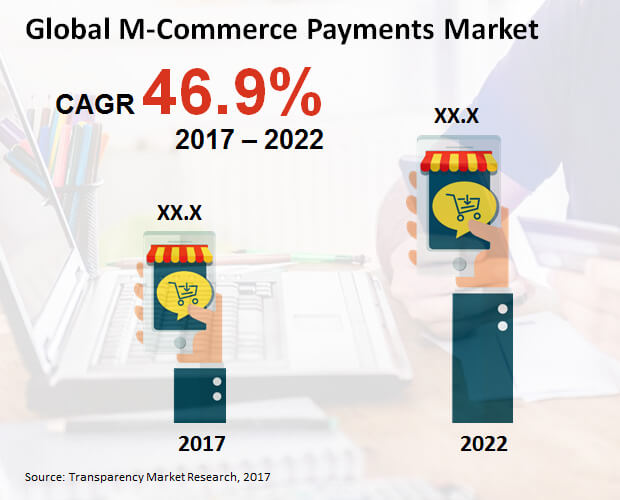
Owing to the growing ubiquity of smartphones, the prosperity of the m-commerce payments is almost certain, with the demand projected to increment at an exceptional CAGR of 46.9% during the forecast period of 2017 to 2022. Sheer ease of usability that m-commerce brings to the users is the most powerful driver of this market, although the slow adoptability has been a little hindrance. Nevertheless, a number of companies are now offering in-app payments, enhancing security of the transactions and personal details, and promoting sales via “buy button” on social media platforms. In addition to that, since m-commerce enables the merchants to analyze the buying habit of individual customer and make lucrative offers to increment sales, growing number of vendors of various fields are expected to adopt m-commerce payment methods. In terms of valuation, the revenue in the global m-commerce payments market is estimated to reach US$7.55 bn by 2022, exponentially up from its evaluated worth of merely US$1.11 bn in 2017.
Peer-to-Peer Most Preferred Mode of Payment Segment
On the basis of mode of payment, the global m-commerce payments market has been segmented into peer-to-peer transfer payments, near field communication m-commerce payments, and barcode m-commerce payments. In 2017, the peer-to-peer transfer payments segment accounted for US$2.68 bn or 45.1% of the overall demand, and by 2022, the figures are projected to reach US$4.97 bn or 46.2%, respectively. The demand for P2P transfer payments is anticipated to expand at a CAGR of 40.0%, and this absolute growth is larger than that of any other segment.
Based on end-use industry, the global m-commerce payments market has been bifurcated into retail m-commerce, hospitality and tourism, IT and telecommunication, banking, financial services and insurance (BFSI), media and entertainment, healthcare, airline, and others. Device-wise, the market for m-commerce payments has been categorized into smart devices, feature phones, and other electronic devices. On the basis of transaction, the market for m-commerce payments has been classified into mobile retailing, mobile booking or ticketing, mobile banking, mobile billing, and other modes of transactions.
Asia Pacific Projected for Most Robust Growth Rate
Geographically, the report takes stock of the potential of m-commerce payments market in the country of Japan as well as in the regions of North America, Latin America, Europe, Asia Pacific except Japan (APEJ), and the Middle East and Africa (MEA). Among these, North America constitutes the most profitable regional market for the vendors operating in the m-commerce payments market, expanding the demand at an above-average CAGR of 47.4% during the forecast period of 2017 to 2022. In terms of revenue, the North America m-commerce payments market is estimated to be worth US$2.47 bn by 2022. High adoptability of new technology, ubiquity of electronic devices, healthy e-commerce sector, and greater buying power of the citizens of developed countries such as the U.S. and Canada are some of the factors favoring the North America m-commerce payments market.
While Europe currently is the second most lucrative region in the m-commerce payments market, and is projected to increment the demand at a healthy CAGR of 44.0%, the APEJ region is anticipated to exhibit the most promising growth rate of 51.4% during the forecast period of 2017 to 2022. India and China are two of the world’s most populous countries and governments in both these countries are pushing for cashless transactions in order to maintain parity. Various merchants in these APEJ countries are adopting new technology and are experiencing increased sales. The m-commerce payments market valuation of this region is estimated to reach US$ 189,506.4 mn by 2022.
Apple Inc., Alphabet Inc., Mastercard Incorporated, ACI Worldwide, Inc., DH Corporation, Fidelity National Information Services, Inc., Fiserv, Inc., Paypal Holdings, Inc., Square, Inc., Visa, Inc., Jack Henry & Associates Inc., and Samsung Electronics Company Limited are some of the key companies currently operating in the global m-commerce payments market.
1. Global M-Commerce Payments Market - Executive Summary
2. Global M-Commerce Payments Market Overview
2.1. Introduction
2.1.1. Global M-Commerce Payments Market Taxonomy
2.1.2. Global M-Commerce Payments Market Definition
2.2. Global M-Commerce Payments Market Size (US$ Mn) and Forecast, 2012-2022
2.2.1. Global M-Commerce Payments Market Y-o-Y Growth
2.3. Global M-Commerce Payments Market Dynamics
2.3.1. Drivers
2.3.2. Restraints
2.3.3. Trends
2.4. Supply Chain
2.5. Cost Structure
2.6. Pricing Analysis
2.7. Raw Material Sourcing Strategy and Analysis
2.8. List of Distributors
2.9. Key Participants Market Presence (Intensity Map) By Region
3. Global M-Commerce Payments Market Analysis and Forecast By Mode of Payment
3.1. Global M-Commerce Payments Market Size and Forecast By Mode of Payment, 2012-2022
3.1.1. Peer-to-peer transfer M-Commerce Payments Market Size and Forecast, 2012-2022
3.1.1.1. Revenue (US$ Mn) Comparison, By Region
3.1.1.2. Market Share Comparison, By Region
3.1.1.3. Y-o-Y growth Comparison, By Region
3.1.2. Near Field Communication M-Commerce Payments Market Size and Forecast, 2012-2022
3.1.2.1. Revenue (US$ Mn) Comparison, By Region
3.1.2.2. Market Share Comparison, By Region
3.1.2.3. Y-o-Y growth Comparison, By Region
3.1.3. Barcode M-Commerce Payments Market Size and Forecast, 2012-2022
3.1.3.1. Revenue (US$ Mn) Comparison, By Region
3.1.3.2. Market Share Comparison, By Region
3.1.3.3. Y-o-Y growth Comparison, By Region
4. Global M-Commerce Payments Market Analysis and Forecast By End-use Industry
4.1. Global M-Commerce Payments Market Size and Forecast By End-use Industry, 2012-2022
4.1.1. Retail M-Commerce Payments Market Size and Forecast, 2012-2022
4.1.1.1. Revenue (US$ Mn) Comparison, By Region
4.1.1.2. Market Share Comparison, By Region
4.1.1.3. Y-o-Y growth Comparison, By Region
4.1.2. Hospitality & Tourism M-Commerce Payments Market Size and Forecast, 2012-2022
4.1.2.1. Revenue (US$ Mn) Comparison, By Region
4.1.2.2. Market Share Comparison, By Region
4.1.2.3. Y-o-Y growth Comparison, By Region
4.1.3. IT & Telecommunication M-Commerce Payments Market Size and Forecast, 2012-2022
4.1.3.1. Revenue (US$ Mn) Comparison, By Region
4.1.3.2. Market Share Comparison, By Region
4.1.3.3. Y-o-Y growth Comparison, By Region
4.1.4. BFSI M-Commerce Payments Market Size and Forecast, 2012-2022
4.1.4.1. Revenue (US$ Mn) Comparison, By Region
4.1.4.2. Market Share Comparison, By Region
4.1.4.3. Y-o-Y growth Comparison, By Region
4.1.5. Media & Entertainment M-Commerce Payments Market Size and Forecast, 2012-2022
4.1.5.1. Revenue (US$ Mn) Comparison, By Region
4.1.5.2. Market Share Comparison, By Region
4.1.5.3. Y-o-Y growth Comparison, By Region
4.1.6. Healthcare M-Commerce Payments Market Size and Forecast, 2012-2022
4.1.6.1. Revenue (US$ Mn) Comparison, By Region
4.1.6.2. Market Share Comparison, By Region
4.1.6.3. Y-o-Y growth Comparison, By Region
4.1.7. Airline M-Commerce Payments Market Size and Forecast, 2012-2022
4.1.7.1. Revenue (US$ Mn) Comparison, By Region
4.1.7.2. Market Share Comparison, By Region
4.1.7.3. Y-o-Y growth Comparison, By Region
4.1.8. Other Industries M-Commerce Payments Market Size and Forecast, 2012-2022
4.1.8.1. Revenue (US$ Mn) Comparison, By Region
4.1.8.2. Market Share Comparison, By Region
4.1.8.3. Y-o-Y growth Comparison, By Region
5. Global M-Commerce Payments Market Analysis and Forecast By Devices
5.1. Global M-Commerce Payments Market Size and Forecast By Devices, 2012-2022
5.1.1. Smart Devices M-Commerce Payments Market Size and Forecast, 2012-2022
5.1.1.1. Revenue (US$ Mn) Comparison, By Region
5.1.1.2. Market Share Comparison, By Region
5.1.1.3. Y-o-Y growth Comparison, By Region
5.1.2. Feature Phones M-Commerce Payments Market Size and Forecast, 2012-2022
5.1.2.1. Revenue (US$ Mn) Comparison, By Region
5.1.2.2. Market Share Comparison, By Region
5.1.2.3. Y-o-Y growth Comparison, By Region
5.1.3. Other Devices M-Commerce Payments Market Size and Forecast, 2012-2022
5.1.3.1. Revenue (US$ Mn) Comparison, By Region
5.1.3.2. Market Share Comparison, By Region
5.1.3.3. Y-o-Y growth Comparison, By Region
6. Global M-Commerce Payments Market Analysis and Forecast By Mode of Transaction
6.1. Global M-Commerce Payments Market Size and Forecast By Mode of Transaction, 2012-2022
6.1.1. Mobile Retailing M-Commerce Payments Market Size and Forecast, 2012-2022
6.1.1.1. Revenue (US$ Mn) Comparison, By Region
6.1.1.2. Market Share Comparison, By Region
6.1.1.3. Y-o-Y growth Comparison, By Region
6.1.2. Mobile Booking/ Ticketing M-Commerce Payments Market Size and Forecast, 2012-2022
6.1.2.1. Revenue (US$ Mn) Comparison, By Region
6.1.2.2. Market Share Comparison, By Region
6.1.2.3. Y-o-Y growth Comparison, By Region
6.1.3. Mobile Banking M-Commerce Payments Market Size and Forecast, 2012-2022
6.1.3.1. Revenue (US$ Mn) Comparison, By Region
6.1.3.2. Market Share Comparison, By Region
6.1.3.3. Y-o-Y growth Comparison, By Region
6.1.4. Mobile Billing M-Commerce Payments Market Size and Forecast, 2012-2022
6.1.4.1. Revenue (US$ Mn) Comparison, By Region
6.1.4.2. Market Share Comparison, By Region
6.1.4.3. Y-o-Y growth Comparison, By Region
6.1.5. Other Mode of Transaction M-Commerce Payments Market Size and Forecast, 2012-2022
6.1.5.1. Revenue (US$ Mn) Comparison, By Region
6.1.5.2. Market Share Comparison, By Region
6.1.5.3. Y-o-Y growth Comparison, By Region
7. Global M-Commerce Payments Market Analysis and Forecast By Region
7.1. Global M-Commerce Payments Market Size and Forecast, 2012-2022
7.1.1. North America M-Commerce Payments Market Size and Forecast, 2012-2022
7.1.1.1. Revenue (US$ Mn) Comparison, By Mode of Payment
7.1.1.2. Revenue (US$ Mn) Comparison, By End-use Industry
7.1.1.3. Revenue (US$ Mn) Comparison, By Devices
7.1.1.4. Revenue (US$ Mn) Comparison, By Mode of Transaction
7.1.2. Latin America M-Commerce Payments Market Size and Forecast, 2012-2022
7.1.2.1. Revenue (US$ Mn) Comparison, By Mode of Payment
7.1.2.2. Revenue (US$ Mn) Comparison, By End-use Industry
7.1.2.3. Revenue (US$ Mn) Comparison, By Devices
7.1.2.4. Revenue (US$ Mn) Comparison, By Mode of Transaction
7.1.3. Europe M-Commerce Payments Market Size and Forecast, 2012-2022
7.1.3.1. Revenue (US$ Mn) Comparison, By Mode of Payment
7.1.3.2. Revenue (US$ Mn) Comparison, By End-use Industry
7.1.3.3. Revenue (US$ Mn) Comparison, By Devices
7.1.3.4. Revenue (US$ Mn) Comparison, By Mode of Transaction
7.1.4. Japan M-Commerce Payments Market Size and Forecast, 2012-2022
7.1.4.1. Revenue (US$ Mn) Comparison, By Mode of Payment
7.1.4.2. Revenue (US$ Mn) Comparison, By End-use Industry
7.1.4.3. Revenue (US$ Mn) Comparison, By Devices
7.1.4.4. Revenue (US$ Mn) Comparison, By Mode of Transaction
7.1.5. APEJ M-Commerce Payments Market Size and Forecast, 2012-2022
7.1.5.1. Revenue (US$ Mn) Comparison, By Mode of Payment
7.1.5.2. Revenue (US$ Mn) Comparison, By End-use Industry
7.1.5.3. Revenue (US$ Mn) Comparison, By Devices
7.1.5.4. Revenue (US$ Mn) Comparison, By Mode of Transaction
7.1.6. MEA M-Commerce Payments Market Size and Forecast, 2012-2022
7.1.6.1. Revenue (US$ Mn) Comparison, By Mode of Payment
7.1.6.2. Revenue (US$ Mn) Comparison, By End-use Industry
7.1.6.3. Revenue (US$ Mn) Comparison, By Devices
7.1.6.4. Revenue (US$ Mn) Comparison, By Mode of Transaction
8. North America M-Commerce Payments Market Analysis and Forecast, By Country, 2012-2022
8.1. US M-Commerce Payments Market Size and Forecast, 2012-2022
8.1.1. Revenue (US$ Mn) Comparison, By Mode of Payment
8.1.2. Revenue (US$ Mn) Comparison, By End-use Industry
8.1.3. Revenue (US$ Mn) Comparison, By Devices
8.1.4. Revenue (US$ Mn) Comparison, By Mode of Transaction
8.2. Canada M-Commerce Payments Market Size and Forecast, 2012-2022
8.2.1. Revenue (US$ Mn) Comparison, By Mode of Payment
8.2.2. Revenue (US$ Mn) Comparison, By End-use Industry
8.2.3. Revenue (US$ Mn) Comparison, By Devices
8.2.4. Revenue (US$ Mn) Comparison, By Mode of Transaction
9. Latin America M-Commerce Payments Market Analysis and Forecast, By Country, 2012-2022
9.1. Brazil M-Commerce Payments Market Size and Forecast, 2012-2022
9.1.1. Revenue (US$ Mn) Comparison, By Mode of Payment
9.1.2. Revenue (US$ Mn) Comparison, By End-use Industry
9.1.3. Revenue (US$ Mn) Comparison, By Devices
9.1.4. Revenue (US$ Mn) Comparison, By Mode of Transaction
9.2. Mexico M-Commerce Payments Market Size and Forecast, 2012-2022
9.2.1. Revenue (US$ Mn) Comparison, By Mode of Payment
9.2.2. Revenue (US$ Mn) Comparison, By End-use Industry
9.2.3. Revenue (US$ Mn) Comparison, By Devices
9.2.4. Revenue (US$ Mn) Comparison, By Mode of Transaction
9.3. Argentina M-Commerce Payments Market Size and Forecast, 2012-2022
9.3.1. Revenue (US$ Mn) Comparison, By Mode of Payment
9.3.2. Revenue (US$ Mn) Comparison, By End-use Industry
9.3.3. Revenue (US$ Mn) Comparison, By Devices
9.3.4. Revenue (US$ Mn) Comparison, By Mode of Transaction
10. Europe M-Commerce Payments Market Analysis and Forecast, By Country, 2012-2022
10.1. Germany M-Commerce Payments Market Size and Forecast, 2012-2022
10.1.1. Revenue (US$ Mn) Comparison, By Mode of Payment
10.1.2. Revenue (US$ Mn) Comparison, By End-use Industry
10.1.3. Revenue (US$ Mn) Comparison, By Devices
10.1.4. Revenue (US$ Mn) Comparison, By Mode of Transaction
10.2. UK M-Commerce Payments Market Size and Forecast, 2012-2022
10.2.1. Revenue (US$ Mn) Comparison, By Mode of Payment
10.2.2. Revenue (US$ Mn) Comparison, By End-use Industry
10.2.3. Revenue (US$ Mn) Comparison, By Devices
10.2.4. Revenue (US$ Mn) Comparison, By Mode of Transaction
10.3. France M-Commerce Payments Market Size and Forecast, 2012-2022
10.3.1. Revenue (US$ Mn) Comparison, By Mode of Payment
10.3.2. Revenue (US$ Mn) Comparison, By End-use Industry
10.3.3. Revenue (US$ Mn) Comparison, By Devices
10.3.4. Revenue (US$ Mn) Comparison, By Mode of Transaction
10.4. Spain M-Commerce Payments Market Size and Forecast, 2012-2022
10.4.1. Revenue (US$ Mn) Comparison, By Mode of Payment
10.4.2. Revenue (US$ Mn) Comparison, By End-use Industry
10.4.3. Revenue (US$ Mn) Comparison, By Devices
10.4.4. Revenue (US$ Mn) Comparison, By Mode of Transaction
10.5. Italy M-Commerce Payments Market Size and Forecast, 2012-2022
10.5.1. Revenue (US$ Mn) Comparison, By Mode of Payment
10.5.2. Revenue (US$ Mn) Comparison, By End-use Industry
10.5.3. Revenue (US$ Mn) Comparison, By Devices
10.5.4. Revenue (US$ Mn) Comparison, By Mode of Transaction
10.6. Nordic M-Commerce Payments Market Size and Forecast, 2012-2022
10.6.1. Revenue (US$ Mn) Comparison, By Mode of Payment
10.6.2. Revenue (US$ Mn) Comparison, By End-use Industry
10.6.3. Revenue (US$ Mn) Comparison, By Devices
10.6.4. Revenue (US$ Mn) Comparison, By Mode of Transaction
11. Japan M-Commerce Payments Market Analysis and Forecast, By Country, 2012-2022
11.1. Japan M-Commerce Payments Market Size and Forecast, 2012-2022
11.1.1. Revenue (US$ Mn) Comparison, By Mode of Payment
11.1.2. Revenue (US$ Mn) Comparison, By End-use Industry
11.1.3. Revenue (US$ Mn) Comparison, By Devices
11.1.4. Revenue (US$ Mn) Comparison, By Mode of Transaction
12. APEJ M-Commerce Payments Market Analysis and Forecast, By Country, 2012-2022
12.1. China M-Commerce Payments Market Size and Forecast, 2012-2022
12.1.1. Revenue (US$ Mn) Comparison, By Mode of Payment
12.1.2. Revenue (US$ Mn) Comparison, By End-use Industry
12.1.3. Revenue (US$ Mn) Comparison, By Devices
12.1.4. Revenue (US$ Mn) Comparison, By Mode of Transaction
12.2. India M-Commerce Payments Market Size and Forecast, 2012-2022
12.2.1. Revenue (US$ Mn) Comparison, By Mode of Payment
12.2.2. Revenue (US$ Mn) Comparison, By End-use Industry
12.2.3. Revenue (US$ Mn) Comparison, By Devices
12.2.4. Revenue (US$ Mn) Comparison, By Mode of Transaction
12.3. Malaysia M-Commerce Payments Market Size and Forecast, 2012-2022
12.3.1. Revenue (US$ Mn) Comparison, By Mode of Payment
12.3.2. Revenue (US$ Mn) Comparison, By End-use Industry
12.3.3. Revenue (US$ Mn) Comparison, By Devices
12.3.4. Revenue (US$ Mn) Comparison, By Mode of Transaction
12.4. Thailand M-Commerce Payments Market Size and Forecast, 2012-2022
12.4.1. Revenue (US$ Mn) Comparison, By Mode of Payment
12.4.2. Revenue (US$ Mn) Comparison, By End-use Industry
12.4.3. Revenue (US$ Mn) Comparison, By Devices
12.4.4. Revenue (US$ Mn) Comparison, By Mode of Transaction
12.5. Singapore M-Commerce Payments Market Size and Forecast, 2012-2022
12.5.1. Revenue (US$ Mn) Comparison, By Mode of Payment
12.5.2. Revenue (US$ Mn) Comparison, By End-use Industry
12.5.3. Revenue (US$ Mn) Comparison, By Devices
12.5.4. Revenue (US$ Mn) Comparison, By Mode of Transaction
12.6. Australia M-Commerce Payments Market Size and Forecast, 2012-2022
12.6.1. Revenue (US$ Mn) Comparison, By Mode of Payment
12.6.2. Revenue (US$ Mn) Comparison, By End-use Industry
12.6.3. Revenue (US$ Mn) Comparison, By Devices
12.6.4. Revenue (US$ Mn) Comparison, By Mode of Transaction
13. MEA M-Commerce Payments Market Analysis and Forecast, By Country, 2012-2022
13.1. GCC Countries M-Commerce Payments Market Size and Forecast, 2012-2022
13.1.1. Revenue (US$ Mn) Comparison, By Mode of Payment
13.1.2. Revenue (US$ Mn) Comparison, By End-use Industry
13.1.3. Revenue (US$ Mn) Comparison, By Devices
13.1.4. Revenue (US$ Mn) Comparison, By Mode of Transaction
13.2. South Africa M-Commerce Payments Market Size and Forecast, 2012-2022
13.2.1. Revenue (US$ Mn) Comparison, By Mode of Payment
13.2.2. Revenue (US$ Mn) Comparison, By End-use Industry
13.2.3. Revenue (US$ Mn) Comparison, By Devices
13.2.4. Revenue (US$ Mn) Comparison, By Mode of Transaction
13.3. Nigeria M-Commerce Payments Market Size and Forecast, 2012-2022
13.3.1. Revenue (US$ Mn) Comparison, By Mode of Payment
13.3.2. Revenue (US$ Mn) Comparison, By End-use Industry
13.3.3. Revenue (US$ Mn) Comparison, By Devices
13.3.4. Revenue (US$ Mn) Comparison, By Mode of Transaction
13.4. Israel M-Commerce Payments Market Size and Forecast, 2012-2022
13.4.1. Revenue (US$ Mn) Comparison, By Mode of Payment
13.4.2. Revenue (US$ Mn) Comparison, By End-use Industry
13.4.3. Revenue (US$ Mn) Comparison, By Devices
13.4.4. Revenue (US$ Mn) Comparison, By Mode of Transaction
14. Global M-Commerce Payments Market Competition Landscape and Company Profile
14.1. Company Share Analysis By Region
14.2. ACI Wrldwide, Inc.
14.2.1. Company Overview
14.2.2. M-Commerce Payments Market Mode of Payment list
14.2.3. M-Commerce Payments Market Mode of Payment Sales Data and Key Financials
14.2.4. Key Developments
14.2.5. SWOT Analysis
14.3. Alphabet Inc
14.3.1. Company Overview
14.3.2. M-Commerce Payments Market Mode of Payment list
14.3.3. M-Commerce Payments Market Mode of Payment Sales Data and Key Financials
14.3.4. Key Developments
14.3.5. SWOT Analysis
14.4. Apple Inc
14.4.1. Company Overview
14.4.2. M-Commerce Payments Market Mode of Payment list
14.4.3. M-Commerce Payments Market Mode of Payment Sales Data and Key Financials
14.4.4. Key Developments
14.4.5. SWOT Analysis
14.5. DH Corporation
14.5.1. Company Overview
14.5.2. M-Commerce Payments Market Mode of Payment list
14.5.3. M-Commerce Payments Market Mode of Payment Sales Data and Key Financials
14.5.4. Key Developments
14.5.5. SWOT Analysis
14.6. Fidelity National Information Services, Inc.
14.6.1. Company Overview
14.6.2. M-Commerce Payments Market Mode of Payment list
14.6.3. M-Commerce Payments Market Mode of Payment Sales Data and Key Financials
14.6.4. Key Developments
14.6.5. SWOT Analysis
14.7. Fiserv, Inc.
14.7.1. Company Overview
14.7.2. M-Commerce Payments Market Mode of Payment list
14.7.3. M-Commerce Payments Market Mode of Payment Sales Data and Key Financials
14.7.4. Key Developments
14.7.5. SWOT Analysis
14.8. Jack Henry & Associates Inc.
14.8.1. Company Overview
14.8.2. M-Commerce Payments Market Mode of Payment list
14.8.3. M-Commerce Payments Market Mode of Payment Sales Data and Key Financials
14.8.4. Key Developments
14.8.5. SWOT Analysis
14.9. Mastercard Incorporated
14.9.1. Company Overview
14.9.2. M-Commerce Payments Market Mode of Payment list
14.9.3. M-Commerce Payments Market Mode of Payment Sales Data and Key Financials
14.9.4. Key Developments
14.9.5. SWOT Analysis
14.10. Paypal Holdings, Inc.
14.10.1. Company Overview
14.10.2. M-Commerce Payments Market Mode of Payment list
14.10.3. M-Commerce Payments Market Mode of Payment Sales Data and Key Financials
14.10.4. Key Developments
14.10.5. SWOT Analysis
14.11. Square, Inc
14.11.1. Company Overview
14.11.2. M-Commerce Payments Market Mode of Payment list
14.11.3. M-Commerce Payments Market Mode of Payment Sales Data and Key Financials
14.11.4. Key Developments
14.11.5. SWOT Analysis
14.12. Visa, Inc
14.12.1. Company Overview
14.12.2. M-Commerce Payments Market Mode of Payment list
14.12.3. M-Commerce Payments Market Mode of Payment Sales Data and Key Financials
14.12.4. Key Developments
14.12.5. SWOT Analysis
14.13. Samsung Electronics Company Limited
14.13.1. Company Overview
14.13.2. M-Commerce Payments Market Mode of Payment list
14.13.3. M-Commerce Payments Market Mode of Payment Sales Data and Key Financials
14.13.4. Key Developments
14.13.5. SWOT Analysis
15. Research Methodology
16. Secondary and Primary Sources
17. Assumptions and Acronyms
18. Disclaimer
List of Tables
TABLE 1 Global M-Commerce Payments Market Value (US$ Mn), 2012-2016
TABLE 2 Global M-Commerce Payments Market Value (US$ Mn), 2017-2022
TABLE 3 Global M-Commerce Payments Market Value (US$ Mn) and Y-o-Y, 2015-2022
TABLE 4 Global Peer-to-peer transfer Segment Value (US$ Mn), By Region 2012-2016
TABLE 5 Global Peer-to-peer transfer Segment Value (US$ Mn), By Region 2017-2022
TABLE 6 Global Peer-to-peer transfer Segment Market Share, By Region 2012-2016
TABLE 7 Global Peer-to-peer transfer Segment Market Share, By Region 2017-2022
TABLE 8 Global Peer-to-peer transfer Segment Y-o-Y, By Region 2015-2022
TABLE 9 Global Near Field Communication Segment Value (US$ Mn), By Region 2012-2016
TABLE 10 Global Near Field Communication Segment Value (US$ Mn), By Region 2017-2022
TABLE 11 Global Near Field Communication Segment Market Share, By Region 2012-2016
TABLE 12 Global Near Field Communication Segment Market Share, By Region 2017-2022
TABLE 13 Global Near Field Communication Segment Y-o-Y, By Region 2015-2022
TABLE 14 Global Barcode Segment Value (US$ Mn), By Region 2012-2016
TABLE 15 Global Barcode Segment Value (US$ Mn), By Region 2017-2022
TABLE 16 Global Barcode Segment Market Share, By Region 2012-2016
TABLE 17 Global Barcode Segment Market Share, By Region 2017-2022
TABLE 18 Global Barcode Segment Y-o-Y, By Region 2015-2022
TABLE 19 Global Retail Segment Value (US$ Mn), By Region 2012-2016
TABLE 20 Global Retail Segment Value (US$ Mn), By Region 2017-2022
TABLE 21 Global Retail Segment Market Share, By Region 2012-2016
TABLE 22 Global Retail Segment Market Share, By Region 2017-2022
TABLE 23 Global Retail Segment Y-o-Y, By Region 2015-2022
TABLE 24 Global Hospitality & Tourism Segment Value (US$ Mn), By Region 2012-2016
TABLE 25 Global Hospitality & Tourism Segment Value (US$ Mn), By Region 2017-2022
TABLE 26 Global Hospitality & Tourism Segment Market Share, By Region 2012-2016
TABLE 27 Global Hospitality & Tourism Segment Market Share, By Region 2017-2022
TABLE 28 Global Hospitality & Tourism Segment Y-o-Y, By Region 2015-2022
TABLE 29 Global IT & Telecommunication Segment Value (US$ Mn), By Region 2012-2016
TABLE 30 Global IT & Telecommunication Segment Value (US$ Mn), By Region 2017-2022
TABLE 31 Global IT & Telecommunication Segment Market Share, By Region 2012-2016
TABLE 32 Global IT & Telecommunication Segment Market Share, By Region 2017-2022
TABLE 33 Global IT & Telecommunication Segment Y-o-Y, By Region 2015-2022
TABLE 34 Global BFSI Segment Value (US$ Mn), By Region 2012-2016
TABLE 35 Global BFSI Segment Value (US$ Mn), By Region 2017-2022
TABLE 36 Global BFSI Segment Market Share, By Region 2012-2016
TABLE 37 Global BFSI Segment Market Share, By Region 2017-2022
TABLE 38 Global BFSI Segment Y-o-Y, By Region 2015-2022
TABLE 39 Global Media & Entertainment Segment Value (US$ Mn), By Region 2012-2016
TABLE 40 Global Media & Entertainment Segment Value (US$ Mn), By Region 2017-2022
TABLE 41 Global Media & Entertainment Segment Market Share, By Region 2012-2016
TABLE 42 Global Media & Entertainment Segment Market Share, By Region 2017-2022
TABLE 43 Global Media & Entertainment Segment Y-o-Y, By Region 2015-2022
TABLE 44 Global Healthcare Segment Value (US$ Mn), By Region 2012-2016
TABLE 45 Global Healthcare Segment Value (US$ Mn), By Region 2017-2022
TABLE 46 Global Healthcare Segment Market Share, By Region 2012-2016
TABLE 47 Global Healthcare Segment Market Share, By Region 2017-2022
TABLE 48 Global Healthcare Segment Y-o-Y, By Region 2015-2022
TABLE 49 Global Airline Segment Value (US$ Mn), By Region 2012-2016
TABLE 50 Global Airline Segment Value (US$ Mn), By Region 2017-2022
TABLE 51 Global Airline Segment Market Share, By Region 2012-2016
TABLE 52 Global Airline Segment Market Share, By Region 2017-2022
TABLE 53 Global Airline Segment Y-o-Y, By Region 2015-2022
TABLE 54 Global Other Industries Segment Value (US$ Mn), By Region 2012-2016
TABLE 55 Global Other Industries Segment Value (US$ Mn), By Region 2017-2022
TABLE 56 Global Other Industries Segment Market Share, By Region 2012-2016
TABLE 57 Global Other Industries Segment Market Share, By Region 2017-2022
TABLE 58 Global Other Industries Segment Y-o-Y, By Region 2015-2022
TABLE 59 Global Smart Devices Segment Value (US$ Mn), By Region 2012-2016
TABLE 60 Global Smart Devices Segment Value (US$ Mn), By Region 2017-2022
TABLE 61 Global Smart Devices Segment Market Share, By Region 2012-2016
TABLE 62 Global Smart Devices Segment Market Share, By Region 2017-2022
TABLE 63 Global Smart Devices Segment Y-o-Y, By Region 2015-2022
TABLE 64 Global Feature Phones Segment Value (US$ Mn), By Region 2012-2016
TABLE 65 Global Feature Phones Segment Value (US$ Mn), By Region 2017-2022
TABLE 66 Global Feature Phones Segment Market Share, By Region 2012-2016
TABLE 67 Global Feature Phones Segment Market Share, By Region 2017-2022
TABLE 68 Global Feature Phones Segment Y-o-Y, By Region 2015-2022
TABLE 69 Global Other Devices Segment Value (US$ Mn), By Region 2012-2016
TABLE 70 Global Other Devices Segment Value (US$ Mn), By Region 2017-2022
TABLE 71 Global Other Devices Segment Market Share, By Region 2012-2016
TABLE 72 Global Other Devices Segment Market Share, By Region 2017-2022
TABLE 73 Global Other Devices Segment Y-o-Y, By Region 2015-2022
TABLE 74 Global Mobile Retailing Segment Value (US$ Mn), By Region 2012-2016
TABLE 75 Global Mobile Retailing Segment Value (US$ Mn), By Region 2017-2022
TABLE 76 Global Mobile Retailing Segment Market Share, By Region 2012-2016
TABLE 77 Global Mobile Retailing Segment Market Share, By Region 2017-2022
TABLE 78 Global Mobile Retailing Segment Y-o-Y, By Region 2015-2022
TABLE 79 Global Mobile Booking/ Ticketing Segment Value (US$ Mn), By Region 2012-2016
TABLE 80 Global Mobile Booking/ Ticketing Segment Value (US$ Mn), By Region 2017-2022
TABLE 81 Global Mobile Booking/ Ticketing Segment Market Share, By Region 2012-2016
TABLE 82 Global Mobile Booking/ Ticketing Segment Market Share, By Region 2017-2022
TABLE 83 Global Mobile Booking/ Ticketing Segment Y-o-Y, By Region 2015-2022
TABLE 84 Global Mobile Banking Segment Value (US$ Mn), By Region 2012-2016
TABLE 85 Global Mobile Banking Segment Value (US$ Mn), By Region 2017-2022
TABLE 86 Global Mobile Banking Segment Market Share, By Region 2012-2016
TABLE 87 Global Mobile Banking Segment Market Share, By Region 2017-2022
TABLE 88 Global Mobile Banking Segment Y-o-Y, By Region 2015-2022
TABLE 89 Global Mobile Billing Segment Value (US$ Mn), By Region 2012-2016
TABLE 90 Global Mobile Billing Segment Value (US$ Mn), By Region 2017-2022
TABLE 91 Global Mobile Billing Segment Market Share, By Region 2012-2016
TABLE 92 Global Mobile Billing Segment Market Share, By Region 2017-2022
TABLE 93 Global Mobile Billing Segment Y-o-Y, By Region 2015-2022
TABLE 94 Global Other Mode of Transaction Segment Value (US$ Mn), By Region 2012-2016
TABLE 95 Global Other Mode of Transaction Segment Value (US$ Mn), By Region 2017-2022
TABLE 96 Global Other Mode of Transaction Segment Market Share, By Region 2012-2016
TABLE 97 Global Other Mode of Transaction Segment Market Share, By Region 2017-2022
TABLE 98 Global Other Mode of Transaction Segment Y-o-Y, By Region 2015-2022
TABLE 99 North America M-Commerce Payments Market Value (US$ Mn), By Mode of Payment 2012-2016
TABLE 100 North America M-Commerce Payments Market Value (US$ Mn), By Mode of Payment 2017-2022
TABLE 101 North America M-Commerce Payments Market Value (US$ Mn), By End-use Industry 2012-2016
TABLE 102 North America M-Commerce Payments Market Value (US$ Mn), By End-use Industry 2017-2022
TABLE 103 North America M-Commerce Payments Market Value (US$ Mn), By Devices 2012-2016
TABLE 104 North America M-Commerce Payments Market Value (US$ Mn), By Devices 2017-2022
TABLE 105 North America M-Commerce Payments Market Value (US$ Mn), By Mode of Transaction 2012-2016
TABLE 106 North America M-Commerce Payments Market Value (US$ Mn), By Mode of Transaction 2017-2022
TABLE 107 Latin America M-Commerce Payments Market Value (US$ Mn), By Mode of Payment 2012-2016
TABLE 108 Latin America M-Commerce Payments Market Value (US$ Mn), By Mode of Payment 2017-2022
TABLE 109 Latin America M-Commerce Payments Market Value (US$ Mn), By End-use Industry 2012-2016
TABLE 110 Latin America M-Commerce Payments Market Value (US$ Mn), By End-use Industry 2017-2022
TABLE 111 Latin America M-Commerce Payments Market Value (US$ Mn), By Devices 2012-2016
TABLE 112 Latin America M-Commerce Payments Market Value (US$ Mn), By Devices 2017-2022
TABLE 113 Latin America M-Commerce Payments Market Value (US$ Mn), By Mode of Transaction 2012-2016
TABLE 114 Latin America M-Commerce Payments Market Value (US$ Mn), By Mode of Transaction 2017-2022
TABLE 115 Europe M-Commerce Payments Market Value (US$ Mn), By Mode of Payment 2012-2016
TABLE 116 Europe M-Commerce Payments Market Value (US$ Mn), By Mode of Payment 2017-2022
TABLE 117 Europe M-Commerce Payments Market Value (US$ Mn), By End-use Industry 2012-2016
TABLE 118 Europe M-Commerce Payments Market Value (US$ Mn), By End-use Industry 2017-2022
TABLE 119 Europe M-Commerce Payments Market Value (US$ Mn), By Devices 2012-2016
TABLE 120 Europe M-Commerce Payments Market Value (US$ Mn), By Devices 2017-2022
TABLE 121 Europe M-Commerce Payments Market Value (US$ Mn), By Mode of Transaction 2012-2016
TABLE 122 Europe M-Commerce Payments Market Value (US$ Mn), By Mode of Transaction 2017-2022
TABLE 123 Japan M-Commerce Payments Market Value (US$ Mn), By Mode of Payment 2012-2016
TABLE 124 Japan M-Commerce Payments Market Value (US$ Mn), By Mode of Payment 2017-2022
TABLE 125 Japan M-Commerce Payments Market Value (US$ Mn), By End-use Industry 2012-2016
TABLE 126 Japan M-Commerce Payments Market Value (US$ Mn), By End-use Industry 2017-2022
TABLE 127 Japan M-Commerce Payments Market Value (US$ Mn), By Devices 2012-2016
TABLE 128 Japan M-Commerce Payments Market Value (US$ Mn), By Devices 2017-2022
TABLE 129 Japan M-Commerce Payments Market Value (US$ Mn), By Mode of Transaction 2012-2016
TABLE 130 Japan M-Commerce Payments Market Value (US$ Mn), By Mode of Transaction 2017-2022
TABLE 131 APEJ M-Commerce Payments Market Value (US$ Mn), By Mode of Payment 2012-2016
TABLE 132 APEJ M-Commerce Payments Market Value (US$ Mn), By Mode of Payment 2017-2022
TABLE 133 APEJ M-Commerce Payments Market Value (US$ Mn), By End-use Industry 2012-2016
TABLE 134 APEJ M-Commerce Payments Market Value (US$ Mn), By End-use Industry 2017-2022
TABLE 135 APEJ M-Commerce Payments Market Value (US$ Mn), By Devices 2012-2016
TABLE 136 APEJ M-Commerce Payments Market Value (US$ Mn), By Devices 2017-2022
TABLE 137 APEJ M-Commerce Payments Market Value (US$ Mn), By Mode of Transaction 2012-2016
TABLE 138 APEJ M-Commerce Payments Market Value (US$ Mn), By Mode of Transaction 2017-2022
TABLE 139 MEA M-Commerce Payments Market Value (US$ Mn), By Mode of Payment 2012-2016
TABLE 140 MEA M-Commerce Payments Market Value (US$ Mn), By Mode of Payment 2017-2022
TABLE 141 MEA M-Commerce Payments Market Value (US$ Mn), By End-use Industry 2012-2016
TABLE 142 MEA M-Commerce Payments Market Value (US$ Mn), By End-use Industry 2017-2022
TABLE 143 MEA M-Commerce Payments Market Value (US$ Mn), By Devices 2012-2016
TABLE 144 MEA M-Commerce Payments Market Value (US$ Mn), By Devices 2017-2022
TABLE 145 MEA M-Commerce Payments Market Value (US$ Mn), By Mode of Transaction 2012-2016
TABLE 146 MEA M-Commerce Payments Market Value (US$ Mn), By Mode of Transaction 2017-2022
TABLE 147 US M-Commerce Payments Market Value (US$ Mn), By Mode of Payment 2012-2016
TABLE 148 US M-Commerce Payments Market Value (US$ Mn), By Mode of Payment 2017-2022
TABLE 149 US M-Commerce Payments Market Value (US$ Mn), By End-use Industry 2012-2016
TABLE 150 US M-Commerce Payments Market Value (US$ Mn), By End-use Industry 2017-2022
TABLE 151 US M-Commerce Payments Market Value (US$ Mn), By Devices 2012-2016
TABLE 152 US M-Commerce Payments Market Value (US$ Mn), By Devices 2017-2022
TABLE 153 US M-Commerce Payments Market Value (US$ Mn), By Mode of Transaction 2012-2016
TABLE 154 US M-Commerce Payments Market Value (US$ Mn), By Mode of Transaction 2017-2022
TABLE 155 Canada M-Commerce Payments Market Value (US$ Mn), By Mode of Payment 2012-2016
TABLE 156 Canada M-Commerce Payments Market Value (US$ Mn), By Mode of Payment 2017-2022
TABLE 157 Canada M-Commerce Payments Market Value (US$ Mn), By End-use Industry 2012-2016
TABLE 158 Canada M-Commerce Payments Market Value (US$ Mn), By End-use Industry 2017-2022
TABLE 159 Canada M-Commerce Payments Market Value (US$ Mn), By Devices 2012-2016
TABLE 160 Canada M-Commerce Payments Market Value (US$ Mn), By Devices 2017-2022
TABLE 161 Canada M-Commerce Payments Market Value (US$ Mn), By Mode of Transaction 2012-2016
TABLE 162 Canada M-Commerce Payments Market Value (US$ Mn), By Mode of Transaction 2017-2022
TABLE 163 Brazil M-Commerce Payments Market Value (US$ Mn), By Mode of Payment 2012-2016
TABLE 164 Brazil M-Commerce Payments Market Value (US$ Mn), By Mode of Payment 2017-2022
TABLE 165 Brazil M-Commerce Payments Market Value (US$ Mn), By End-use Industry 2012-2016
TABLE 166 Brazil M-Commerce Payments Market Value (US$ Mn), By End-use Industry 2017-2022
TABLE 167 Brazil M-Commerce Payments Market Value (US$ Mn), By Devices 2012-2016
TABLE 168 Brazil M-Commerce Payments Market Value (US$ Mn), By Devices 2017-2022
TABLE 169 Brazil M-Commerce Payments Market Value (US$ Mn), By Mode of Transaction 2012-2016
TABLE 170 Brazil M-Commerce Payments Market Value (US$ Mn), By Mode of Transaction 2017-2022
TABLE 171 Mexico M-Commerce Payments Market Value (US$ Mn), By Mode of Payment 2012-2016
TABLE 172 Mexico M-Commerce Payments Market Value (US$ Mn), By Mode of Payment 2017-2022
TABLE 173 Mexico M-Commerce Payments Market Value (US$ Mn), By End-use Industry 2012-2016
TABLE 174 Mexico M-Commerce Payments Market Value (US$ Mn), By End-use Industry 2017-2022
TABLE 175 Mexico M-Commerce Payments Market Value (US$ Mn), By Devices 2012-2016
TABLE 176 Mexico M-Commerce Payments Market Value (US$ Mn), By Devices 2017-2022
TABLE 177 Mexico M-Commerce Payments Market Value (US$ Mn), By Mode of Transaction 2012-2016
TABLE 178 Mexico M-Commerce Payments Market Value (US$ Mn), By Mode of Transaction 2017-2022
TABLE 179 Argentina M-Commerce Payments Market Value (US$ Mn), By Mode of Payment 2012-2016
TABLE 180 Argentina M-Commerce Payments Market Value (US$ Mn), By Mode of Payment 2017-2022
TABLE 181 Argentina M-Commerce Payments Market Value (US$ Mn), By End-use Industry 2012-2016
TABLE 182 Argentina M-Commerce Payments Market Value (US$ Mn), By End-use Industry 2017-2022
TABLE 183 Argentina M-Commerce Payments Market Value (US$ Mn), By Devices 2012-2016
TABLE 184 Argentina M-Commerce Payments Market Value (US$ Mn), By Devices 2017-2022
TABLE 185 Argentina M-Commerce Payments Market Value (US$ Mn), By Mode of Transaction 2012-2016
TABLE 186 Argentina M-Commerce Payments Market Value (US$ Mn), By Mode of Transaction 2017-2022
TABLE 187 Germany M-Commerce Payments Market Value (US$ Mn), By Mode of Payment 2012-2016
TABLE 188 Germany M-Commerce Payments Market Value (US$ Mn), By Mode of Payment 2017-2022
TABLE 189 Germany M-Commerce Payments Market Value (US$ Mn), By End-use Industry 2012-2016
TABLE 190 Germany M-Commerce Payments Market Value (US$ Mn), By End-use Industry 2017-2022
TABLE 191 Germany M-Commerce Payments Market Value (US$ Mn), By Devices 2012-2016
TABLE 192 Germany M-Commerce Payments Market Value (US$ Mn), By Devices 2017-2022
TABLE 193 Germany M-Commerce Payments Market Value (US$ Mn), By Mode of Transaction 2012-2016
TABLE 194 Germany M-Commerce Payments Market Value (US$ Mn), By Mode of Transaction 2017-2022
TABLE 195 UK M-Commerce Payments Market Value (US$ Mn), By Mode of Payment 2012-2016
TABLE 196 UK M-Commerce Payments Market Value (US$ Mn), By Mode of Payment 2017-2022
TABLE 197 UK M-Commerce Payments Market Value (US$ Mn), By End-use Industry 2012-2016
TABLE 198 UK M-Commerce Payments Market Value (US$ Mn), By End-use Industry 2017-2022
TABLE 199 UK M-Commerce Payments Market Value (US$ Mn), By Devices 2012-2016
TABLE 200 UK M-Commerce Payments Market Value (US$ Mn), By Devices 2017-2022
TABLE 201 UK M-Commerce Payments Market Value (US$ Mn), By Mode of Transaction 2012-2016
TABLE 202 UK M-Commerce Payments Market Value (US$ Mn), By Mode of Transaction 2017-2022
TABLE 203 France M-Commerce Payments Market Value (US$ Mn), By Mode of Payment 2012-2016
TABLE 204 France M-Commerce Payments Market Value (US$ Mn), By Mode of Payment 2017-2022
TABLE 205 France M-Commerce Payments Market Value (US$ Mn), By End-use Industry 2012-2016
TABLE 206 France M-Commerce Payments Market Value (US$ Mn), By End-use Industry 2017-2022
TABLE 207 France M-Commerce Payments Market Value (US$ Mn), By Devices 2012-2016
TABLE 208 France M-Commerce Payments Market Value (US$ Mn), By Devices 2017-2022
TABLE 209 France M-Commerce Payments Market Value (US$ Mn), By Mode of Transaction 2012-2016
TABLE 210 France M-Commerce Payments Market Value (US$ Mn), By Mode of Transaction 2017-2022
TABLE 211 Spain M-Commerce Payments Market Value (US$ Mn), By Mode of Payment 2012-2016
TABLE 212 Spain M-Commerce Payments Market Value (US$ Mn), By Mode of Payment 2017-2022
TABLE 213 Spain M-Commerce Payments Market Value (US$ Mn), By End-use Industry 2012-2016
TABLE 214 Spain M-Commerce Payments Market Value (US$ Mn), By End-use Industry 2017-2022
TABLE 215 Spain M-Commerce Payments Market Value (US$ Mn), By Devices 2012-2016
TABLE 216 Spain M-Commerce Payments Market Value (US$ Mn), By Devices 2017-2022
TABLE 217 Spain M-Commerce Payments Market Value (US$ Mn), By Mode of Transaction 2012-2016
TABLE 218 Spain M-Commerce Payments Market Value (US$ Mn), By Mode of Transaction 2017-2022
TABLE 219 Italy M-Commerce Payments Market Value (US$ Mn), By Mode of Payment 2012-2016
TABLE 220 Italy M-Commerce Payments Market Value (US$ Mn), By Mode of Payment 2017-2022
TABLE 221 Italy M-Commerce Payments Market Value (US$ Mn), By End-use Industry 2012-2016
TABLE 222 Italy M-Commerce Payments Market Value (US$ Mn), By End-use Industry 2017-2022
TABLE 223 Italy M-Commerce Payments Market Value (US$ Mn), By Devices 2012-2016
TABLE 224 Italy M-Commerce Payments Market Value (US$ Mn), By Devices 2017-2022
TABLE 225 Italy M-Commerce Payments Market Value (US$ Mn), By Mode of Transaction 2012-2016
TABLE 226 Italy M-Commerce Payments Market Value (US$ Mn), By Mode of Transaction 2017-2022
TABLE 227 Nordic M-Commerce Payments Market Value (US$ Mn), By Mode of Payment 2012-2016
TABLE 228 Nordic M-Commerce Payments Market Value (US$ Mn), By Mode of Payment 2017-2022
TABLE 229 Nordic M-Commerce Payments Market Value (US$ Mn), By End-use Industry 2012-2016
TABLE 230 Nordic M-Commerce Payments Market Value (US$ Mn), By End-use Industry 2017-2022
TABLE 231 Nordic M-Commerce Payments Market Value (US$ Mn), By Devices 2012-2016
TABLE 232 Nordic M-Commerce Payments Market Value (US$ Mn), By Devices 2017-2022
TABLE 233 Nordic M-Commerce Payments Market Value (US$ Mn), By Mode of Transaction 2012-2016
TABLE 234 Nordic M-Commerce Payments Market Value (US$ Mn), By Mode of Transaction 2017-2022
TABLE 235 Japan M-Commerce Payments Market Value (US$ Mn), By Mode of Payment 2012-2016
TABLE 236 Japan M-Commerce Payments Market Value (US$ Mn), By Mode of Payment 2017-2022
TABLE 237 Japan M-Commerce Payments Market Value (US$ Mn), By End-use Industry 2012-2016
TABLE 238 Japan M-Commerce Payments Market Value (US$ Mn), By End-use Industry 2017-2022
TABLE 239 Japan M-Commerce Payments Market Value (US$ Mn), By Devices 2012-2016
TABLE 240 Japan M-Commerce Payments Market Value (US$ Mn), By Devices 2017-2022
TABLE 241 Japan M-Commerce Payments Market Value (US$ Mn), By Mode of Transaction 2012-2016
TABLE 242 Japan M-Commerce Payments Market Value (US$ Mn), By Mode of Transaction 2017-2022
TABLE 243 China M-Commerce Payments Market Value (US$ Mn), By Mode of Payment 2012-2016
TABLE 244 China M-Commerce Payments Market Value (US$ Mn), By Mode of Payment 2017-2022
TABLE 245 China M-Commerce Payments Market Value (US$ Mn), By End-use Industry 2012-2016
TABLE 246 China M-Commerce Payments Market Value (US$ Mn), By End-use Industry 2017-2022
TABLE 247 China M-Commerce Payments Market Value (US$ Mn), By Devices 2012-2016
TABLE 248 China M-Commerce Payments Market Value (US$ Mn), By Devices 2017-2022
TABLE 249 China M-Commerce Payments Market Value (US$ Mn), By Mode of Transaction 2012-2016
TABLE 250 China M-Commerce Payments Market Value (US$ Mn), By Mode of Transaction 2017-2022
TABLE 251 India M-Commerce Payments Market Value (US$ Mn), By Mode of Payment 2012-2016
TABLE 252 India M-Commerce Payments Market Value (US$ Mn), By Mode of Payment 2017-2022
TABLE 253 India M-Commerce Payments Market Value (US$ Mn), By End-use Industry 2012-2016
TABLE 254 India M-Commerce Payments Market Value (US$ Mn), By End-use Industry 2017-2022
TABLE 255 India M-Commerce Payments Market Value (US$ Mn), By Devices 2012-2016
TABLE 256 India M-Commerce Payments Market Value (US$ Mn), By Devices 2017-2022
TABLE 257 India M-Commerce Payments Market Value (US$ Mn), By Mode of Transaction 2012-2016
TABLE 258 India M-Commerce Payments Market Value (US$ Mn), By Mode of Transaction 2017-2022
TABLE 259 Malaysia M-Commerce Payments Market Value (US$ Mn), By Mode of Payment 2012-2016
TABLE 260 Malaysia M-Commerce Payments Market Value (US$ Mn), By Mode of Payment 2017-2022
TABLE 261 Malaysia M-Commerce Payments Market Value (US$ Mn), By End-use Industry 2012-2016
TABLE 262 Malaysia M-Commerce Payments Market Value (US$ Mn), By End-use Industry 2017-2022
TABLE 263 Malaysia M-Commerce Payments Market Value (US$ Mn), By Devices 2012-2016
TABLE 264 Malaysia M-Commerce Payments Market Value (US$ Mn), By Devices 2017-2022
TABLE 265 Malaysia M-Commerce Payments Market Value (US$ Mn), By Mode of Transaction 2012-2016
TABLE 266 Malaysia M-Commerce Payments Market Value (US$ Mn), By Mode of Transaction 2017-2022
TABLE 267 Thailand M-Commerce Payments Market Value (US$ Mn), By Mode of Payment 2012-2016
TABLE 268 Thailand M-Commerce Payments Market Value (US$ Mn), By Mode of Payment 2017-2022
TABLE 269 Thailand M-Commerce Payments Market Value (US$ Mn), By End-use Industry 2012-2016
TABLE 270 Thailand M-Commerce Payments Market Value (US$ Mn), By End-use Industry 2017-2022
TABLE 271 Thailand M-Commerce Payments Market Value (US$ Mn), By Devices 2012-2016
TABLE 272 Thailand M-Commerce Payments Market Value (US$ Mn), By Devices 2017-2022
TABLE 273 Thailand M-Commerce Payments Market Value (US$ Mn), By Mode of Transaction 2012-2016
TABLE 274 Thailand M-Commerce Payments Market Value (US$ Mn), By Mode of Transaction 2017-2022
TABLE 275 Singapore M-Commerce Payments Market Value (US$ Mn), By Mode of Payment 2012-2016
TABLE 276 Singapore M-Commerce Payments Market Value (US$ Mn), By Mode of Payment 2017-2022
TABLE 277 Singapore M-Commerce Payments Market Value (US$ Mn), By End-use Industry 2012-2016
TABLE 278 Singapore M-Commerce Payments Market Value (US$ Mn), By End-use Industry 2017-2022
TABLE 279 Singapore M-Commerce Payments Market Value (US$ Mn), By Devices 2012-2016
TABLE 280 Singapore M-Commerce Payments Market Value (US$ Mn), By Devices 2017-2022
TABLE 281 Singapore M-Commerce Payments Market Value (US$ Mn), By Mode of Transaction 2012-2016
TABLE 282 Singapore M-Commerce Payments Market Value (US$ Mn), By Mode of Transaction 2017-2022
TABLE 283 Australia M-Commerce Payments Market Value (US$ Mn), By Mode of Payment 2012-2016
TABLE 284 Australia M-Commerce Payments Market Value (US$ Mn), By Mode of Payment 2017-2022
TABLE 285 Australia M-Commerce Payments Market Value (US$ Mn), By End-use Industry 2012-2016
TABLE 286 Australia M-Commerce Payments Market Value (US$ Mn), By End-use Industry 2017-2022
TABLE 287 Australia M-Commerce Payments Market Value (US$ Mn), By Devices 2012-2016
TABLE 288 Australia M-Commerce Payments Market Value (US$ Mn), By Devices 2017-2022
TABLE 289 Australia M-Commerce Payments Market Value (US$ Mn), By Mode of Transaction 2012-2016
TABLE 290 Australia M-Commerce Payments Market Value (US$ Mn), By Mode of Transaction 2017-2022
TABLE 291 GCC Countries M-Commerce Payments Market Value (US$ Mn), By Mode of Payment 2012-2016
TABLE 292 GCC Countries M-Commerce Payments Market Value (US$ Mn), By Mode of Payment 2017-2022
TABLE 293 GCC Countries M-Commerce Payments Market Value (US$ Mn), By End-use Industry 2012-2016
TABLE 294 GCC Countries M-Commerce Payments Market Value (US$ Mn), By End-use Industry 2017-2022
TABLE 295 GCC Countries M-Commerce Payments Market Value (US$ Mn), By Devices 2012-2016
TABLE 296 GCC Countries M-Commerce Payments Market Value (US$ Mn), By Devices 2017-2022
TABLE 297 GCC Countries M-Commerce Payments Market Value (US$ Mn), By Mode of Transaction 2012-2016
TABLE 298 GCC Countries M-Commerce Payments Market Value (US$ Mn), By Mode of Transaction 2017-2022
TABLE 299 South Africa M-Commerce Payments Market Value (US$ Mn), By Mode of Payment 2012-2016
TABLE 300 South Africa M-Commerce Payments Market Value (US$ Mn), By Mode of Payment 2017-2022
TABLE 301 South Africa M-Commerce Payments Market Value (US$ Mn), By End-use Industry 2012-2016
TABLE 302 South Africa M-Commerce Payments Market Value (US$ Mn), By End-use Industry 2017-2022
TABLE 303 South Africa M-Commerce Payments Market Value (US$ Mn), By Devices 2012-2016
TABLE 304 South Africa M-Commerce Payments Market Value (US$ Mn), By Devices 2017-2022
TABLE 305 South Africa M-Commerce Payments Market Value (US$ Mn), By Mode of Transaction 2012-2016
TABLE 306 South Africa M-Commerce Payments Market Value (US$ Mn), By Mode of Transaction 2017-2022
TABLE 307 Nigeria M-Commerce Payments Market Value (US$ Mn), By Mode of Payment 2012-2016
TABLE 308 Nigeria M-Commerce Payments Market Value (US$ Mn), By Mode of Payment 2017-2022
TABLE 309 Nigeria M-Commerce Payments Market Value (US$ Mn), By End-use Industry 2012-2016
TABLE 310 Nigeria M-Commerce Payments Market Value (US$ Mn), By End-use Industry 2017-2022
TABLE 311 Nigeria M-Commerce Payments Market Value (US$ Mn), By Devices 2012-2016
TABLE 312 Nigeria M-Commerce Payments Market Value (US$ Mn), By Devices 2017-2022
TABLE 313 Nigeria M-Commerce Payments Market Value (US$ Mn), By Mode of Transaction 2012-2016
TABLE 314 Nigeria M-Commerce Payments Market Value (US$ Mn), By Mode of Transaction 2017-2022
TABLE 315 Israel M-Commerce Payments Market Value (US$ Mn), By Mode of Payment 2012-2016
TABLE 316 Israel M-Commerce Payments Market Value (US$ Mn), By Mode of Payment 2017-2022
TABLE 317 Israel M-Commerce Payments Market Value (US$ Mn), By End-use Industry 2012-2016
TABLE 318 Israel M-Commerce Payments Market Value (US$ Mn), By End-use Industry 2017-2022
TABLE 319 Israel M-Commerce Payments Market Value (US$ Mn), By Devices 2012-2016
TABLE 320 Israel M-Commerce Payments Market Value (US$ Mn), By Devices 2017-2022
TABLE 321 Israel M-Commerce Payments Market Value (US$ Mn), By Mode of Transaction 2012-2016
TABLE 322 Israel M-Commerce Payments Market Value (US$ Mn), By Mode of Transaction 2017-2022
List of Figures
FIG. 1 Global M-Commerce Payments Market Value (US$ Mn), 2012-2016
FIG. 2 Global M-Commerce Payments Market Value (US$ Mn) Forecast, 2017-2022
FIG. 3 Global M-Commerce Payments Market Value (US$ Mn) and Y-o-Y, 2015-2022
FIG. 4 Global Peer-to-peer transfer Segment Market Value (US$ Mn) By Region, 2012-2016
FIG. 5 Global Peer-to-peer transfer Segment Market Value (US$ Mn) By Region, 2017-2022
FIG. 6 Global Peer-to-peer transfer Segment Y-o-Y Growth Rate, By Region, 2015-2022
FIG. 7 Global Near Field Communication Segment Market Value (US$ Mn) By Region, 2012-2016
FIG. 8 Global Near Field Communication Segment Market Value (US$ Mn) By Region, 2017-2022
FIG. 9 Global Near Field Communication Segment Y-o-Y Growth Rate, By Region, 2015-2022
FIG. 10 Global Barcode Segment Market Value (US$ Mn) By Region, 2012-2016
FIG. 11 Global Barcode Segment Market Value (US$ Mn) By Region, 2017-2022
FIG. 12 Global Barcode Segment Y-o-Y Growth Rate, By Region, 2015-2022
FIG. 13 Global Retail Segment Market Value (US$ Mn) By Region, 2012-2016
FIG. 14 Global Retail Segment Market Value (US$ Mn) By Region, 2017-2022
FIG. 15 Global Retail Segment Y-o-Y Growth Rate, By Region, 2015-2022
FIG. 16 Global Hospitality & Tourism Segment Market Value (US$ Mn) By Region, 2012-2016
FIG. 17 Global Hospitality & Tourism Segment Market Value (US$ Mn) By Region, 2017-2022
FIG. 18 Global Hospitality & Tourism Segment Y-o-Y Growth Rate, By Region, 2015-2022
FIG. 19 Global IT & Telecommunication Segment Market Value (US$ Mn) By Region, 2012-2016
FIG. 20 Global IT & Telecommunication Segment Market Value (US$ Mn) By Region, 2017-2022
FIG. 21 Global IT & Telecommunication Segment Y-o-Y Growth Rate, By Region, 2015-2022
FIG. 22 Global BFSI Segment Market Value (US$ Mn) By Region, 2012-2016
FIG. 23 Global BFSI Segment Market Value (US$ Mn) By Region, 2017-2022
FIG. 24 Global BFSI Segment Y-o-Y Growth Rate, By Region, 2015-2022
FIG. 25 Global Media & Entertainment Segment Market Value (US$ Mn) By Region, 2012-2016
FIG. 26 Global Media & Entertainment Segment Market Value (US$ Mn) By Region, 2017-2022
FIG. 27 Global Media & Entertainment Segment Y-o-Y Growth Rate, By Region, 2015-2022
FIG. 28 Global Healthcare Segment Market Value (US$ Mn) By Region, 2012-2016
FIG. 29 Global Healthcare Segment Market Value (US$ Mn) By Region, 2017-2022
FIG. 30 Global Healthcare Segment Y-o-Y Growth Rate, By Region, 2015-2022
FIG. 31 Global Airline Segment Market Value (US$ Mn) By Region, 2012-2016
FIG. 32 Global Airline Segment Market Value (US$ Mn) By Region, 2017-2022
FIG. 33 Global Airline Segment Y-o-Y Growth Rate, By Region, 2015-2022
FIG. 34 Global Other Industries Segment Market Value (US$ Mn) By Region, 2012-2016
FIG. 35 Global Other Industries Segment Market Value (US$ Mn) By Region, 2017-2022
FIG. 36 Global Other Industries Segment Y-o-Y Growth Rate, By Region, 2015-2022
FIG. 37 Global Smart Devices Segment Market Value (US$ Mn) By Region, 2012-2016
FIG. 38 Global Smart Devices Segment Market Value (US$ Mn) By Region, 2017-2022
FIG. 39 Global Smart Devices Segment Y-o-Y Growth Rate, By Region, 2015-2022
FIG. 40 Global Feature Phones Segment Market Value (US$ Mn) By Region, 2012-2016
FIG. 41 Global Feature Phones Segment Market Value (US$ Mn) By Region, 2017-2022
FIG. 42 Global Feature Phones Segment Y-o-Y Growth Rate, By Region, 2015-2022
FIG. 43 Global Other Devices Segment Market Value (US$ Mn) By Region, 2012-2016
FIG. 44 Global Other Devices Segment Market Value (US$ Mn) By Region, 2017-2022
FIG. 45 Global Other Devices Segment Y-o-Y Growth Rate, By Region, 2015-2022
FIG. 46 Global Mobile Retailing Segment Market Value (US$ Mn) By Region, 2012-2016
FIG. 47 Global Mobile Retailing Segment Market Value (US$ Mn) By Region, 2017-2022
FIG. 48 Global Mobile Retailing Segment Y-o-Y Growth Rate, By Region, 2015-2022
FIG. 49 Global Mobile Booking/ Ticketing Segment Market Value (US$ Mn) By Region, 2012-2016
FIG. 50 Global Mobile Booking/ Ticketing Segment Market Value (US$ Mn) By Region, 2017-2022
FIG. 51 Global Mobile Booking/ Ticketing Segment Y-o-Y Growth Rate, By Region, 2015-2022
FIG. 52 Global Mobile Banking Segment Market Value (US$ Mn) By Region, 2012-2016
FIG. 53 Global Mobile Banking Segment Market Value (US$ Mn) By Region, 2017-2022
FIG. 54 Global Mobile Banking Segment Y-o-Y Growth Rate, By Region, 2015-2022
FIG. 55 Global Mobile Billing Segment Market Value (US$ Mn) By Region, 2012-2016
FIG. 56 Global Mobile Billing Segment Market Value (US$ Mn) By Region, 2017-2022
FIG. 57 Global Mobile Billing Segment Y-o-Y Growth Rate, By Region, 2015-2022
FIG. 58 Global Other Mode of Transaction Segment Market Value (US$ Mn) By Region, 2012-2016
FIG. 59 Global Other Mode of Transaction Segment Market Value (US$ Mn) By Region, 2017-2022
FIG. 60 Global Other Mode of Transaction Segment Y-o-Y Growth Rate, By Region, 2015-2022
FIG. 61 North America M-Commerce Payments Market Value (US$ Mn), By Mode of Payment 2012-2016
FIG. 62 North America M-Commerce Payments Market Value (US$ Mn), By Mode of Payment 2017-2022
FIG. 63 North America M-Commerce Payments Market Value (US$ Mn), By End-use Industry 2012-2016
FIG. 64 North America M-Commerce Payments Market Value (US$ Mn), By End-use Industry 2017-2022
FIG. 65 North America M-Commerce Payments Market Value (US$ Mn), By Devices 2012-2016
FIG. 66 North America M-Commerce Payments Market Value (US$ Mn), By Devices 2017-2022
FIG. 67 North America M-Commerce Payments Market Value (US$ Mn), By Mode of Transaction 2012-2016
FIG. 68 North America M-Commerce Payments Market Value (US$ Mn), By Mode of Transaction 2017-2022
FIG. 69 Latin America M-Commerce Payments Market Value (US$ Mn), By Mode of Payment 2012-2016
FIG. 70 Latin America M-Commerce Payments Market Value (US$ Mn), By Mode of Payment 2017-2022
FIG. 71 Latin America M-Commerce Payments Market Value (US$ Mn), By End-use Industry 2012-2016
FIG. 72 Latin America M-Commerce Payments Market Value (US$ Mn), By End-use Industry 2017-2022
FIG. 73 Latin America M-Commerce Payments Market Value (US$ Mn), By Devices 2012-2016
FIG. 74 Latin America M-Commerce Payments Market Value (US$ Mn), By Devices 2017-2022
FIG. 75 Latin America M-Commerce Payments Market Value (US$ Mn), By Mode of Transaction 2012-2016
FIG. 76 Latin America M-Commerce Payments Market Value (US$ Mn), By Mode of Transaction 2017-2022
FIG. 77 Europe M-Commerce Payments Market Value (US$ Mn), By Mode of Payment 2012-2016
FIG. 78 Europe M-Commerce Payments Market Value (US$ Mn), By Mode of Payment 2017-2022
FIG. 79 Europe M-Commerce Payments Market Value (US$ Mn), By End-use Industry 2012-2016
FIG. 80 Europe M-Commerce Payments Market Value (US$ Mn), By End-use Industry 2017-2022
FIG. 81 Europe M-Commerce Payments Market Value (US$ Mn), By Devices 2012-2016
FIG. 82 Europe M-Commerce Payments Market Value (US$ Mn), By Devices 2017-2022
FIG. 83 Europe M-Commerce Payments Market Value (US$ Mn), By Mode of Transaction 2012-2016
FIG. 84 Europe M-Commerce Payments Market Value (US$ Mn), By Mode of Transaction 2017-2022
FIG. 85 Japan M-Commerce Payments Market Value (US$ Mn), By Mode of Payment 2012-2016
FIG. 86 Japan M-Commerce Payments Market Value (US$ Mn), By Mode of Payment 2017-2022
FIG. 87 Japan M-Commerce Payments Market Value (US$ Mn), By End-use Industry 2012-2016
FIG. 88 Japan M-Commerce Payments Market Value (US$ Mn), By End-use Industry 2017-2022
FIG. 89 Japan M-Commerce Payments Market Value (US$ Mn), By Devices 2012-2016
FIG. 90 Japan M-Commerce Payments Market Value (US$ Mn), By Devices 2017-2022
FIG. 91 Japan M-Commerce Payments Market Value (US$ Mn), By Mode of Transaction 2012-2016
FIG. 92 Japan M-Commerce Payments Market Value (US$ Mn), By Mode of Transaction 2017-2022
FIG. 93 APEJ M-Commerce Payments Market Value (US$ Mn), By Mode of Payment 2012-2016
FIG. 94 APEJ M-Commerce Payments Market Value (US$ Mn), By Mode of Payment 2017-2022
FIG. 95 APEJ M-Commerce Payments Market Value (US$ Mn), By End-use Industry 2012-2016
FIG. 96 APEJ M-Commerce Payments Market Value (US$ Mn), By End-use Industry 2017-2022
FIG. 97 APEJ M-Commerce Payments Market Value (US$ Mn), By Devices 2012-2016
FIG. 98 APEJ M-Commerce Payments Market Value (US$ Mn), By Devices 2017-2022
FIG. 99 APEJ M-Commerce Payments Market Value (US$ Mn), By Mode of Transaction 2012-2016
FIG. 100 APEJ M-Commerce Payments Market Value (US$ Mn), By Mode of Transaction 2017-2022
FIG. 101 MEA M-Commerce Payments Market Value (US$ Mn), By Mode of Payment 2012-2016
FIG. 102 MEA M-Commerce Payments Market Value (US$ Mn), By Mode of Payment 2017-2022
FIG. 103 MEA M-Commerce Payments Market Value (US$ Mn), By End-use Industry 2012-2016
FIG. 104 MEA M-Commerce Payments Market Value (US$ Mn), By End-use Industry 2017-2022
FIG. 105 MEA M-Commerce Payments Market Value (US$ Mn), By Devices 2012-2016
FIG. 106 MEA M-Commerce Payments Market Value (US$ Mn), By Devices 2017-2022
FIG. 107 MEA M-Commerce Payments Market Value (US$ Mn), By Mode of Transaction 2012-2016
FIG. 108 MEA M-Commerce Payments Market Value (US$ Mn), By Mode of Transaction 2017-2022
Copyright © Transparency Market Research, Inc. All Rights reserved
Trust Online

M-Commerce Payments Market